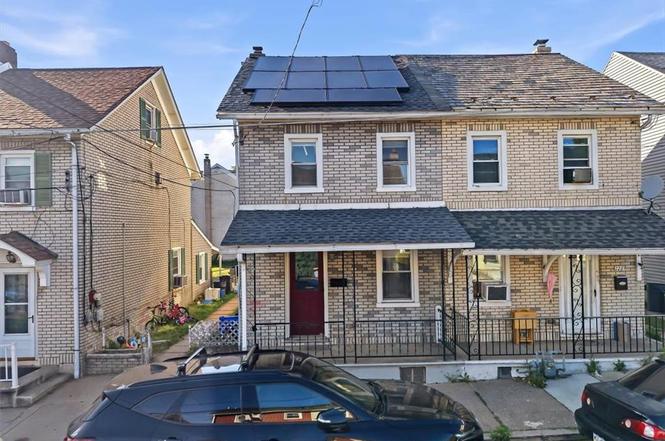
226 Church St · Catasauqua, PA
Flood risk 1/10 · Minimal
- FEMA flood zone
- X (unshaded)
- Chance of flooding over 30 yrs
- 0.0%
- Est. flood insurance / yr
- $473 – $860
Fire risk 1/10 · Minimal
- Est. fire insurance / yr
- $511 – $949
Heat risk 5/10 · Moderate
- Hot days now (above 99°F)
- 7 days/yr
- Hot days in 30 yrs
- 15 days/yr
Wind risk 4/10 · Minor
- Chance of severe wind over 30 yrs
- 15.0%
Air-quality risk 2/10 · Minimal
- Unhealthy air days now
- 0 days/yr
- Unhealthy air days in 30 yrs
- 1 days/yr
Risk factors via First Street. Map © Google.
Why this score? — see what drove the D+ grade
The composite is a weighted blend of 9 inputs, each scored 0–100. Each bar is that input's sub-score; the figure is the points it added to the 100-point composite (weight × sub-score).
- Cash flow +15.9/30.0
- ARV discount +8.4/15.0
- DSCR +4.9/10.0
- 1% rule +4.4/10.0
- Livability +3.8/5.0
- Schools +2.8/10.0
- Rent growth +2.5/5.0
- Condition / age +2.5/5.0
- Appreciation +0.0/10.0
$199,900
🖨 Deal sheet (PDF) 📄 Offer letter ✓ Due diligence
Listing remarks MLS
Completely remodeled 3 bedroom twin! This home features an open floor plan living room & dining room with gorgeous hardwood floors. The large kitchen boasts newer cabinets & stainless steel appliances! Beautiful full bathroom with a new vanity. Newer carpets and windows throughout! Great fenced in backyard with outside storage area. Covered front porch. Move in ready!!! Minutes from the Lehigh Valley Airport, Lehigh River & Rt 22. Don't miss out! Call TODAY!
Key facts
- Covered front porch
- Flexible bonus space
- Finished third floor
Tags
Property features AI
Exterior
- Parking: On-street parking
- Utilities: Public water; Public sewer; Cable available; 100 amp electrical service with circuit breakers
- Home design: 2-story property; Has a view; Zoned R3
- Construction: Brick and vinyl siding exterior; Asphalt/fiberglass roof; Partially finished below-grade area
- Exterior features: Porch; Fence; Yard fenced; Flat lot; Not in subdivision; Public road frontage; Paved road
Interior
- Kitchen: Dishwasher; Electric oven; Electric range; Refrigerator
- Bedrooms: Total rooms: 7; Has basement (partially finished)
- Flooring: Ceramic tile; Hardwood; Laminate; Resilient flooring
- Bathrooms: 1 full bathroom
- Heating & cooling: Gas heating with baseboard; Wall/window cooling units
- Interior features: Dining area; Separate/formal dining room; Eat-in kitchen; Wired for data
- Laundry & utility: Washer; Dryer; Laundry located on lower level; Gas water heater
Neighborhood map
What this means for you Summary
Snapshot
- This is a 2-bed/1.0-bath townhouse listed at $200k.
Deal economics
- At list price, monthly cash flow is $95 ($1k/yr) — positive.
- The deal already cash-flows at list — no discount required.
- To meet the 1% rule (rent ≥ 1% of price), the offer needs to be $188k (5.7% below list).
- Recommended offer: $188k (5.7% below list) — sets the bar for 1% rule.
- Cap rate 6.9% vs local median 4.9% in Catasauqua — top-decile yield for the area; either an underpriced asset or a hidden risk that comps aren't pricing in. Stress-test before assuming the spread holds.
Location & tenants
- Location reads 75/100 on livability (#443 in PA, #4,039 nationally) — a middle-class / working-renter tenant base. Strengths: cost of living A+, housing A+, health & safety A+; Watch: amenities F, commute F.
- Catasauqua Area SD (suburban): math 23% / reading 41% proficiency, ranked #431 of 539 in PA (top 80%) — families likely to look elsewhere, expect single-tenant / working-renter base with shorter leases.
- Zoned schools: Francis H Sheckler El Sch (math 27% / reading 47%, grade F, #1,004 of 1,518 statewide, top 68%, 534 students, 100% FRL); Catasauqua Ms (math 17% / reading 40%, grade F, #395 of 512 statewide, top 78%, 448 students, 100% FRL); Catasauqua Shs (math 42% / reading 24%, grade F, #325 of 437 statewide, top 75%, 473 students, 81% FRL) — zoned schools average 94% FRL vs 39% district-wide (54 pts higher); higher-poverty schools than district average — tighter screening recommended.
- Market conditions: 49 active listings in the ZIP; 16 comparable units currently listed for rent nearby; rentals at typical pace (median 16d on market — plan ~3-4 weeks tenant-placement turnaround); solid renter incomes; 765 units permitted in Lehigh County in 2024 (286 in 5+ unit buildings).
Forward outlook
- Local home prices are declining (-3.0%/yr); year-one equity from $1k of loan paydown is wiped out by about $6k of value loss. Plan a longer hold.
- Lehigh County population projected at +21% by 2050 — long-run rental-demand tailwind backs the buy-and-hold thesis.
Negotiation context
- Only 4 days on market — expect competitive offers; lowballing is unlikely to land.
- 10 sale attempts since 19y ago with the ask held roughly flat each time — persistent listings suggest the price (not the market) is what's stuck; bring a comps-based counter.
- Current owner paid $110k; list at $200k implies a 82% gain — meaningful room to come down on a strong offer.
Risks & watch-outs
- Watch-outs: built in 1860 — expect roof / HVAC / electrical / plumbing capex.
- Climate carrying-cost: extreme-heat days projected 7→15/yr by 2055 (HVAC capex compounding) — expect insurance premiums to compound above CPI over the hold.
Questions for the listing agent
- Built in 1860 — when were the roof, HVAC, electrical panel, plumbing, and water heater last replaced?
- Is there a deadline driving the sale (1031 exchange, divorce, estate, relocation)? That informs how much negotiation room exists.
- The area grade is low — what's the realistic commute time and amenity access for the typical tenant pool here? Any planned neighborhood developments (good or bad) we should know about?
- What's the average days-on-market for RENTAL listings here right now (not sales)? A rising rental-DOM trend means longer vacancies and softer asking-rent achievability than the comps imply.
- What's the recent tenant-quality profile in this submarket — average credit score on applications, eviction rate, late-payment / NSF rate, and stable-employment percentage? A property-management company in the area should have these aggregated.
- How much new for-sale + rental construction is in the pipeline within 1–3 miles? Heavy new supply typically softens prices + rents 12–24 months out; constrained supply supports both.
Investment metrics
- 1% rule
- 0.94% ✗
- Cap rate
- 6.86%
- Cash-on-cash
- 2.04%
- DSCR
- 1.09
- GRM
- 8.8
CMA / ARV
- ARV (on-the-fly)
- $203,792
- Comps found
- 12
Show comp detail 12 sales within ~0.75 mi
| Address | Dist | Beds/Ba | Sqft | Sold | Price | $/sf | Match |
|---|---|---|---|---|---|---|---|
| 220 Mulberry St | 0.17mi | 2/1.0 | 1,105 (+2%) | 7mo | $160,000 | $145 | 83 |
| 230 Peach St | 0.06mi | 3/1.0 (+1) | 1,138 (+5%) | 12mo | $190,000 | $167 | 74 |
| 327 Church St | 0.06mi | 3/1.0 (+1) | 1,023 (-6%) | 13mo | $200,000 | $196 | 72 |
| 142 Front St | 0.23mi | 3/1.0 (+1) | 1,136 (+5%) | 7mo | $206,000 | $181 | 70 |
| 419 Crane St | 0.06mi | 3/1.0 (+1) | 1,152 (+6%) | 14mo | $184,500 | $160 | 70 |
| 411 Limestone St | 0.02mi | 3/1.0 (+1) | 1,187 (+10%) | 11mo | $231,000 | $195 | 69 |
| 219 Mulberry St | 0.18mi | 2/1.0 | 974 (-10%) | 8mo | $169,900 | $174 | 68 |
| 344 American St | 0.19mi | 3/1.5 (+1) | 1,168 (+8%) | 13mo | $269,900 | $231 | 60 |
| 2114 Main St | 0.56mi | 3/1.0 (+1) | 1,080 (-0%) | 10mo | $202,500 | $188 | 60 |
| 1028 Railroad St | 0.47mi | 2/1.0 | 945 (-13%) | 3mo | $180,000 | $190 | 54 |
| 324 Walnut St | 0.26mi | 3/1.5 (+1) | 1,243 (+15%) | 4mo | $215,000 | $173 | 53 |
| 258 Poplar St | 0.57mi | 3/1.5 (+1) | 1,216 (+12%) | 2mo | $250,000 | $206 | 45 |
Match score weights: distance 35% · size 25% · config 20% · recency 20%. Top-matched comps best support the ARV.
Projected returns pro-forma
-3.0% appreciation · 3.0% rent growth · sell at horizon
- IRR
- -13.0%
- Equity multiple
- 0.53×
- Total profit
- $-26,298
- Equity at exit
- $29,806
- IRR
- -4.0%
- Equity multiple
- 0.73×
- Total profit
- $-14,953
- Equity at exit
- $17,284
Cash invested: $55,972 (down + closing). Projections, not guarantees.
Landlord ↔ Tenant lean methodology
- Overall (STATE)
- 62 Landlord-Friendly
- State Pennsylvania
- 62 Landlord-Friendly · EVEN
- County
- — inherits STATE
- City
- — inherits STATE
ZIP-level market 18032
- Home prices YoY
- -34.7%
- Active inventory
- 49
- Price-to-rent
- 8.8×
Monthly cashflow live
- Estimated rent
- $1,884 high interval (Pro) →
- Mortgage (P&I)
- −$1,048
- Tax from tax record
- −$262 /mo · $3,145/yr
- Insurance
- −$83
- HOA
- −$0
- Vacancy / Maint / Mgmt
- −$396
- Net cashflow
- $95
Break-even live
Sensitivity live
| Price | -10% $208 | -5% $152 | +0% $95 | +5% $39 | +10% $-18 |
|---|---|---|---|---|---|
| Rent | -10% $-54 | -5% $21 | +0% $95 | +5% $170 | +10% $244 |
| Rate | -1.0pp $196 | -0.5pp $146 | base $95 | +0.5pp $43 | +1.0pp $-9 |
UW: 25.0% down · 7.5% · 30yr · 1.5% tax · 5.0% vac · 8.0% maint · 8.0% mgmt
Financing live
Cash to close
- Down payment
- $49,975
- Closing costs
- $5,997
- Reserves months
- —
- Total cash needed
- —
Loan-product check · same deal, 3 products live
Conventional
25% down · 7.5% · 30yr
- Down + closing
- —
- Monthly P&I
- —
- Monthly cashflow
- —
- DSCR
- —
- Eligible?
- —
Personal DTI + credit; lowest rate.
DSCR
20% down · 8.5% · 30yr
- Down + closing
- —
- Monthly P&I
- —
- Monthly cashflow
- —
- DSCR
- —
- Eligible?
- —
No personal income docs; deal must DSCR.
Hard money
10% down · 12.0% · 12mo
- Down + closing
- —
- Monthly P&I
- —
- Monthly cashflow
- —
- DSCR
- —
- Eligible?
- —
Short-term bridge; refi at stabilization.
Rent comps 16 comps
| Address | Beds | Baths | Sqft | Rent | $/sqft | DOM | Units | Dist |
|---|---|---|---|---|---|---|---|---|
| 311 Church St Catasauqua, PA | 3.0 | 1.5 | 1500 | $2,275 | $1.52 | 4d | 1 | 0.06mi |
| 423 Front St #2 Catasauqua, PA | 3.0 | 1.0 | 1150 | $1,750 | $1.52 | 4d | 1 | 0.12mi |
| 146 Front St Unit 2 Catasauqua, PA | 3.0 | 1.0 | 800 | $1,400 | $1.75 | 25d | 1 | 0.24mi |
| 324 Walnut St Catasauqua, PA | 3.0 | 1.5 | 1243 | $2,000 | $1.61 | 45d | 1 | 0.25mi |
| 119 School St Catasauqua, PA | 2.0 | 1.0 | 931 | $2,100 | $2.26 | 4d | 1 | 0.27mi |
| 729 3rd St Whitehall, PA | 3.0 | 2.0 | 1100 | $2,500 | $2.27 | 23d | 1 | 0.30mi |
| 1108 3rd St Catasauqua, PA | 3.0 | 2.0 | 1400 | $1,795 | $1.28 | 4d | 1 | 0.48mi |
| 1219 3rd St Unit 1 Catasauqua, PA | 2.0 | 1.0 | 825 | $1,675 | $2.03 | 16d | 1 | 0.61mi |
| 895 Walnut St Catasauqua, PA | 2.0 | 1.0 | 860 | $1,602 | $1.86 | 4d | 1 | 0.67mi |
| 1239 Washington St Whitehall, PA | 2.0 | 1.0 | 1013 | $1,375 | $1.36 | 45d | 1 | 0.76mi |
| 5 Stonewood Pl Catasauqua, PA | 3.0 | 1.5 | 1184 | $2,300 | $1.94 | 15d | 1 | 0.84mi |
| 121 E Union St Whitehall, PA | 2.0 | 1.0 | 794 | $2,400 | $3.02 | 16d | 1 | 0.85mi |
| 1301 Mickley Rd Whitehall, PA | 1.0 | 1.0 | 756 | $1,445 | $1.91 | 45d | 1 | 0.99mi |
| 3124 N 2nd St Whitehall, PA | 2.0 | 1.0 | 1139 | $1,750 | $1.54 | 4d | 1 | 1.11mi |
| 134 S 3rd St Apt B Coplay, PA | 3.0 | 2.0 | 1250 | $2,299 | $1.84 | 46d | 1 | 1.46mi |
| 134 S 3rd St Apt B Coplay, PA | 3.0 | 2.0 | 1250 | $2,299 | $1.84 | 20d | 1 | 1.46mi |
Listing history 3 events
-
2026-06-22days on market $199,900 Active 4 DOM
-
2026-06-17remarks 699-char remark
-
2026-06-17$199,900 Active 1 DOM
ⓘ Source: listings_history table (triggers on properties + properties_extension) + one-shot
backfill from property_details.listing_events for pre-trigger history.
Tax reassessment forecast PA · Partial reset (capped growth)
- Current annual tax
- $3,145 · $262/mo
- Projected year-2 tax
- $3,151 · $263/mo
- Expected delta
- +$7/yr (+$1/mo · 0.2%)
ⓘ Screening estimate from a state-policy table — verify with the county assessor before closing.
Climate risk First Street
- Flood 1/10 Low FEMA zone X (unshaded) · 0% chance over 30 yrs
- Wildfire 1/10 Low
- Heat 5/10 Major 7 d/yr ≥99°F today · 15 d/yr by 30 yrs out
- Wind 4/10 Moderate 15% chance of damaging wind over 30 yrs
- Air quality 2/10 Low 0 unhealthy d/yr today · 1 by 30 yrs out
Nearby sold comps map
Loading sold comps map…
Walkable amenities ~0.75 mi
Loading nearby amenities…
Taxation est. · year 1
- Rental income
- $22,614
- − Mortgage interest
- −$11,198
- − Property taxes
- −$3,145
- − Insurance
- −$1,000
- − Repairs & maintenance
- −$1,809
- − Management
- −$1,809
- − Depreciation
- −$5,815
- Taxable loss
- −$2,161
- Est. tax savings @ 24.0%
- +$519
- After-tax cash flow
- $1,660/yr
For passive investors: Depreciation is non-cash, so a rental often shows a tax loss while cash-flowing — sheltering income. Rental losses are passive: they offset passive income freely, and up to $25,000/yr can offset ordinary (W-2) income if you actively participate and your MAGI is under $100k (phasing out to $0 by $150k); unused losses carry forward. On sale, claimed depreciation is recaptured at up to 25%, and gains may owe capital-gains tax (a 1031 exchange can defer both). Figures are a year-1 estimate at your 24.0% rate — not tax advice; consult a CPA.
Schools (NCES district)
- District
- Catasauqua Area SD
- NCES district ID
- 4205160
- Math proficiency
- 23% ▼ -15.00%
- Reading proficiency
- 41% ▼ -21.00%
- Median HH income
- $53,073
- Composite
- 28.09/100
- National rank
- #6832
- State rank
- #431 of 539 in PA
Livability — Catasauqua
- Score
- 75/100
- State rank
- #443
- US rank
- #4039
Category grades
Schools grade is shown separately in the Schools card above.
Census & demographics
- Census place
- Catasauqua, PA
- County
- Lehigh County · 333,019 people
- City population
- 9,555
- Metro
- Allentown-Bethlehem-Easton, PA-NJ
- Population (ZIP)
- 9,555
- Household income
- $81,098
- Rent vs Own
- Severe rent burden
- 221.0
Population outlook (Lehigh County) Hauer SSP2
- Today (2025)
- 392,957 people
- By 2030
- 408,319 · +3.9%
- By 2040
- 440,007 · +12.0%
- By 2050
- 475,940 · +21.1%
- By 2075
- 590,448 · +50.3%
- By 2100
- 690,314 · +75.7%
Race, ethnicity, and origin ACS 2023
- Neighborhood character
- Predominantly White (79%)
- Race & ethnicity
- White 79% Hispanic / Latino 15% Two or more races 12% Black 3%
- Hispanic origin (detail)
- Puerto Rican 10% Dominican 1%
- Common ancestry
- Danish 4% Polish 3% Romanian 2%
- Foreign-born
- 4% · Canada
- Languages at home
- 91% English-only · Spanish 8%
Political lean MEDSL · Lehigh
- 2024 margin
- Toss-up / Even · D 50.7% · R 48.0% · Other 1.2%
- 2008→2024 swing
- -12.9pp toward R · 2008: 15.6pp · 2024: 2.7pp
- All cycles
- 2024: D+2.7 2020: D+7.6 2016: D+4.4 2012: D+7.5 2008: D+15.6
Not yet ingested
- Civics
- —
Market trends
- HPI YoY
- ▼ -159.00%
- Current HPI
- 299.4376
- Rent YoY
- —
- Metro
- Allentown-Bethlehem-Easton, PA-NJ
- State GDP YoY
- ▲ 1.68%
- F500 in state
- 34
Industry mix (Fortune 500 HQ in PA)
| Industry | F500 HQs | Revenue |
|---|---|---|
| Healthcare | 2 | $309B |
|
||
| Insurance | 2 | $27B |
|
||
| Telecommunications / Media | 1 | $124B |
|
||
| Industrial Distribution | 1 | $22B |
|
||
| Financial Services | 1 | $20B |
|
||
| Chemicals / Materials | 1 | $18B |
|
||
Price history
+387.6% since first listed26 events — show timeline
- 2026-06-15 Listed $199,900 GLVRMLS
- 2018-05-21 Sold (Public Records) $109,900 Public Records
- 2018-05-18 Sold (MLS) $109,900 TREND
- 2018-05-18 Sold (MLS) $109,900 BRIGHT MLS
- 2018-05-18 Sold (MLS) $109,900 GLVRMLS
- 2018-04-07 Pending — BRIGHT MLS
- 2018-04-07 Pending — TREND
- 2018-04-07 Pending — GLVRMLS
- 2018-03-28 Listed $109,900 TREND
- 2018-03-28 Listed $109,900 BRIGHT MLS
- 2018-03-27 Listed $109,900 GLVRMLS
- 2013-07-10 Listing Removed — BRIGHT MLS
- 2013-07-10 Listing Removed — GLVRMLS
- 2012-08-14 Listed $89,900 BRIGHT MLS
- 2012-08-14 Listed $89,900 GLVRMLS
- 2012-06-01 Sold (MLS) $45,000 GLVRMLS
- 2012-04-27 Listed $47,500 GLVRMLS
- 2008-12-21 Sold (Public Records) $75,000 Public Records
- 2008-03-10 Sold (Public Records) $112,000 Public Records
- 2008-03-10 Sold (MLS) $112,000 GLVRMLS
- 2008-02-09 Listed $119,900 GLVRMLS
- 2007-12-21 Sold (MLS) $75,000 GLVRMLS
- 2007-12-21 Sold (MLS) $75,000 GLVRMLS
- 2007-11-04 Listed $69,450 GLVRMLS
- 2007-11-04 Listed $69,450 GLVRMLS
- 1994-11-01 Sold (Public Records) $41,000 Public Records
Property tax history
+4.6%/yrLatest (2026): $3,145 · +3.4% YoY. Source: county tax records.
Cash-flow waterfall
monthlySold comps — $/sqft
last 12 mo · ≤1 miLoading sold comps…