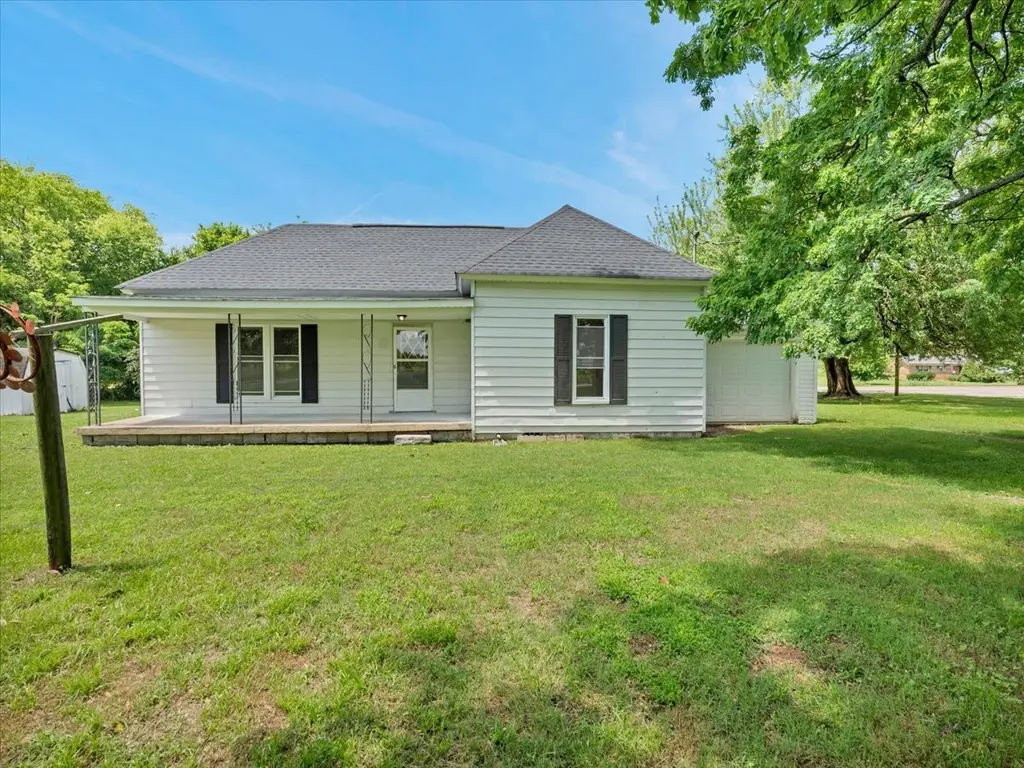
7691 Elkton Pike · Elkton, TN
Flood risk 1/10 · Minimal
- FEMA flood zone
- X (unshaded)
- Chance of flooding over 30 yrs
- 0.0%
- Est. flood insurance / yr
- $507 – $1,088
Fire risk 4/10 · Minor
- Est. fire insurance / yr
- $949 – $1,763
Heat risk 6/10 · Moderate
- Hot days now (above 105°F)
- 7 days/yr
- Hot days in 30 yrs
- 19 days/yr
Wind risk 4/10 · Minor
- Chance of severe wind over 30 yrs
- 20.0%
Air-quality risk 1/10 · Minimal
- Unhealthy air days now
- 0 days/yr
- Unhealthy air days in 30 yrs
- 0 days/yr
Risk factors via First Street. Map © Google.
Why this score? — see what drove the A- grade
The composite is a weighted blend of 9 inputs, each scored 0–100. Each bar is that input's sub-score; the figure is the points it added to the 100-point composite (weight × sub-score).
- Cash flow +28.3/30.0
- ARV discount +15.0/15.0
- DSCR +10.0/10.0
- Appreciation +10.0/10.0
- 1% rule +7.8/10.0
- Livability +2.9/5.0
- Rent growth +2.5/5.0
- Condition / age +2.2/5.0
- Schools +1.9/10.0
$125,000
🖨 Deal sheet 📄 Offer letter ✓ Due diligence
Listing remarks
Great investment opportunity in Giles County! Conveniently located to I-65, Less than 10 min to Ardmore, TN, approx 45 minutes to Huntsville, AL. Sold as-is with lots of potential, come check it out today!
Key facts
- 0.6 acre lot
- Built 1980
- Listed 8 days
Property features AI
Finance
- Financial info: Annual tax amount listed ($766)
Exterior
- Parking: No covered parking listed; No total parking spaces listed
- Utilities: Private water; Septic tank; Water available
- Home design: Single-family residence; One story
- Construction: Vinyl siding
- Exterior features: Approximately 0.6-acre lot
Interior
- Kitchen: Electric range; Refrigerator
- Bedrooms: 2 bedrooms (both on the main level); Bedroom sizes approximately 10 x 12 and 14 x 12
- Flooring: Laminate flooring
- Bathrooms: 2 full bathrooms
- Heating & cooling: Central heating; Central air conditioning
- Interior features: Crawl space basement; Electric range; Refrigerator
Neighborhood map
What this means for you Summary
Snapshot
- This is a 2-bed/2.0-bath single-family listed at $125k. Condition is rated fair.
Deal economics
- At list price, monthly cash flow is $401 ($5k/yr) — positive.
- The deal already cash-flows at list — no discount required.
- Meets the 1% rule at list price ($2k rent vs $125k).
Location & tenants
- Location reads 57/100 on livability (#325 in TN) — a working-class tenant base; expect higher turnover. Strengths: cost of living A+, housing A+; Watch: health & safety C-, crime F, amenities F.
- Giles County (rural): math 20% / reading 24% proficiency, ranked #105 of 139 in TN (top 76%) — low school quality limits family demand, transient renter base, plan for 1-2y turnover.
- Zoned schools: Elkton Elementary (math 12% / reading 22%, grade F, #709 of 952 statewide, top 77%, 277 students, 0% FRL); Giles Co High School (math 8% / reading 22%, grade F, #237 of 332 statewide, top 75%, 703 students, 0% FRL) — zoned schools average 0% FRL vs 50% district-wide (50 pts lower); this property's tenant base skews higher-income than the district average.
- Market conditions: 23 active listings in the ZIP; 73 units permitted in Giles County in 2024 (0 in 5+ unit buildings).
Forward outlook
- In year one you build about $13k of equity ($864 loan paydown + $12k appreciation (10.0% local appreciation)).
- Giles County population projected at -10% by 2050 — secular population decline; favor cash flow + early exit over multi-decade hold.
- At projected returns (10.0% appreciation + 3.0% rent growth), your $35k cash investment doubles in ~2 years — after that, you're playing with house money.
- By year 3, paydown + projected appreciation supports a ~$34k cash-out refi (75% LTV) — recoverable capital for the next deal without selling this one.
Negotiation context
- Only 8 days on market — expect competitive offers; lowballing is unlikely to land.
Risks & watch-outs
- Climate carrying-cost: extreme-heat days projected 7→19/yr by 2055 (HVAC capex compounding) — expect insurance premiums to compound above CPI over the hold.
Questions for the listing agent
- Have any recent inspections been done? Can we get a copy of the seller's disclosures and any deferred-maintenance estimates?
- Is there a deadline driving the sale (1031 exchange, divorce, estate, relocation)? That informs how much negotiation room exists.
- Schools are F-rated, which usually means shorter tenancies and higher turnover. Who's the typical renter profile here, and what's been the actual vacancy rate?
- Crime grade is F in this area — have there been break-ins, vandalism, or insurance claims at this property in the last 3 years? What carrier currently insures it and at what premium?
- What's the average days-on-market for RENTAL listings here right now (not sales)? A rising rental-DOM trend means longer vacancies and softer asking-rent achievability than the comps imply.
- What's the recent tenant-quality profile in this submarket — average credit score on applications, eviction rate, late-payment / NSF rate, and stable-employment percentage? A property-management company in the area should have these aggregated.
- How much new for-sale + rental construction is in the pipeline within 1–3 miles? Heavy new supply typically softens prices + rents 12–24 months out; constrained supply supports both.
Investment metrics
- 1% rule
- 1.28% ✓
- Cap rate
- 10.15%
- Cash-on-cash
- 13.76%
- DSCR
- 1.61
- GRM
- 6.5
CMA / ARV
- ARV (on-the-fly)
- $215,788
- Comps found
- 1
Show comp detail 1 sale within ~0.75 mi
| Address | Dist | Beds/Ba | Sqft | Sold | Price | $/sf | Match |
|---|---|---|---|---|---|---|---|
| 276 Long Rd | 0.25mi | 3/1.0 (+1) | 1,428 (-3%) | 21mo | $207,900 | $146 | 56 |
Match score weights: distance 35% · size 25% · config 20% · recency 20%. Top-matched comps best support the ARV.
Projected returns pro-forma
10.0% appreciation · 3.0% rent growth · sell at horizon
- IRR
- 34.4%
- Equity multiple
- 3.68×
- Total profit
- $93,671
- Equity at exit
- $112,610
- IRR
- 29.7%
- Equity multiple
- 8.31×
- Total profit
- $255,788
- Equity at exit
- $242,848
Cash invested: $35,000 (down + closing). Projections, not guarantees.
Landlord ↔ Tenant lean methodology
- Overall (STATE)
- 87 Strongly Landlord-Friendly
- State Tennessee
- 87 Strongly Landlord-Friendly · R+13
- County
- — inherits STATE
- City
- — inherits STATE
ZIP-level market 38477
- Home prices YoY
- 8.7%
- Active inventory
- 23
- Price-to-rent
- 6.5×
Monthly cashflow live
- Estimated rent
- $1,602 medium interval (Pro) →
- Mortgage (P&I)
- −$656
- Tax est. 1.5%
- −$156 /mo · $1,875/yr
- Insurance
- −$52
- HOA
- −$0
- Vacancy / Maint / Mgmt
- −$336
- Net cashflow
- $401
Break-even live
UW: 25.0% down · 7.5% · 30yr · 1.5% tax · 5.0% vac · 8.0% maint · 8.0% mgmt
Financing live
Cash to close
- Down payment
- $31,250
- Closing costs
- $3,750
- Reserves months
- —
- Total cash needed
- —
Loan-product check · same deal, 3 products live
Conventional
25% down · 7.5% · 30yr
- Down + closing
- —
- Monthly P&I
- —
- Monthly cashflow
- —
- DSCR
- —
- Eligible?
- —
Personal DTI + credit; lowest rate.
DSCR
20% down · 8.5% · 30yr
- Down + closing
- —
- Monthly P&I
- —
- Monthly cashflow
- —
- DSCR
- —
- Eligible?
- —
No personal income docs; deal must DSCR.
Hard money
10% down · 12.0% · 12mo
- Down + closing
- —
- Monthly P&I
- —
- Monthly cashflow
- —
- DSCR
- —
- Eligible?
- —
Short-term bridge; refi at stabilization.
Listing history 7 events
-
2026-06-18days on market $125,000 Active 8 DOM
-
2026-06-17days on market $125,000 Active 7 DOM
-
2026-06-16days on market $125,000 Active 6 DOM
-
2026-06-15days on market $125,000 Active 5 DOM
-
2026-06-13days on market $125,000 Active 3 DOM
-
2026-06-12remarks 206-char remark
-
2026-06-12$125,000 Active 2 DOM
ⓘ Source: listings_history table (triggers on properties + properties_extension) + one-shot
backfill from property_details.listing_events for pre-trigger history.
Climate risk First Street
- Flood 1/10 Low FEMA zone X (unshaded) · 0% chance over 30 yrs
- Wildfire 4/10 Moderate
- Heat 6/10 Major 7 d/yr ≥105°F today · 19 d/yr by 30 yrs out
- Wind 4/10 Moderate 20% chance of damaging wind over 30 yrs
- Air quality 1/10 Low 0 unhealthy d/yr today · 0 by 30 yrs out
Nearby sold comps map
Loading sold comps map…
Walkable amenities ~0.75 mi
Loading nearby amenities…
Taxation est. · year 1
- Rental income
- $19,220
- − Mortgage interest
- −$7,002
- − Property taxes
- −$1,875
- − Insurance
- −$625
- − Repairs & maintenance
- −$1,538
- − Management
- −$1,538
- − Depreciation
- −$3,636
- Taxable income
- $3,006
- Est. tax owed @ 24.0%
- −$722
- After-tax cash flow
- $4,096/yr
For passive investors: Depreciation is non-cash, so a rental often shows a tax loss while cash-flowing — sheltering income. Rental losses are passive: they offset passive income freely, and up to $25,000/yr can offset ordinary (W-2) income if you actively participate and your MAGI is under $100k (phasing out to $0 by $150k); unused losses carry forward. On sale, claimed depreciation is recaptured at up to 25%, and gains may owe capital-gains tax (a 1031 exchange can defer both). Figures are a year-1 estimate at your 24.0% rate — not tax advice; consult a CPA.
Condition & rehab AI · 13 photos
The home presents a moderate renovation opportunity with average condition. Upgrading the kitchen and bathrooms, along with freshening the exterior, can significantly enhance its value.
Repairs flagged
- Moderate Kitchen cabinets — Worn appearance and dated design.
- Moderate Bathroom fixtures — Dated appearance and need for updating.
- Minor Exterior siding — Some discoloration, minor touch-up needed.
- Minor Landscaping — Basic appearance, could benefit from some updates.
Value-add opportunities
- Resale Kitchen renovation — Modernizing the kitchen can significantly increase the home's appeal and value.
- Resale Bathroom updates — Updating bathrooms with modern fixtures and finishes can enhance the home's value.
- Both Exterior painting and landscaping — Fresh paint and landscaping can improve curb appeal and attract more buyers/renters.
Renovation cost estimate screening
| Repair item | Severity | Est. cost |
|---|---|---|
| Kitchen cabinets · Worn appearance and dated design. | Moderate | $3,000–15,000 |
| Bathroom fixtures · Dated appearance and need for updating. | Moderate | $3,000–15,000 |
| Exterior siding · Some discoloration, minor touch-up needed. | Minor | $500–3,000 |
| Landscaping · Basic appearance, could benefit from some updates. | Minor | $500–3,000 |
| Total estimated repair cost · 4 items | $7,000–36,000 |
Value-add ROI direction
- Resale Kitchen renovation — Modernizing the kitchen can significantly increase the home's appeal and value. ↑
- Resale Bathroom updates — Updating bathrooms with modern fixtures and finishes can enhance the home's value. ↑
- Both Exterior painting and landscaping — Fresh paint and landscaping can improve curb appeal and attract more buyers/renters. ↑
ⓘ Cost ranges are severity-bucket heuristics (US national rule-of-thumb). Get contractor quotes + a written scope before underwriting a rehab budget.
Schools (NCES district)
- District
- Giles County
- NCES district ID
- 4701410
- Math proficiency
- 20% ▼ -18.00%
- Reading proficiency
- 24% ▼ -7.00%
- Median HH income
- $40,318
- Composite
- 18.63/100
- National rank
- #8895
- State rank
- #105 of 139 in TN
Livability — Elkton
- Score
- 57/100
- State rank
- #325
- US rank
- #21687
Category grades
Schools grade is shown separately in the Schools card above.
Census & demographics
- Census place
- Elkton, TN
- City population
- 128
- Population (ZIP)
- 2,833
Population outlook (Giles County) Hauer SSP2
- Today (2025)
- 28,505 people
- By 2030
- 27,960 · -1.9%
- By 2040
- 26,740 · -6.2%
- By 2050
- 25,665 · -10.0%
- By 2075
- 24,798 · -13.0%
- By 2100
- 25,524 · -10.5%
Race, ethnicity, and origin ACS 2023
- Neighborhood character
- Predominantly White (91%)
- Race & ethnicity
- White 91% Black 7% Two or more races 2%
- Common ancestry
- Slovak 3% Iranian 2% Serbian 1%
- Foreign-born
- 2% · Canada
- Languages at home
- 98% English-only · German/W. Germanic 1% Spanish 1%
Political lean MEDSL · Giles
- 2024 margin
- Solid R (+55.0) · D 22.1% · R 77.1%
- 2008→2024 swing
- -35.4pp toward R · 2008: -19.6pp · 2024: -55.0pp
- All cycles
- 2024: R+55.0 2020: R+49.1 2016: R+45.4 2012: R+29.2 2008: R+19.6
Not yet ingested
- Civics
- —
Market trends
- HPI YoY
- ▲ 27.68%
- Current HPI
- 347.487
- Rent YoY
- —
- Metro
- —
- State GDP YoY
- ▲ 2.78%
- F500 in state
- 22
Industry mix (Fortune 500 HQ in TN)
| Industry | F500 HQs | Revenue |
|---|---|---|
| Healthcare | 3 | $91B |
|
||
| Retail | 3 | $72B |
|
||
| Transportation / Logistics | 1 | $88B |
|
||
| Paper / Packaging | 1 | $19B |
|
||
| Insurance | 1 | $13B |
|
||
| Energy | 1 | $12B |
|
||
Price history
1 event — show timeline
- 2026-06-10 Listed $125,000 REALTRACS as Distributed by MLS Grid
Cash-flow waterfall
monthlySold comps — $/sqft
last 12 mo · ≤1 miLoading sold comps…