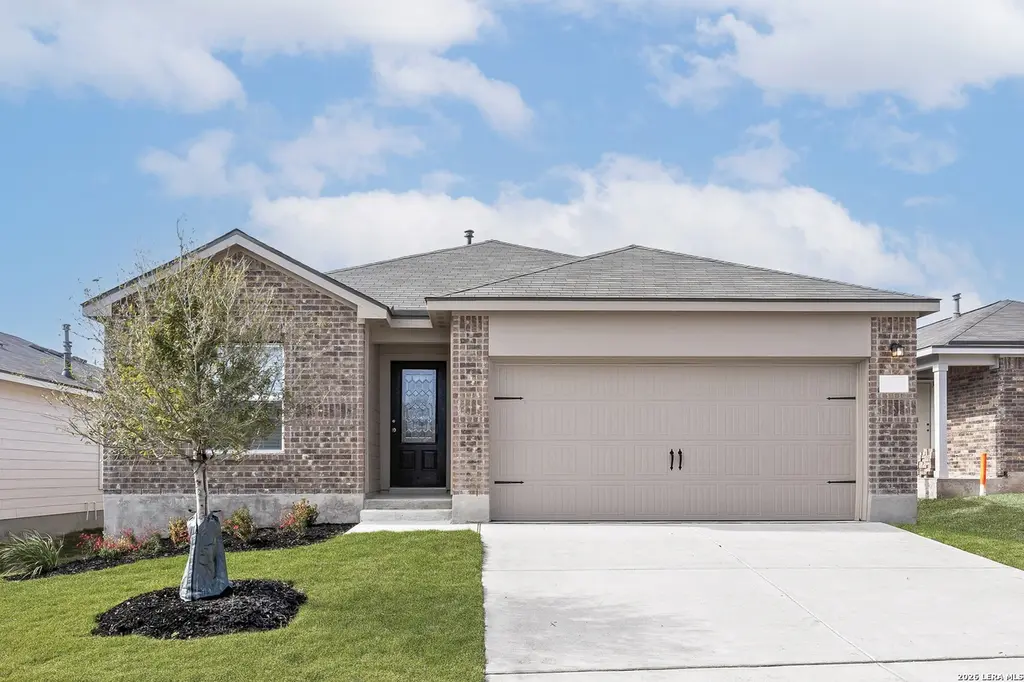
4022 Lena Gdns · San Antonio, TX
Flood risk 1/10 · Minimal
- FEMA flood zone
- X (unshaded)
- Chance of flooding over 30 yrs
- 0.0%
- Est. flood insurance / yr
- $507 – $1,088
Fire risk 3/10 · Minor
- Est. fire insurance / yr
- $1,222 – $2,270
Heat risk 8/10 · Major
- Hot days now (above 109°F)
- 7 days/yr
- Hot days in 30 yrs
- 21 days/yr
Wind risk 8/10 · Major
- Chance of severe wind over 30 yrs
- 80.0%
Air-quality risk 2/10 · Minimal
- Unhealthy air days now
- 0 days/yr
- Unhealthy air days in 30 yrs
- 1 days/yr
Risk factors via First Street. Map © Google.
Why this score? — see what drove the D- grade
The composite is a weighted blend of 9 inputs, each scored 0–100. Each bar is that input's sub-score; the figure is the points it added to the 100-point composite (weight × sub-score).
- ARV discount +11.5/15.0
- Appreciation +6.3/10.0
- Cash flow +6.1/30.0
- Livability +4.0/5.0
- Rent growth +2.5/5.0
- Condition / age +2.5/5.0
- Schools +2.2/10.0
- 1% rule +2.1/10.0
- DSCR +0.4/10.0
$249,900
🖨 Deal sheet (PDF) 📄 Offer letter ✓ Due diligence
Listing remarks
Make first impressions count with this beautiful new construction home at Preserve at Medina. This single-story, three-bedroom, two-bath home is bursting with character. The dining room located at the front of the home is the perfect space for family meals. The kitchen is open to the family room, creating the ideal entertainment area. The master suite is the perfect place to retreat to, with peaceful back yard views and an en-suite bathroom with a walk-in closet. All upgrades come included in this home such as granite countertops, energy-efficient kitchen appliances, luxury vinyl-plank flooring, a Wi-Fi-enabled garage door opener and more.
Key facts
- Master suite
- New construction
- Family room
Tags
Property features AI
Finance
- Financial info: HOA fee $432 annually
- HOA & community: Mandatory HOA; Annual HOA fee
Exterior
- Parking: Attached 2-car garage
- Utilities: CPS Energy for electricity; SAWS for water and sewer; Water system and sewer system connected
- Home design: New construction by LGI Homes; Brick, stone/rock, and siding exterior; Composition roof; Slab foundation
- Construction: Approximately 4 years old
- Exterior features: Park/playground and BBQ/grill in the community
Interior
- Kitchen: Stove/Range; Refrigerator; Dishwasher
- Bedrooms: Master bedroom with walk-in closet and full bath (12 x 14); Bedroom 2 (10 x 10); Bedroom 3 (10 x 10)
- Flooring: Carpeting; Vinyl flooring
- Bathrooms: Two full bathrooms; Master bath with tub/shower combination and single vanity (10 x 8)
- Heating & cooling: Central heating (electric); Central air conditioning
- Interior features: Separate dining room; Breakfast bar; Utility room inside; Ground level / no steps; Open floor plan; Cable TV available; High speed internet; Some window coverings remain; Washer connection; Dryer connection; Disposal; Vent fan; Smoke alarm
- Laundry & utility: Washer connection; Dryer connection; Utility room (6 x 5)
Neighborhood map
What this means for you Summary
Snapshot
- This is a 3-bed/2.0-bath single-family listed at $250k.
Deal economics
- At list price, monthly cash flow is $-470 ($-6k/yr) — negative.
- To cash-flow at today's rent, offer at most $167k (33.2% below list).
- To meet the 1% rule (rent ≥ 1% of price), the offer needs to be $178k (28.7% below list).
- Recommended offer: $167k (33.2% below list) — sets the bar for cash-flow.
Location & tenants
- Location reads 80/100 on livability (#31 in TX, #1,616 nationally) — a professional / high-income tenant draw. Strengths: amenities A+, commute A+, cost of living A+; Watch: schools C-, crime F.
- Southwest ISD (rural): math 21% / reading 31% proficiency, ranked #701 of 826 in TX (top 85%) — low school quality limits family demand, transient renter base, plan for 1-2y turnover; 75% free/reduced lunch — lower-income household profile, screen leases tightly.
- Market conditions: 323 active listings in the ZIP; 16 comparable units currently listed for rent nearby; rentals at typical pace (median 23d on market — plan ~3-4 weeks tenant-placement turnaround); 8,308 units permitted in Bexar County in 2024 (2,506 in 5+ unit buildings).
Forward outlook
- In year one you build about $8k of equity ($2k loan paydown + $6k appreciation (2.6% local appreciation)).
- Bexar County population projected at +50% by 2050 — long-run rental-demand tailwind backs the buy-and-hold thesis.
- By year 5, paydown + projected appreciation supports a ~$36k cash-out refi (75% LTV) — recoverable capital for the next deal without selling this one.
Negotiation context
- It's been on market 30 days — a 2% lower offer ($246k) is reasonable based on typical stale-listing flexibility.
- 10 sale attempts with the ask held roughly flat each time — persistent listings suggest the price (not the market) is what's stuck; bring a comps-based counter.
Risks & watch-outs
- Climate carrying-cost: severe wind risk, 80% chance of damaging wind over 30y; extreme-heat days projected 7→21/yr by 2055 (HVAC capex compounding) — expect insurance premiums to compound above CPI over the hold.
Questions for the listing agent
- What do current leases actually rent for vs. the listed asking? Can we see a recent rent roll and the last 12 months of T-12 income?
- What does the HOA fee cover, when was the last increase, and are there any pending special assessments or reserve-fund shortfalls?
- Is there a deadline driving the sale (1031 exchange, divorce, estate, relocation)? That informs how much negotiation room exists.
- Crime grade is F in this area — have there been break-ins, vandalism, or insurance claims at this property in the last 3 years? What carrier currently insures it and at what premium?
- The area grade is low — what's the realistic commute time and amenity access for the typical tenant pool here? Any planned neighborhood developments (good or bad) we should know about?
- What's the average days-on-market for RENTAL listings here right now (not sales)? A rising rental-DOM trend means longer vacancies and softer asking-rent achievability than the comps imply.
- What's the recent tenant-quality profile in this submarket — average credit score on applications, eviction rate, late-payment / NSF rate, and stable-employment percentage? A property-management company in the area should have these aggregated.
- How much new for-sale + rental construction is in the pipeline within 1–3 miles? Heavy new supply typically softens prices + rents 12–24 months out; constrained supply supports both.
Investment metrics
- 1% rule
- 0.71% ✗
- Cap rate
- 4.04%
- Cash-on-cash
- -8.05%
- DSCR
- 0.64
- GRM
- 11.7
CMA / ARV
- ARV (median comp)
- $274,061
- List price
- $249,900
- Delta
- -8.82%
- Verdict
- FAIR
- Comps
- 20 within 1.0 mi
Show comp detail 12 sales within ~0.75 mi
| Address | Dist | Beds/Ba | Sqft | Sold | Price | $/sf | Match |
|---|---|---|---|---|---|---|---|
| 15418 Lemon Pepper Crk | 0.28mi | 4/2.0 (+1) | 1,572 (+3%) | 3mo | $248,590 | $158 | 75 |
| 4231 Paprika Grv | 0.36mi | 3/2.5 | 1,470 (-4%) | 1mo | $241,170 | $164 | 74 |
| 4247 Paprika Grv | 0.39mi | 3/2.5 | 1,470 (-4%) | 1mo | $245,670 | $167 | 73 |
| 4243 Marjoram Lndg | 0.34mi | 3/2.0 | 1,434 (-6%) | 2mo | $238,610 | $166 | 73 |
| 15434 Lemon Pepper Crk | 0.30mi | 3/2.0 | 1,434 (-6%) | 5mo | $253,000 | $176 | 72 |
| 15531 Clove Spice | 0.27mi | 3/2.0 | 1,365 (-11%) | 1mo | $196,080 | $144 | 69 |
| 15435 Mint Patch Mdw | 0.45mi | 3/2.5 | 1,470 (-4%) | 3mo | $240,670 | $164 | 68 |
| 15523 Mint Patch Mdw | 0.47mi | 3/2.5 | 1,470 (-4%) | 6mo | $254,499 | $173 | 65 |
| 4307 Common Sage | 0.56mi | 3/2.5 | 1,470 (-4%) | 1mo | $245,310 | $167 | 65 |
| 15519 Mint Patch Mdw | 0.47mi | 4/2.0 (+1) | 1,572 (+3%) | 5mo | $259,000 | $165 | 64 |
| 15238 Walcott Rdg | 0.20mi | 3/2.5 | 1,301 (-15%) | 0mo | $194,450 | $149 | 64 |
| 4227 Thyme Gdn | 0.44mi | 3/2.5 | 1,700 (+11%) | 5mo | $290,544 | $171 | 54 |
Match score weights: distance 35% · size 25% · config 20% · recency 20%. Top-matched comps best support the ARV.
Projected returns pro-forma
2.6% appreciation · 3.0% rent growth · sell at horizon
- IRR
- -1.3%
- Equity multiple
- 0.93×
- Total profit
- $-4,925
- Equity at exit
- $106,795
- IRR
- 3.0%
- Equity multiple
- 1.45×
- Total profit
- $31,208
- Equity at exit
- $160,377
Cash invested: $69,972 (down + closing). Projections, not guarantees.
Landlord ↔ Tenant lean methodology
- Overall (STATE)
- 87 Strongly Landlord-Friendly
- State Texas
- 87 Strongly Landlord-Friendly · R+5
- County
- — inherits STATE
- City
- — inherits STATE
ZIP-level market 78073
- Home prices YoY
- 0.9%
- Active inventory
- 323
- Price-to-rent
- 11.7×
Monthly cashflow live
- Estimated rent
- $1,783 high interval (Pro) →
- Mortgage (P&I)
- −$1,311
- Tax from tax record
- −$427 /mo · $5,129/yr
- Insurance
- −$104
- HOA
- −$36
- Vacancy / Maint / Mgmt
- −$374
- Net cashflow
- $-470
Break-even live
Sensitivity live
| Price | -10% $-328 | -5% $-399 | +0% $-470 | +5% $-540 | +10% $-611 |
|---|---|---|---|---|---|
| Rent | -10% $-610 | -5% $-540 | +0% $-470 | +5% $-399 | +10% $-329 |
| Rate | -1.0pp $-344 | -0.5pp $-406 | base $-470 | +0.5pp $-534 | +1.0pp $-600 |
UW: 25.0% down · 7.5% · 30yr · 1.5% tax · 5.0% vac · 8.0% maint · 8.0% mgmt
Financing live
Cash to close
- Down payment
- $62,475
- Closing costs
- $7,497
- Reserves months
- —
- Total cash needed
- —
Loan-product check · same deal, 3 products live
Conventional
25% down · 7.5% · 30yr
- Down + closing
- —
- Monthly P&I
- —
- Monthly cashflow
- —
- DSCR
- —
- Eligible?
- —
Personal DTI + credit; lowest rate.
DSCR
20% down · 8.5% · 30yr
- Down + closing
- —
- Monthly P&I
- —
- Monthly cashflow
- —
- DSCR
- —
- Eligible?
- —
No personal income docs; deal must DSCR.
Hard money
10% down · 12.0% · 12mo
- Down + closing
- —
- Monthly P&I
- —
- Monthly cashflow
- —
- DSCR
- —
- Eligible?
- —
Short-term bridge; refi at stabilization.
Rent comps 16 comps
| Address | Beds | Baths | Sqft | Rent | $/sqft | DOM | Units | Dist |
|---|---|---|---|---|---|---|---|---|
| 15315 Waterow Vw Von Ormy, TX | 3.0–5.0 | 2.0–3.5 | 1781 | $1,855 | $1.04 | 3d | 1 | 0.06mi |
| 15114 Harbor Lndg Von Ormy, TX | 4.0 | 3.5 | 2198 | $2,000 | $0.91 | 23d | 1 | 0.10mi |
| 15115 Harbor Lndg Von Ormy, TX | 4.0 | 2.0 | 1794 | $1,795 | $1.00 | 16d | 1 | 0.13mi |
| 15027 Harbor Lndg Von Ormy, TX | 3.0 | 2.0 | 1526 | $1,850 | $1.21 | 25d | 1 | 0.15mi |
| 15226 Walcott Rdg Von Ormy, TX | 3.0 | 2.5 | 1297 | $1,700 | $1.31 | 25d | 1 | 0.23mi |
| 15531 Clove Spice Way Von Ormy, TX | 3.0 | 2.0 | 1296 | $1,595 | $1.23 | 5d | 1 | 0.25mi |
| 15531 Clove Spice Way Von Ormy, TX | 3.0 | 2.0 | 1296 | $1,595 | $1.23 | 21d | 1 | 0.25mi |
| 15115 Jetfire Pt Von Ormy, TX | 3.0 | 2.0 | 1526 | $1,800 | $1.18 | 45d | 1 | 0.26mi |
| 15115 Jetfire Pt Von Ormy, TX | 3.0 | 2.0 | 1525 | $1,800 | $1.18 | 19d | 1 | 0.26mi |
| 15115 Jetfire Pt Von Ormy, TX | 3.0 | 2.0 | 1526 | $1,800 | $1.18 | 5d | 1 | 0.26mi |
| 15266 Snug Harbor Way Von Ormy, TX | 3.0 | 2.5 | 1525 | $1,647 | $1.08 | 3d | 1 | 0.26mi |
| 4042 Bay Leaf Loop Von Ormy, TX | 3.0 | 2.0 | 1296 | $1,600 | $1.23 | 45d | 1 | 0.27mi |
| 3819 Leighton Hbr Von Ormy, TX | 3.0 | 2.5 | 1430 | $1,700 | $1.19 | 25d | 1 | 0.31mi |
| 15619 Garam Trl Von Ormy, TX | 3.0 | 2.5 | 1856 | $1,755 | $0.95 | 45d | 1 | 0.31mi |
| 4218 Paprika Grv Von Ormy, TX | 3.0 | 2.0 | 1434 | $1,595 | $1.11 | 45d | 1 | 0.35mi |
| 4323 Caraway Bay Von Ormy, TX | 3.0–4.0 | 2.0 | 1572 | $2,129 | $1.35 | 3d | 6 | 0.48mi |
HOA detail
- Monthly dues
- $36 · $432/yr
- Likely covers
- internet
Listing history 31 events
-
2026-06-13days on market $249,900 Active 30 DOM
-
2026-06-09days on market $249,900 Active 26 DOM
-
2026-06-08days on market $249,900 Active 25 DOM
-
2026-06-07days on market $249,900 Active 24 DOM
-
2026-06-04days on market $249,900 Active 21 DOM
-
2026-06-03days on market $249,900 Active 20 DOM
-
2026-06-02days on market $249,900 Active 19 DOM
-
2026-06-01days on market $249,900 Active 18 DOM
-
2026-05-31days on market $249,900 Active 17 DOM
-
2026-05-14$249,900 New 647-char remark
-
2026-03-11historical
-
2026-02-21price $264,900
-
2026-02-07price $259,900
-
2026-01-09$276,900 New
-
2026-01-08historical
-
2025-12-01status Back on Market
-
2025-11-26status Pending
-
2025-11-24status Back on Market
-
2025-11-22price $276,900
-
2025-10-13status Pending
-
2025-10-13status Back on Market
-
2025-10-08status Pending
-
2025-10-08$273,900 New
-
2025-10-06historical
-
2025-10-03status Back on Market
-
2025-09-22status Pending
-
2025-09-15status Back on Market
-
2025-09-10status Pending
-
2025-08-05status Back on Market
-
2025-07-07status Pending
-
2025-07-02$276,900 New
ⓘ Source: listings_history table (triggers on properties + properties_extension) + one-shot
backfill from property_details.listing_events for pre-trigger history.
Tax reassessment forecast TX · Resets to sale price
- Current annual tax
- $5,129 · $427/mo
- Projected year-2 tax
- $5,129 · $427/mo
- Expected delta
- $0/yr ($0/mo · 0.0%)
ⓘ Screening estimate from a state-policy table — verify with the county assessor before closing.
Climate risk First Street
- Flood 1/10 Low FEMA zone X (unshaded) · 0% chance over 30 yrs
- Wildfire 3/10 Moderate
- Heat 8/10 Severe 7 d/yr ≥109°F today · 21 d/yr by 30 yrs out
- Wind 8/10 Severe 80% chance of damaging wind over 30 yrs
- Air quality 2/10 Low 0 unhealthy d/yr today · 1 by 30 yrs out
Nearby sold comps map
Loading sold comps map…
Walkable amenities ~0.75 mi
Loading nearby amenities…
Taxation est. · year 1
- Rental income
- $21,393
- − Mortgage interest
- −$13,998
- − Property taxes
- −$5,129
- − Insurance
- −$1,250
- − Repairs & maintenance
- −$1,711
- − Management
- −$1,711
- − HOA
- −$432
- − Depreciation
- −$7,270
- Taxable loss
- −$10,108
- Est. tax savings @ 24.0%
- +$2,426
- After-tax cash flow
- $-3,210/yr
For passive investors: Depreciation is non-cash, so a rental often shows a tax loss while cash-flowing — sheltering income. Rental losses are passive: they offset passive income freely, and up to $25,000/yr can offset ordinary (W-2) income if you actively participate and your MAGI is under $100k (phasing out to $0 by $150k); unused losses carry forward. On sale, claimed depreciation is recaptured at up to 25%, and gains may owe capital-gains tax (a 1031 exchange can defer both). Figures are a year-1 estimate at your 24.0% rate — not tax advice; consult a CPA.
Schools (NCES district)
- District
- Southwest ISD
- NCES district ID
- 4840950
- Math proficiency
- 21% ▼ -21.00%
- Reading proficiency
- 31% ▼ -5.00%
- Median HH income
- $43,362
- Composite
- 22.22/100
- National rank
- #8153
- State rank
- #701 of 826 in TX
Livability — San Antonio
- Score
- 80/100
- State rank
- #31
- US rank
- #1616
Category grades
Schools grade is shown separately in the Schools card above.
Census & demographics
- Census place
- San Antonio, TX
- City population
- 1,806,925
- Population (ZIP)
- 9,510
Population outlook (Bexar County) Hauer SSP2
- Today (2025)
- 2,336,851 people
- By 2030
- 2,560,728 · +9.6%
- By 2040
- 3,020,569 · +29.3%
- By 2050
- 3,493,522 · +49.5%
- By 2075
- 4,668,459 · +99.8%
- By 2100
- 5,533,242 · +136.8%
Race, ethnicity, and origin ACS 2023
- Neighborhood character
- Predominantly Hispanic (81%)
- Race & ethnicity
- Hispanic / Latino 81% Two or more races 33% White 16%
- Hispanic origin (detail)
- Mexican 75%
- Foreign-born
- 12% · Canada
- Languages at home
- 51% English-only · Spanish 48% German/W. Germanic 1%
Political lean MEDSL · Bexar
- 2024 margin
- Lean D (+9.8) · D 54.3% · R 44.6% · Other 1.1%
- 2008→2024 swing
- +4.2pp toward D · 2008: 5.6pp · 2024: 9.8pp
- All cycles
- 2024: D+9.8 2020: D+18.2 2016: D+13.5 2012: D+4.6 2008: D+5.6
Not yet ingested
- Civics
- —
Market trends
- HPI YoY
- ▲ 2.60%
- Current HPI
- 289.1266
- Rent YoY
- —
- Metro
- —
- State GDP YoY
- ▲ 3.95%
- F500 in state
- 110
Industry mix (Fortune 500 HQ in TX)
| Industry | F500 HQs | Revenue |
|---|---|---|
| Energy | 16 | $1,198B |
|
||
| Technology | 5 | $198B |
|
||
| Engineering / Construction | 4 | $72B |
|
||
| Energy Services | 3 | $60B |
|
||
| Utilities | 3 | $41B |
|
||
| Healthcare | 2 | $330B |
|
||
Price history
-9.8% since first listed23 events — show timeline
- 2026-06-14 Listing Removed — LERA
- 2026-05-14 Listed $249,900 LERA
- 2026-03-11 Listing Removed — LERA
- 2026-02-21 Price Changed $264,900 LERA
- 2026-02-07 Price Changed $259,900 LERA
- 2026-01-09 Listed $276,900 LERA
- 2026-01-08 Listing Removed — LERA
- 2025-12-01 Relisted — LERA
- 2025-11-26 Pending — LERA
- 2025-11-24 Relisted — LERA
- 2025-11-22 Price Changed $276,900 LERA
- 2025-10-13 Pending — LERA
- 2025-10-13 Relisted — LERA
- 2025-10-08 Pending — LERA
- 2025-10-08 Listed $273,900 LERA
- 2025-10-06 Listing Removed — LERA
- 2025-10-03 Relisted — LERA
- 2025-09-22 Pending — LERA
- 2025-09-15 Relisted — LERA
- 2025-09-10 Pending — LERA
- 2025-08-05 Relisted — LERA
- 2025-07-07 Pending — LERA
- 2025-07-02 Listed $276,900 LERA
Property tax history
+68.0%/yrLatest (2025): $5,129 · +0.0% YoY. Source: county tax records.
Cash-flow waterfall
monthlySold comps — $/sqft
last 12 mo · ≤1 miLoading sold comps…