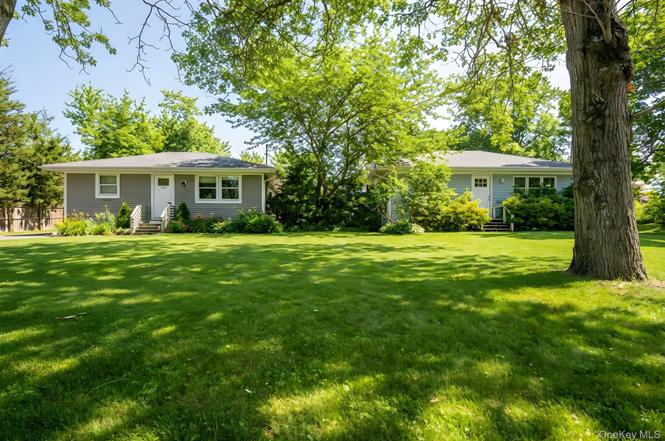
152 & 160 Church Ln · Aquebogue, NY
Flood risk 1/10 · Minimal
- FEMA flood zone
- X (unshaded)
- Chance of flooding over 30 yrs
- 0.0%
- Est. flood insurance / yr
- $473 – $860
Fire risk 3/10 · Minor
- Est. fire insurance / yr
- $691 – $1,283
Heat risk 5/10 · Moderate
- Hot days now (above 92°F)
- 7 days/yr
- Hot days in 30 yrs
- 19 days/yr
Wind risk 8/10 · Major
- Chance of severe wind over 30 yrs
- 80.0%
Air-quality risk 3/10 · Minor
- Unhealthy air days now
- 2 days/yr
- Unhealthy air days in 30 yrs
- 4 days/yr
Risk factors via First Street. Map © Google.
Why this score? — see what drove the F grade
The composite is a weighted blend of 9 inputs, each scored 0–100. Each bar is that input's sub-score; the figure is the points it added to the 100-point composite (weight × sub-score).
- ARV discount +7.5/15.0
- Schools +3.6/10.0
- Livability +3.1/5.0
- Rent growth +2.5/5.0
- Condition / age +2.5/5.0
- Cash flow +0.0/30.0
- 1% rule +0.0/10.0
- DSCR +0.0/10.0
- Appreciation +0.0/10.0
$1,399,000
🖨 Deal sheet (PDF) 📄 Offer letter ✓ Due diligence
Listing remarks
2 houses! Positive Cash Flow Two houses offered for sale- this is the positive cash flow property you've been waiting for. The lot offers . 29 acres, with two legal 1 story homes [each home: two bedroom, 1 bathroom] with current rental permits and tenants in place at this time. Church Lane is an excellent street at the beginning of the north fork, with impressive neighboring homes, convenient to both north and south forks, plus nearby booming Riverhead currently recognized as for it's economic resurgence. The houses are in working order, well maintained/move in ready, and offer full basements and laundry. Additionally, please see separate listing which offers this two house property plus an
Key facts
- Enormous lot
- Two legal homes
- Full basements
Tags
Neighborhood map
What this means for you Summary
Snapshot
- This is a 2-bed/1.0-bath single-family listed at $1.40M.
Deal economics
- At list price, monthly cash flow is $-7k ($-79k/yr) — negative.
- To cash-flow at today's rent, offer at most $237k (83.1% below list).
- To meet the 1% rule (rent ≥ 1% of price), the offer needs to be $246k (82.4% below list).
- Recommended offer: $237k (83.1% below list) — sets the bar for cash-flow.
Location & tenants
- Location reads 62/100 on livability (#887 in NY) — a middle-class / working-renter tenant base. Strengths: crime A+, employment A+, housing A+; Watch: amenities F, commute F, cost of living F.
- Riverhead Central School District (suburban): math 34% / reading 48% proficiency, ranked #489 of 590 in NY (top 83%) — families likely to look elsewhere, expect single-tenant / working-renter base with shorter leases.
- Zoned schools: Aquebogue Elementary School (math 47% / reading 57%, grade C-, #988 of 2,108 statewide, top 49%, 474 students, 40% FRL); Riverhead Middle School (math 18% / reading 35%, grade F, #594 of 729 statewide, top 81%, 827 students, 57% FRL); Riverhead Senior High School (math 80% / reading 86%, grade A, #440 of 1,100 statewide, top 40%, 2,001 students, 52% FRL).
- Zoned-school proficiency averages 54% at this address vs 41% district-wide (+13 pts) — the actual schools serving this property are materially stronger than the Riverhead Central School District average implies; a family-tenant draw the district grade alone would hide.
- Market conditions: 192 active listings in the ZIP; 1,366 units permitted in Suffolk County in 2024 (216 in 5+ unit buildings).
Forward outlook
- Local home prices are declining (-3.0%/yr); year-one equity from $10k of loan paydown is wiped out by about $42k of value loss. Plan a longer hold.
- Suffolk County population projected to shrink 5% by 2050 — rents likely to lag national; underwrite the cash flow, not the appreciation.
Negotiation context
- It's been on market 37 days — a 3% lower offer ($1.36M) is reasonable based on typical stale-listing flexibility.
- 2 sale attempts with the ask held roughly flat each time — persistent listings suggest the price (not the market) is what's stuck; bring a comps-based counter.
- Current owner paid $400k; list at $1.40M implies a 250% gain — meaningful room to come down on a strong offer.
Risks & watch-outs
- Watch-outs: built in 1939 — expect roof / HVAC / electrical / plumbing capex.
- Climate carrying-cost: severe wind risk, 80% chance of damaging wind over 30y; extreme-heat days projected 7→19/yr by 2055 (HVAC capex compounding) — expect insurance premiums to compound above CPI over the hold.
Questions for the listing agent
- What do current leases actually rent for vs. the listed asking? Can we see a recent rent roll and the last 12 months of T-12 income?
- It's been on market 37 days. Have you received any prior offers? Is the seller open to a 83% concession, seller financing, or rate buy-down credit?
- Built in 1939 — when were the roof, HVAC, electrical panel, plumbing, and water heater last replaced?
- Is there a deadline driving the sale (1031 exchange, divorce, estate, relocation)? That informs how much negotiation room exists.
- Schools are B-rated — typically a magnet for longer-tenancy family renters. What's the average tenant stay here, and is there a school-zone premium baked into asking?
- The area grade is low — what's the realistic commute time and amenity access for the typical tenant pool here? Any planned neighborhood developments (good or bad) we should know about?
- What's the average days-on-market for RENTAL listings here right now (not sales)? A rising rental-DOM trend means longer vacancies and softer asking-rent achievability than the comps imply.
- What's the recent tenant-quality profile in this submarket — average credit score on applications, eviction rate, late-payment / NSF rate, and stable-employment percentage? A property-management company in the area should have these aggregated.
- How much new for-sale + rental construction is in the pipeline within 1–3 miles? Heavy new supply typically softens prices + rents 12–24 months out; constrained supply supports both.
Investment metrics
- 1% rule
- 0.18% ✗
- Cap rate
- 0.65%
- Cash-on-cash
- -20.15%
- DSCR
- 0.10
- GRM
- 47.4
CMA / ARV
- ARV (on-the-fly)
- $660,960
- Comps found
- 1
Show comp detail 1 sale within ~0.75 mi
| Address | Dist | Beds/Ba | Sqft | Sold | Price | $/sf | Match |
|---|---|---|---|---|---|---|---|
| 60 Church Ln | 0.23mi | 1/1.0 (-1) | 631 (-12%) | 8mo | $579,000 | $918 | 56 |
Match score weights: distance 35% · size 25% · config 20% · recency 20%. Top-matched comps best support the ARV.
Projected returns pro-forma
-3.0% appreciation · 3.0% rent growth · sell at horizon
- IRR
- -58.3%
- Equity multiple
- -0.65×
- Total profit
- $-646,377
- Equity at exit
- $208,595
- IRR
- —
- Equity multiple
- -1.82×
- Total profit
- $-1,105,110
- Equity at exit
- $120,960
Cash invested: $391,720 (down + closing). Projections, not guarantees.
Landlord ↔ Tenant lean methodology
- Overall (STATE)
- 15 Strongly Tenant-Friendly
- State New York
- 15 Strongly Tenant-Friendly · D+10
- County
- — inherits STATE
- City
- — inherits STATE
ZIP-level market 11901
- Home prices YoY
- -29.5%
- Active inventory
- 192
- Price-to-rent
- 47.4×
Monthly cashflow live
- Estimated rent
- $2,459 medium interval (Pro) →
- Mortgage (P&I)
- −$7,337
- Tax from tax record
- −$602 /mo · $7,222/yr
- Insurance
- −$583
- HOA
- −$0
- Vacancy / Maint / Mgmt
- −$516
- Net cashflow
- $-6,579
Break-even live
Sensitivity live
| Price | -10% $-5,787 | -5% $-6,183 | +0% $-6,579 | +5% $-6,975 | +10% $-7,371 |
|---|---|---|---|---|---|
| Rent | -10% $-6,773 | -5% $-6,676 | +0% $-6,579 | +5% $-6,482 | +10% $-6,385 |
| Rate | -1.0pp $-5,874 | -0.5pp $-6,223 | base $-6,579 | +0.5pp $-6,941 | +1.0pp $-7,310 |
UW: 25.0% down · 7.5% · 30yr · 1.5% tax · 5.0% vac · 8.0% maint · 8.0% mgmt
Financing live
Cash to close
- Down payment
- $349,750
- Closing costs
- $41,970
- Reserves months
- —
- Total cash needed
- —
Loan-product check · same deal, 3 products live
Conventional
25% down · 7.5% · 30yr
- Down + closing
- —
- Monthly P&I
- —
- Monthly cashflow
- —
- DSCR
- —
- Eligible?
- —
Personal DTI + credit; lowest rate.
DSCR
20% down · 8.5% · 30yr
- Down + closing
- —
- Monthly P&I
- —
- Monthly cashflow
- —
- DSCR
- —
- Eligible?
- —
No personal income docs; deal must DSCR.
Hard money
10% down · 12.0% · 12mo
- Down + closing
- —
- Monthly P&I
- —
- Monthly cashflow
- —
- DSCR
- —
- Eligible?
- —
Short-term bridge; refi at stabilization.
Listing history 6 events
-
2026-04-04status Pending
-
2026-02-26$1,399,000 Active
-
2026-01-07historical
-
2025-10-30price $1,250,000
-
2025-10-30$699,000 Active
-
2022-02-23soldstatus $400,000
ⓘ Source: listings_history table (triggers on properties + properties_extension) + one-shot
backfill from property_details.listing_events for pre-trigger history.
Tax reassessment forecast NY · Partial reset (capped growth)
- Current annual tax
- $7,222 · $602/mo
- Projected year-2 tax
- $15,433 · $1,286/mo
- Expected delta
- +$8,211/yr (+$684/mo · 113.7%)
ⓘ Screening estimate from a state-policy table — verify with the county assessor before closing.
Climate risk First Street
- Flood 1/10 Low FEMA zone X (unshaded) · 0% chance over 30 yrs
- Wildfire 3/10 Moderate
- Heat 5/10 Major 7 d/yr ≥92°F today · 19 d/yr by 30 yrs out
- Wind 8/10 Severe 80% chance of damaging wind over 30 yrs
- Air quality 3/10 Moderate 2 unhealthy d/yr today · 4 by 30 yrs out
Nearby sold comps map
Loading sold comps map…
Walkable amenities ~0.75 mi
Loading nearby amenities…
Taxation est. · year 1
- Rental income
- $29,505
- − Mortgage interest
- −$78,366
- − Property taxes
- −$7,222
- − Insurance
- −$6,995
- − Repairs & maintenance
- −$2,360
- − Management
- −$2,360
- − Depreciation
- −$40,698
- Taxable loss
- −$108,497
- Est. tax savings @ 24.0%
- +$26,039
- After-tax cash flow
- $-52,907/yr
For passive investors: Depreciation is non-cash, so a rental often shows a tax loss while cash-flowing — sheltering income. Rental losses are passive: they offset passive income freely, and up to $25,000/yr can offset ordinary (W-2) income if you actively participate and your MAGI is under $100k (phasing out to $0 by $150k); unused losses carry forward. On sale, claimed depreciation is recaptured at up to 25%, and gains may owe capital-gains tax (a 1031 exchange can defer both). Figures are a year-1 estimate at your 24.0% rate — not tax advice; consult a CPA.
Schools (NCES district)
- District
- Riverhead Central School District
- NCES district ID
- 3624690
- Math proficiency
- 34% ▼ -4.00%
- Reading proficiency
- 48% ▲ 13.00%
- Median HH income
- $61,607
- Composite
- 36.38/100
- National rank
- #4683
- State rank
- #489 of 590 in NY
Livability — Aquebogue
- Score
- 62/100
- State rank
- #887
- US rank
- #17213
Category grades
Schools grade is shown separately in the Schools card above.
Census & demographics
- Census place
- Aquebogue, NY
- City population
- 24
- Population (ZIP)
- 32,921
Population outlook (Suffolk County) Hauer SSP2
- Today (2025)
- 1,505,262 people
- By 2030
- 1,498,318 · -0.5%
- By 2040
- 1,471,101 · -2.3%
- By 2050
- 1,424,848 · -5.3%
- By 2075
- 1,337,157 · -11.2%
- By 2100
- 1,217,720 · -19.1%
Race, ethnicity, and origin ACS 2023
- Neighborhood character
- Diverse neighborhood (Simpson 0.63)
- Race & ethnicity
- White 52% Hispanic / Latino 29% Two or more races 14% Black 11% Asian 3%
- Hispanic origin (detail)
- Mexican 4%
- Common ancestry
- Romanian 8% Iranian 1% Portuguese 1%
- Foreign-born
- 25% · Canada, Jamaica
- Languages at home
- 68% English-only · Spanish 26% Other Indo-European 3% Russian/Polish/Slavic 2%
Political lean MEDSL · Suffolk
- 2024 margin
- Lean R (+10.0) · D 45.0% · R 55.0%
- 2008→2024 swing
- -16.0pp toward R · 2008: 6.0pp · 2024: -10.0pp
- All cycles
- 2024: R+10.0 2020: R+0.0 2016: R+8.2 2012: D+2.9 2008: D+6.0
Not yet ingested
- Civics
- —
Market trends
- HPI YoY
- ▼ -182.60%
- Current HPI
- 436.7781
- Rent YoY
- —
- Metro
- —
- State GDP YoY
- ▲ 2.60%
- F500 in state
- 92
Industry mix (Fortune 500 HQ in NY)
| Industry | F500 HQs | Revenue |
|---|---|---|
| Financial Services | 10 | $950B |
|
||
| Consumer Goods | 9 | $162B |
|
||
| Insurance | 4 | $225B |
|
||
| Telecommunications | 2 | $144B |
|
||
| Pharmaceuticals | 2 | $112B |
|
||
| Media / Entertainment | 2 | $69B |
|
||
Price history
+249.8% since first listed6 events — show timeline
- 2026-04-04 Pending — OneKey® MLS as Distributed by MLS Grid
- 2026-02-26 Listed $1,399,000 OneKey® MLS as Distributed by MLS Grid
- 2026-01-07 Listing Removed — OneKey® MLS as Distributed by MLS Grid
- 2025-10-30 Price Changed $1,250,000 OneKey® MLS as Distributed by MLS Grid
- 2025-10-30 Listed $699,000 OneKey® MLS as Distributed by MLS Grid
- 2022-02-23 Sold (Public Records) $400,000 Public Records
Property tax history
+1.9%/yrLatest (2025): $7,222 · +0.0% YoY. Source: county tax records.
Cash-flow waterfall
monthlySold comps — $/sqft
last 12 mo · ≤1 miLoading sold comps…