 🏢 Co-op
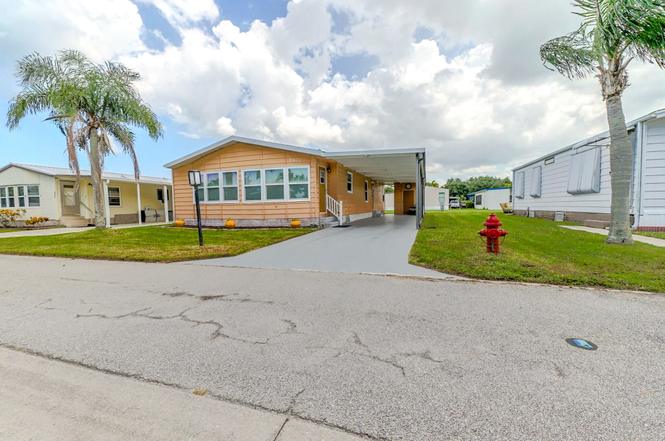
8611 Mary Ann Ln · River Park, FL
Flood risk 4/10 · Minor
- FEMA flood zone
- X (unshaded)
- Chance of flooding over 30 yrs
- 0.22%
- Est. flood insurance / yr
- $507 – $1,088
Fire risk 3/10 · Minor
- Est. fire insurance / yr
- $947 – $1,759
Heat risk 10/10 · Severe
- Hot days now (above 106°F)
- 7 days/yr
- Hot days in 30 yrs
- 22 days/yr
Wind risk 10/10 · Severe
- Chance of severe wind over 30 yrs
- 99.0%
Air-quality risk 2/10 · Minimal
- Unhealthy air days now
- 1 days/yr
- Unhealthy air days in 30 yrs
- 1 days/yr
Risk factors via First Street. Map © Google.
Why this score? — see what drove the B+ grade
The composite is a weighted blend of 9 inputs, each scored 0–100. Each bar is that input's sub-score; the figure is the points it added to the 100-point composite (weight × sub-score).
- Cash flow +30.0/30.0
- ARV discount +13.1/15.0
- 1% rule +10.0/10.0
- DSCR +10.0/10.0
- Schools +3.7/10.0
- Livability +3.5/5.0
- Rent growth +3.0/5.0
- Condition / age +2.5/5.0
- Appreciation +0.0/10.0
$125,000
🖨 Deal sheet (PDF) 📄 Offer letter ✓ Due diligence
Listing remarks
Move in Ready. .. This 1399 Sq ft home, has been well maintained and features: 3 Spacious bedrooms, 2 full baths, Stainless Steel appliances, Solid wood cabinets, Wood flooring, Washer/Dryer/Utility room, Hurricane rated windows, Carport parking for a couple of cars and Extra Storage. La Buona Vita is a Beautiful 55+ COOP Community, where each owner, owns a share in the community (No Land Lease Fees) Amenities include; A Swimming Pool, Shuffleboard, Clubhouse and Activities as well as RV/Boat storage. The low $197.00 month, HOA fee includes basic cable, Internet and trash removal. Conveniently located just off US 1, near Restaurants, Shopping, Medical Facilities and the Civic Center and ju
Key facts
- Wood flooring
- Solid wood cabinets
- Extra storage
Tags
Property features AI
Finance
- HOA & community: Community with clubhouse, pool, storage, community room, and street lights; Monthly association fee of $216; Senior community; Pets not allowed
Exterior
- Security: Smoke detector(s)
- Utilities: Public water; Public sewer; Cable available; Water available; Sewer available
- Home design: Manufactured home; Single-story; Faces north; Resale condition
- Construction: Modular construction
- Exterior features: Not waterfront
Interior
- Kitchen: Dishwasher; Electric range; Refrigerator
- Bedrooms: 3 bedrooms on the main level
- Flooring: Carpet; Laminate
- Bathrooms: 2 full bathrooms (both on the main level)
- Heating & cooling: Central electric heating; Central air conditioning; Ceiling fan(s)
- Interior features: Wet bar; Walk-in closet(s); Partially furnished
- Laundry & utility: Laundry inside in a laundry closet; Electric water heater
Neighborhood map
What this means for you Summary
Snapshot
- This is a 3-bed/2.0-bath manufactured listed at $125k.
Deal economics
- At list price, monthly cash flow is $584 ($7k/yr) — positive.
- The deal already cash-flows at list — no discount required.
- Meets the 1% rule at list price ($2k rent vs $125k).
- Recommended offer: $110k (12.0% below list) — sets the bar for market timing.
- Cap rate 11.9% vs local median 6.4% in River Park — top-decile yield for the area; either an underpriced asset or a hidden risk that comps aren't pricing in. Stress-test before assuming the spread holds.
Location & tenants
- Location reads 69/100 on livability (#451 in FL) — a middle-class / working-renter tenant base. Strengths: cost of living A+, housing A+, commute A-; Watch: amenities F, employment F, health & safety D-.
- St. Lucie (urban): math 40% / reading 48% proficiency, ranked #51 of 73 in FL (top 70%) — families likely to look elsewhere, expect single-tenant / working-renter base with shorter leases.
- Zoned schools: Savanna Ridge Elementary School (math 40% / reading 45%, grade F, #1,383 of 2,144 statewide, top 65%, 452 students, 75% FRL); Southern Oaks Middle School (math 39% / reading 43%, grade F, #353 of 571 statewide, top 63%, 894 students, 76% FRL); Port St. Lucie High School (math 21% / reading 43%, grade F, #415 of 667 statewide, top 63%, 1,748 students, 67% FRL).
- Market conditions: Rents rising (+1.9%/yr); 645 active listings in the ZIP; 14 comparable units currently listed for rent nearby; rentals at typical pace (median 26d on market — plan ~3-4 weeks tenant-placement turnaround); 4,868 units permitted in St. Lucie County in 2024 (268 in 5+ unit buildings).
- This rent runs 41% of the median local income ($62k/yr) — at the standard rent-burdened threshold; future hikes will face affordability resistance.
Forward outlook
- Local home prices are declining (-3.0%/yr); year-one equity from $864 of loan paydown is wiped out by about $4k of value loss. Plan a longer hold.
- St. Lucie County population projected at +20% by 2050 — long-run rental-demand tailwind backs the buy-and-hold thesis.
- At projected returns (-3.0% appreciation + 1.9% rent growth), your $35k cash investment doubles in ~7 years — after that, you're playing with house money.
Negotiation context
- It's been on market 152 days — a 12% lower offer ($110k) is reasonable based on typical stale-listing flexibility.
- 3 sale attempts since 19y ago; this cycle's ask has dropped $41k (25%) from the opening price — seller is motivated, your offer sets the floor, not the list.
- Current owner paid $30k; list at $125k implies a 317% gain — meaningful room to come down on a strong offer.
Risks & watch-outs
- Climate carrying-cost: severe wind risk, 99% chance of damaging wind over 30y; extreme-heat days projected 7→22/yr by 2055 (HVAC capex compounding) — expect insurance premiums to compound above CPI over the hold.
Questions for the listing agent
- It's been on market 152 days. Have you received any prior offers? Is the seller open to a 12% concession, seller financing, or rate buy-down credit?
- What does the HOA fee cover, when was the last increase, and are there any pending special assessments or reserve-fund shortfalls?
- Why hasn't it sold? Are there any deal-killer items the seller is aware of (foundation, flood, title, zoning, code violations)?
- Is there a deadline driving the sale (1031 exchange, divorce, estate, relocation)? That informs how much negotiation room exists.
- Schools are F-rated, which usually means shorter tenancies and higher turnover. Who's the typical renter profile here, and what's been the actual vacancy rate?
- What's the average days-on-market for RENTAL listings here right now (not sales)? A rising rental-DOM trend means longer vacancies and softer asking-rent achievability than the comps imply.
- What's the recent tenant-quality profile in this submarket — average credit score on applications, eviction rate, late-payment / NSF rate, and stable-employment percentage? A property-management company in the area should have these aggregated.
- How much new for-sale + rental construction is in the pipeline within 1–3 miles? Heavy new supply typically softens prices + rents 12–24 months out; constrained supply supports both.
Investment metrics
- 1% rule
- 1.69% ✓
- Cap rate
- 11.90%
- Cash-on-cash
- 20.03%
- DSCR
- 1.89
- GRM
- 4.9
CMA / ARV
- ARV (on-the-fly)
- $142,698
- Comps found
- 8
Show comp detail 8 sales within ~0.75 mi
| Address | Dist | Beds/Ba | Sqft | Sold | Price | $/sf | Match |
|---|---|---|---|---|---|---|---|
| 8591 Mary Ann Ln | 0.02mi | 2/2.0 (-1) | 1,354 (-3%) | 7mo | $75,000 | $55 | 83 |
| 8580 Mary Ann Ln | 0.04mi | 2/2.0 (-1) | 1,471 (+5%) | 5mo | $175,000 | $119 | 80 |
| 8636 Florence Dr | 0.04mi | 2/2.0 (-1) | 1,266 (-10%) | 2mo | $130,000 | $103 | 76 |
| 501 La Buona Vita Dr | 0.12mi | 2/2.0 (-1) | 1,289 (-8%) | 9mo | $132,000 | $102 | 68 |
| 8 S Alhambra Ln | 0.50mi | 3/2.0 | 1,400 (+0%) | 14mo | $100,000 | $71 | 65 |
| 560 Natalie Dr | 0.25mi | 2/2.0 (-1) | 1,248 (-11%) | 18mo | $162,800 | $130 | 50 |
| 5 Yolanda Ln | 0.73mi | 2/2.0 (-1) | 1,280 (-8%) | 5mo | $39,000 | $30 | 42 |
| 23 San Pablo Ln | 0.43mi | 2/2.0 (-1) | 1,200 (-14%) | 13mo | $37,000 | $31 | 40 |
Match score weights: distance 35% · size 25% · config 20% · recency 20%. Top-matched comps best support the ARV.
Projected returns pro-forma
-3.0% appreciation · 1.92% rent growth · sell at horizon
- IRR
- 10.9%
- Equity multiple
- 1.42×
- Total profit
- $14,848
- Equity at exit
- $18,638
- IRR
- 19.0%
- Equity multiple
- 2.50×
- Total profit
- $52,391
- Equity at exit
- $10,808
Cash invested: $35,000 (down + closing). Projections, not guarantees.
Landlord ↔ Tenant lean methodology
- Overall (STATE)
- 87 Strongly Landlord-Friendly
- State Florida
- 87 Strongly Landlord-Friendly · R+3
- County
- — inherits STATE
- City
- — inherits STATE
ZIP-level market 34952
- Home prices YoY
- -29.6%
- Rents YoY
- 1.9%
- Active inventory
- 645
- Price-to-rent
- 4.9×
Monthly cashflow live
- Estimated rent
- $2,118 high interval (Pro) →
- Mortgage (P&I)
- −$656
- Tax from tax record
- −$165 /mo · $1,986/yr
- Insurance
- −$52
- HOA
- −$216
- Vacancy / Maint / Mgmt
- −$445
- Net cashflow
- $584
Break-even live
Sensitivity live
| Price | -10% $655 | -5% $620 | +0% $584 | +5% $549 | +10% $513 |
|---|---|---|---|---|---|
| Rent | -10% $417 | -5% $501 | +0% $584 | +5% $668 | +10% $752 |
| Rate | -1.0pp $647 | -0.5pp $616 | base $584 | +0.5pp $552 | +1.0pp $519 |
UW: 25.0% down · 7.5% · 30yr · 1.5% tax · 5.0% vac · 8.0% maint · 8.0% mgmt
Financing live
Cash to close
- Down payment
- $31,250
- Closing costs
- $3,750
- Reserves months
- —
- Total cash needed
- —
Loan-product check · same deal, 3 products live
Conventional
25% down · 7.5% · 30yr
- Down + closing
- —
- Monthly P&I
- —
- Monthly cashflow
- —
- DSCR
- —
- Eligible?
- —
Personal DTI + credit; lowest rate.
DSCR
20% down · 8.5% · 30yr
- Down + closing
- —
- Monthly P&I
- —
- Monthly cashflow
- —
- DSCR
- —
- Eligible?
- —
No personal income docs; deal must DSCR.
Hard money
10% down · 12.0% · 12mo
- Down + closing
- —
- Monthly P&I
- —
- Monthly cashflow
- —
- DSCR
- —
- Eligible?
- —
Short-term bridge; refi at stabilization.
Rent comps 14 comps
| Address | Beds | Baths | Sqft | Rent | $/sqft | DOM | Units | Dist |
|---|---|---|---|---|---|---|---|---|
| 1900 Bella Vista Way Port Saint Lucie, FL | 1.0–2.0 | 1.0–2.0 | 995 | $1,764 | $1.77 | 16d | 15 | 0.61mi |
| 805 SE Cavern Ave Port Saint Lucie, FL | 3.0 | 2.0 | 1732 | $2,500 | $1.44 | 25d | 1 | 0.85mi |
| 991 SE Walters Ter Port Saint Lucie, FL | 2.0 | 2.0 | 1040 | $8,500 | $8.17 | 25d | 1 | 0.97mi |
| 730 SE White Ave Port Saint Lucie, FL | 2.0 | 2.0 | 1386 | $10,000 | $7.22 | 25d | 1 | 1.00mi |
| 1810 SE Pinewood Trl Port Saint Lucie, FL | 1.0–2.0 | 1.0–2.0 | 1013 | $2,055 | $2.03 | 16d | 7 | 1.03mi |
| 650 SE Evergreen Ter Port Saint Lucie, FL | 2.0 | 2.0 | 974 | $2,095 | $2.15 | 16d | 1 | 1.14mi |
| 1455 SE Colchester Cir Port Saint Lucie, FL | 2.0 | 2.0 | 921 | $1,795 | $1.95 | 16d | 1 | 1.16mi |
| 71 W Caribbean Port St. Lucie, FL | 2.0 | 2.0 | 1417 | $1,700 | $1.20 | 25d | 1 | 1.24mi |
| 1811 SE Walton Lakes Dr Port Saint Lucie, FL | 2.0 | 1.0–2.0 | 1117 | $1,926 | $1.72 | 16d | 6 | 1.37mi |
| 1618 SE Elkhart Ter Port Saint Lucie, FL | 3.0 | 2.0 | 1176 | $2,200 | $1.87 | 25d | 1 | 1.39mi |
| 1350 SE La Haven Ct Port Saint Lucie, FL | 2.0 | 2.0 | 1041 | $2,100 | $2.02 | 25d | 1 | 1.42mi |
| 1516 SE Royal Green Cir #202 Port St Lucie, FL | 3.0 | 2.0 | 921 | $2,100 | $2.28 | 25d | 1 | 1.42mi |
| 1520 SE Royal Green Cir Unit K-203 Port St. Lucie, FL | 2.0 | 2.0 | 886 | $1,800 | $2.03 | 25d | 1 | 1.47mi |
| 1456 SE Rivergreen Cir Port Saint Lucie, FL | 2.0 | 2.0 | 921 | $1,825 | $1.98 | 16d | 1 | 1.47mi |
HOA detail
- Monthly dues
- $216 · $2,592/yr
- Likely covers
- trashinternetcablepool
Listing history 28 events
-
2026-06-21days on market $125,000 Active 152 DOM
-
2026-06-18days on market $125,000 Active 149 DOM
-
2026-06-17days on market $125,000 Active 148 DOM
-
2026-06-16days on market $125,000 Active 147 DOM
-
2026-06-15days on market $125,000 Active 146 DOM
-
2026-06-14days on market $125,000 Active 144 DOM
-
2026-06-13days on market $125,000 Active 143 DOM
-
2026-06-10days on market $125,000 Active 141 DOM
-
2026-06-09days on market $125,000 Active 140 DOM
-
2026-06-08days on market $125,000 Active 139 DOM
-
2026-06-07days on market $125,000 Active 138 DOM
-
2026-06-05days on market $125,000 Active 135 DOM
-
2026-06-03days on market $125,000 Active 134 DOM
-
2026-06-02days on market $125,000 Active 133 DOM
-
2026-06-01pricedays on market $125,000 Active 132 DOM
-
2026-05-31days on market $130,000 Active 299 DOM
-
2026-05-30days on market $130,000 Active 298 DOM
-
2026-04-10price $130,000
-
2026-03-01price $139,500
-
2025-12-19price $145,000
-
2025-12-16status Active
-
2025-12-09status Pending
-
2025-09-25price $159,900
-
2025-07-30$165,900 Active
-
2014-10-12historical
-
2007-08-17soldstatus $30,000
-
2007-03-08$44,500
-
2001-06-01soldstatus $4,450,000
ⓘ Source: listings_history table (triggers on properties + properties_extension) + one-shot
backfill from property_details.listing_events for pre-trigger history.
Tax reassessment forecast FL · Resets to sale price
- Current annual tax
- $1,986 · $165/mo
- Projected year-2 tax
- $1,986 · $165/mo
- Expected delta
- $0/yr ($0/mo · 0.0%)
ⓘ Screening estimate from a state-policy table — verify with the county assessor before closing.
Climate risk First Street
- Flood 4/10 Moderate FEMA zone X (unshaded) · 22% chance over 30 yrs
- Wildfire 3/10 Moderate
- Heat 10/10 Extreme 7 d/yr ≥106°F today · 22 d/yr by 30 yrs out
- Wind 10/10 Extreme 99% chance of damaging wind over 30 yrs
- Air quality 2/10 Low 1 unhealthy d/yr today · 1 by 30 yrs out
Nearby sold comps map
Loading sold comps map…
Walkable amenities ~0.75 mi
Loading nearby amenities…
Taxation est. · year 1
- Rental income
- $25,417
- − Mortgage interest
- −$7,002
- − Property taxes
- −$1,986
- − Insurance
- −$625
- − Repairs & maintenance
- −$2,033
- − Management
- −$2,033
- − HOA
- −$2,592
- − Depreciation
- −$3,636
- Taxable income
- $5,509
- Est. tax owed @ 24.0%
- −$1,322
- After-tax cash flow
- $5,688/yr
For passive investors: Depreciation is non-cash, so a rental often shows a tax loss while cash-flowing — sheltering income. Rental losses are passive: they offset passive income freely, and up to $25,000/yr can offset ordinary (W-2) income if you actively participate and your MAGI is under $100k (phasing out to $0 by $150k); unused losses carry forward. On sale, claimed depreciation is recaptured at up to 25%, and gains may owe capital-gains tax (a 1031 exchange can defer both). Figures are a year-1 estimate at your 24.0% rate — not tax advice; consult a CPA.
Schools (NCES district)
- District
- St. Lucie
- NCES district ID
- 1201770
- Math proficiency
- 40% ▼ -11.00%
- Reading proficiency
- 48% ▼ -4.00%
- Median HH income
- $44,737
- Composite
- 37.28/100
- National rank
- #4449
- State rank
- #51 of 73 in FL
Livability — River Park
- Score
- 69/100
- State rank
- #451
- US rank
- #8159
Category grades
Schools grade is shown separately in the Schools card above.
Census & demographics
- Census place
- River Park, FL
- County
- Saint Lucie County · 337,150 people
- Metro
- Port St. Lucie, FL
- Population (ZIP)
- 42,655
- Household income
- $61,628
- Rent vs Own
- Severe rent burden
- 1759.0
Population outlook (St. Lucie County) Hauer SSP2
- Today (2025)
- 338,016 people
- By 2030
- 355,687 · +5.2%
- By 2040
- 385,521 · +14.1%
- By 2050
- 406,106 · +20.1%
- By 2075
- 441,054 · +30.5%
- By 2100
- 436,885 · +29.2%
Race, ethnicity, and origin ACS 2023
- Neighborhood character
- Diverse neighborhood (Simpson 0.57)
- Race & ethnicity
- White 62% Hispanic / Latino 19% Two or more races 14% Black 10% Asian 3%
- Hispanic origin (detail)
- Mexican 4% Puerto Rican 4% Cuban 2% Dominican 2%
- Common ancestry
- Romanian 3% Lithuanian 2% Hispanic 1%
- Foreign-born
- 18% · Canada, Jamaica, China
- Languages at home
- 76% English-only · Spanish 16% French/Haitian/Cajun 3% Tagalog/Filipino 2%
Political lean MEDSL · St. Lucie
- 2024 margin
- Lean R (+9.1) · D 45.1% · R 54.2%
- 2008→2024 swing
- -21.2pp toward R · 2008: 12.1pp · 2024: -9.1pp
- All cycles
- 2024: R+9.1 2020: R+1.6 2016: R+2.5 2012: D+7.9 2008: D+12.1
Not yet ingested
- Civics
- —
Market trends
- HPI YoY
- ▼ -155.80%
- Current HPI
- 371.0573
- Rent YoY
- ▲ 1.92%
- Metro
- Port St. Lucie, FL
- State GDP YoY
- ▲ 3.28%
- F500 in state
- 36
Industry mix (Fortune 500 HQ in FL)
| Industry | F500 HQs | Revenue |
|---|---|---|
| Industrial Technology | 2 | $29B |
|
||
| Insurance | 2 | $17B |
|
||
| Retail | 1 | $60B |
|
||
| Technology Distribution | 1 | $58B |
|
||
| Homebuilding | 1 | $35B |
|
||
| Technology Manufacturing | 1 | $35B |
|
||
Price history
-97.1% since first listed11 events — show timeline
- 2026-04-10 Price Changed $130,000 Beaches MLS
- 2026-03-01 Price Changed $139,500 Beaches MLS
- 2025-12-19 Price Changed $145,000 Beaches MLS
- 2025-12-16 Relisted — Beaches MLS
- 2025-12-09 Pending — Beaches MLS
- 2025-09-25 Price Changed $159,900 Beaches MLS
- 2025-07-30 Listed $165,900 Beaches MLS
- 2014-10-12 Listing Removed — Beaches MLS
- 2007-08-17 Sold (Public Records) $30,000 Public Records
- 2007-03-08 Listed $44,500 Beaches MLS
- 2001-06-01 Sold (Public Records) $4,450,000 Public Records
Property tax history
+20.4%/yrLatest (2025): $1,986 · +422.9% YoY. Source: county tax records.
Cash-flow waterfall
monthlySold comps — $/sqft
last 12 mo · ≤1 miLoading sold comps…