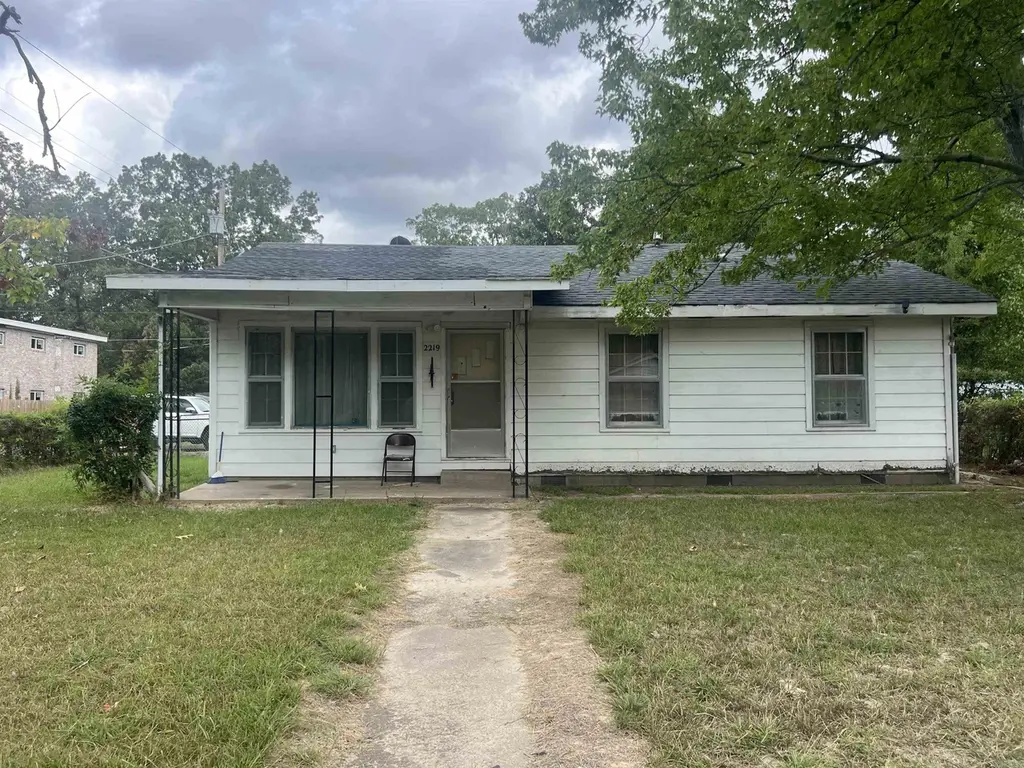
2219 W 34th · Pine Bluff, AR
Flood risk 1/10 · Minimal
- FEMA flood zone
- X (unshaded)
- Chance of flooding over 30 yrs
- 0.0%
- Est. flood insurance / yr
- $507 – $1,088
Fire risk 1/10 · Minimal
- Est. fire insurance / yr
- $1,499 – $2,785
Heat risk 6/10 · Moderate
- Hot days now (above 110°F)
- 7 days/yr
- Hot days in 30 yrs
- 19 days/yr
Wind risk 4/10 · Minor
- Chance of severe wind over 30 yrs
- 24.0%
Air-quality risk 1/10 · Minimal
- Unhealthy air days now
- 0 days/yr
- Unhealthy air days in 30 yrs
- 0 days/yr
Risk factors via First Street. Map © Google.
Why this score? — see what drove the B- grade
The composite is a weighted blend of 9 inputs, each scored 0–100. Each bar is that input's sub-score; the figure is the points it added to the 100-point composite (weight × sub-score).
- Cash flow +30.0/30.0
- 1% rule +10.0/10.0
- DSCR +10.0/10.0
- ARV discount +7.5/15.0
- Rent growth +2.5/5.0
- Livability +2.5/5.0
- Condition / age +2.5/5.0
- Schools +0.6/10.0
- Appreciation +0.0/10.0
$49,000
🖨 Deal sheet 📄 Offer letter ✓ Due diligence
Listing remarks MLS
Great investment opportunity or perfect for a first time homebuyer!. This home has three beds, two baths, large living room and dining room. Large storage building also!
Key facts
- Built 1955
- Listed 269 days
Neighborhood map
What this means for you Summary
Snapshot
- This is a 3-bed/2.0-bath single-family listed at $49k.
Deal economics
- At list price, monthly cash flow is $592 ($7k/yr) — positive.
- The deal already cash-flows at list — no discount required.
- Meets the 1% rule at list price ($1k rent vs $49k).
- Recommended offer: $43k (12.0% below list) — sets the bar for market timing.
- Cap rate 20.8% vs local median 9.0% in Pine Bluff — top-decile yield for the area; either an underpriced asset or a hidden risk that comps aren't pricing in. Stress-test before assuming the spread holds.
Location & tenants
- Location reads 50/100 on livability (#483 in AR) — a working-class tenant base; expect higher turnover. Strengths: cost of living A+, housing A; Watch: schools F, crime F, amenities F.
- Pine Bluff School District (urban): math 6% / reading 9% proficiency, ranked #236 of 238 in AR (top 99%) — low school quality limits family demand, transient renter base, plan for 1-2y turnover; 85% free/reduced lunch — lower-income household profile, screen leases tightly.
- Market conditions: 212 active listings in the ZIP; 62 units permitted in Jefferson County in 2024 (0 in 5+ unit buildings).
Forward outlook
- Local home prices are declining (-3.0%/yr); year-one equity from $339 of loan paydown is wiped out by about $1k of value loss. Plan a longer hold.
- Jefferson County population projected at -33% by 2050 — secular population decline; favor cash flow + early exit over multi-decade hold.
- At projected returns (-3.0% appreciation + 3.0% rent growth), your $14k cash investment doubles in ~3 years — after that, you're playing with house money.
Negotiation context
- It's been on market 270 days — a 12% lower offer ($43k) is reasonable based on typical stale-listing flexibility.
- 3 sale attempts since 2y ago; this cycle's ask has dropped $16k (25%) from the opening price — seller is motivated, your offer sets the floor, not the list.
- Current owner paid $20k; list at $49k implies a 151% gain — meaningful room to come down on a strong offer.
Risks & watch-outs
- Watch-outs: built in 1955 — expect roof / HVAC / electrical / plumbing capex.
- Climate carrying-cost: extreme-heat days projected 7→19/yr by 2055 (HVAC capex compounding) — expect insurance premiums to compound above CPI over the hold.
Questions for the listing agent
- It's been on market 270 days. Have you received any prior offers? Is the seller open to a 12% concession, seller financing, or rate buy-down credit?
- Built in 1955 — when were the roof, HVAC, electrical panel, plumbing, and water heater last replaced?
- Why hasn't it sold? Are there any deal-killer items the seller is aware of (foundation, flood, title, zoning, code violations)?
- Is there a deadline driving the sale (1031 exchange, divorce, estate, relocation)? That informs how much negotiation room exists.
- Schools are F-rated, which usually means shorter tenancies and higher turnover. Who's the typical renter profile here, and what's been the actual vacancy rate?
- Crime grade is F in this area — have there been break-ins, vandalism, or insurance claims at this property in the last 3 years? What carrier currently insures it and at what premium?
- What's the average days-on-market for RENTAL listings here right now (not sales)? A rising rental-DOM trend means longer vacancies and softer asking-rent achievability than the comps imply.
- What's the recent tenant-quality profile in this submarket — average credit score on applications, eviction rate, late-payment / NSF rate, and stable-employment percentage? A property-management company in the area should have these aggregated.
- How much new for-sale + rental construction is in the pipeline within 1–3 miles? Heavy new supply typically softens prices + rents 12–24 months out; constrained supply supports both.
Investment metrics
- 1% rule
- 2.45% ✓
- Cap rate
- 20.79%
- Cash-on-cash
- 51.76%
- DSCR
- 3.30
- GRM
- 3.4
CMA / ARV
- ARV (median comp)
- $132,060
- List price
- $49,000
- Delta
- -62.90%
- Verdict
- UNDERPRICED
- Comps
- 20 within 1.0 mi
Show comp detail 12 sales within ~0.75 mi
| Address | Dist | Beds/Ba | Sqft | Sold | Price | $/sf | Match |
|---|---|---|---|---|---|---|---|
| 2206 W 36 | 0.17mi | 3/2.0 | 1,870 (+3%) | 1mo | $170,000 | $91 | 86 |
| 2302 W 35th | 0.16mi | 3/1.5 | 1,780 (-2%) | 6mo | $90,000 | $51 | 82 |
| 1604 W 31st | 0.40mi | 3/2.0 | 1,728 (-5%) | 4mo | $60,000 | $35 | 70 |
| 2202 W 39th | 0.35mi | 3/2.5 | 1,787 (-2%) | 12mo | $68,000 | $38 | 68 |
| 2208 W 39th | 0.37mi | 2/2.0 (-1) | 1,753 (-4%) | 8mo | $110,000 | $63 | 65 |
| 2205 W 34th Ave | 0.02mi | 4/2.0 (+1) | 2,088 (+15%) | 11mo | $155,000 | $74 | 60 |
| 1403 Arrowhead | 0.55mi | 3/2.0 | 1,853 (+2%) | 14mo | $174,500 | $94 | 59 |
| 2302 W 40th Ave | 0.49mi | 3/2.0 | 1,701 (-6%) | 10mo | $149,900 | $88 | 58 |
| 1504 W 34th Ave | 0.43mi | 3/2.0 | 1,611 (-11%) | 9mo | $65,000 | $40 | 54 |
| 9 La Salle Cv | 0.62mi | 3/2.0 | 1,653 (-9%) | 8mo | $28,000 | $17 | 49 |
| 3100 S Mulberry St | 0.59mi | 3/2.0 | 2,080 (+14%) | 6mo | $75,000 | $36 | 44 |
| 3516 S Cherry St | 0.68mi | 3/2.0 | 2,064 (+14%) | 12mo | $50,000 | $24 | 35 |
Match score weights: distance 35% · size 25% · config 20% · recency 20%. Top-matched comps best support the ARV.
Projected returns pro-forma
-3.0% appreciation · 3.0% rent growth · sell at horizon
- IRR
- 49.7%
- Equity multiple
- 3.17×
- Total profit
- $29,781
- Equity at exit
- $7,306
- IRR
- 55.2%
- Equity multiple
- 6.44×
- Total profit
- $74,586
- Equity at exit
- $4,237
Cash invested: $13,720 (down + closing). Projections, not guarantees.
Landlord ↔ Tenant lean methodology
- Overall (STATE)
- 92 Strongly Landlord-Friendly
- State Arkansas
- 92 Strongly Landlord-Friendly · R+14
- County
- — inherits STATE
- City
- — inherits STATE
ZIP-level market 71603
- Home prices YoY
- -26.0%
- Active inventory
- 212
- Price-to-rent
- 3.4×
Monthly cashflow live
- Estimated rent
- $1,200 medium interval (Pro) →
- Mortgage (P&I)
- −$257
- Tax from tax record
- −$79 /mo · $943/yr
- Insurance
- −$20
- HOA
- −$0
- Vacancy / Maint / Mgmt
- −$252
- Net cashflow
- $592
Break-even live
UW: 25.0% down · 7.5% · 30yr · 1.5% tax · 5.0% vac · 8.0% maint · 8.0% mgmt
Financing live
Cash to close
- Down payment
- $12,250
- Closing costs
- $1,470
- Reserves months
- —
- Total cash needed
- —
Loan-product check · same deal, 3 products live
Conventional
25% down · 7.5% · 30yr
- Down + closing
- —
- Monthly P&I
- —
- Monthly cashflow
- —
- DSCR
- —
- Eligible?
- —
Personal DTI + credit; lowest rate.
DSCR
20% down · 8.5% · 30yr
- Down + closing
- —
- Monthly P&I
- —
- Monthly cashflow
- —
- DSCR
- —
- Eligible?
- —
No personal income docs; deal must DSCR.
Hard money
10% down · 12.0% · 12mo
- Down + closing
- —
- Monthly P&I
- —
- Monthly cashflow
- —
- DSCR
- —
- Eligible?
- —
Short-term bridge; refi at stabilization.
Listing history 25 events
-
2026-06-19days on market $49,000 Active 270 DOM
-
2026-06-18days on market $49,000 Active 269 DOM
-
2026-06-17days on market $49,000 Active 268 DOM
-
2026-06-16days on market $49,000 Active 267 DOM
-
2026-06-15days on market $49,000 Active 266 DOM
-
2026-06-14days on market $49,000 Active 264 DOM
-
2026-06-12days on market $49,000 Active 263 DOM
-
2026-06-09days on market $49,000 Active 260 DOM
-
2026-06-08days on market $49,000 Active 259 DOM
-
2026-06-07days on market $49,000 Active 258 DOM
-
2026-06-05days on market $49,000 Active 255 DOM
-
2026-06-03days on market $49,000 Active 254 DOM
-
2026-06-02days on market $49,000 Active 253 DOM
-
2026-06-01days on market $49,000 Active 252 DOM
-
2026-05-31days on market $49,000 Active 251 DOM
-
2026-05-30days on market $49,000 Active 250 DOM
-
2026-05-12price $49,000 169-char remark
Show marketing remark (169 chars)
Great investment opportunity or perfect for a first time homebuyer!. This home has three beds, two baths, large living room and dining room. Large storage building also!
-
2026-02-21price $55,000 169-char remark
Show marketing remark (169 chars)
Great investment opportunity or perfect for a first time homebuyer!. This home has three beds, two baths, large living room and dining room. Large storage building also!
-
2025-09-22$65,000 New Listing 169-char remark
Show marketing remark (169 chars)
Great investment opportunity or perfect for a first time homebuyer!. This home has three beds, two baths, large living room and dining room. Large storage building also!
-
2024-11-19soldstatus $19,500 Sold 28-char remark
Show marketing remark (28 chars)
Property is being sold as is
-
2024-11-19soldstatus $20,000
Show marketing remark (28 chars)
Property is being sold as is
-
2024-11-01status Under Contract 28-char remark
Show marketing remark (28 chars)
Property is being sold as is
-
2024-10-22status Back on Market 28-char remark
Show marketing remark (28 chars)
Property is being sold as is
-
2024-03-18historical 28-char remark
Show marketing remark (28 chars)
Property is being sold as is
-
2024-03-17$25,000 New Listing 28-char remark
Show marketing remark (28 chars)
Property is being sold as is
ⓘ Source: listings_history table (triggers on properties + properties_extension) + one-shot
backfill from property_details.listing_events for pre-trigger history.
Tax reassessment forecast AR · Resets to sale price
- Current annual tax
- $943 · $79/mo
- Projected year-2 tax
- $943 · $79/mo
- Expected delta
- $0/yr ($0/mo · 0.0%)
ⓘ Screening estimate from a state-policy table — verify with the county assessor before closing.
Climate risk First Street
- Flood 1/10 Low FEMA zone X (unshaded) · 0% chance over 30 yrs
- Wildfire 1/10 Low
- Heat 6/10 Major 7 d/yr ≥110°F today · 19 d/yr by 30 yrs out
- Wind 4/10 Moderate 24% chance of damaging wind over 30 yrs
- Air quality 1/10 Low 0 unhealthy d/yr today · 0 by 30 yrs out
Nearby sold comps map
Loading sold comps map…
Walkable amenities ~0.75 mi
Loading nearby amenities…
Taxation est. · year 1
- Rental income
- $14,396
- − Mortgage interest
- −$2,745
- − Property taxes
- −$943
- − Insurance
- −$245
- − Repairs & maintenance
- −$1,152
- − Management
- −$1,152
- − Depreciation
- −$1,425
- Taxable income
- $6,735
- Est. tax owed @ 24.0%
- −$1,616
- After-tax cash flow
- $5,485/yr
For passive investors: Depreciation is non-cash, so a rental often shows a tax loss while cash-flowing — sheltering income. Rental losses are passive: they offset passive income freely, and up to $25,000/yr can offset ordinary (W-2) income if you actively participate and your MAGI is under $100k (phasing out to $0 by $150k); unused losses carry forward. On sale, claimed depreciation is recaptured at up to 25%, and gains may owe capital-gains tax (a 1031 exchange can defer both). Figures are a year-1 estimate at your 24.0% rate — not tax advice; consult a CPA.
Schools (NCES district)
- District
- Pine Bluff School District
- NCES district ID
- 0500026
- Math proficiency
- 6% ▼ -9.00%
- Reading proficiency
- 9% ▼ -7.00%
- Median HH income
- $32,374
- Composite
- 5.86/100
- National rank
- #10014
- State rank
- #236 of 238 in AR
Livability — Pine Bluff
- Score
- 50/100
- State rank
- #483
- US rank
- #25645
Category grades
Schools grade is shown separately in the Schools card above.
Census & demographics
- Census place
- Pine Bluff, AR
- County
- Jefferson County · 29,578 people
- City population
- 29,578
- Metro
- Pine Bluff, AR
- Population (ZIP)
- 29,578
- Household income
- $53,130
- Rent vs Own
- Severe rent burden
- 657.0
Population outlook (Jefferson County) Hauer SSP2
- Today (2025)
- 63,110 people
- By 2030
- 58,519 · -7.3%
- By 2040
- 49,740 · -21.2%
- By 2050
- 42,331 · -32.9%
- By 2075
- 29,591 · -53.1%
- By 2100
- 21,047 · -66.7%
Race, ethnicity, and origin ACS 2023
- Neighborhood character
- Majority Black (62%)
- Race & ethnicity
- Black 62% White 33% Two or more races 2% Hispanic / Latino 2%
- Common ancestry
- Italian 2% Slovak 1%
- Foreign-born
- 2% · Canada
- Languages at home
- 98% English-only · Spanish 1%
Political lean MEDSL · Jefferson
- 2024 margin
- Strong D (+20.1) · D 59.2% · R 39.2% · Other 1.6%
- 2008→2024 swing
- -6.2pp toward R · 2008: 26.3pp · 2024: 20.1pp
- All cycles
- 2024: D+20.1 2020: D+21.7 2016: D+25.3 2012: D+29.0 2008: D+26.3
Not yet ingested
- Civics
- —
Market trends
- HPI YoY
- ▼ -72.43%
- Current HPI
- 206.5994
- Rent YoY
- —
- Metro
- Pine Bluff, AR
- State GDP YoY
- ▲ 3.80%
- F500 in state
- 10
Industry mix (Fortune 500 HQ in AR)
| Industry | F500 HQs | Revenue |
|---|---|---|
| Retail | 1 | $681B |
|
||
| Food / Agriculture | 1 | $53B |
|
||
| Retail / Energy | 1 | $22B |
|
||
| Transportation / Logistics | 1 | $12B |
|
||
| Energy | 1 | $4B |
|
||
Price history
+96.0% since first listed9 events — show timeline
- 2026-05-12 Price Changed $49,000 CARMLS
- 2026-02-21 Price Changed $55,000 CARMLS
- 2025-09-22 Listed $65,000 CARMLS
- 2024-11-19 Sold (Public Records) $20,000 Public Records
- 2024-11-19 Sold (MLS) $19,500 CARMLS
- 2024-11-01 Pending — CARMLS
- 2024-10-22 Relisted — CARMLS
- 2024-03-18 Listing Removed — CARMLS
- 2024-03-17 Listed $25,000 CARMLS
Property tax history
+22.8%/yrLatest (2025): $943 · +1812.5% YoY. Source: county tax records.
Cash-flow waterfall
monthlySold comps — $/sqft
last 12 mo · ≤1 miLoading sold comps…