285 Main St #312 · San Francisco, CA
Flood risk 1/10 · Minimal
- FEMA flood zone
- X (unshaded)
- Chance of flooding over 30 yrs
- 0.0%
- Est. flood insurance / yr
- $507 – $1,088
Fire risk 1/10 · Minimal
- Est. fire insurance / yr
- $659 – $1,223
Heat risk 2/10 · Minimal
- Hot days now (above 79°F)
- 7 days/yr
- Hot days in 30 yrs
- 15 days/yr
Wind risk 1/10 · Minimal
- Chance of severe wind over 30 yrs
- —
Air-quality risk 8/10 · Major
- Unhealthy air days now
- 15 days/yr
- Unhealthy air days in 30 yrs
- 15 days/yr
Risk factors via First Street. Map © Google.
Why this score? — see what drove the B+ grade
The composite is a weighted blend of 9 inputs, each scored 0–100. Each bar is that input's sub-score; the figure is the points it added to the 100-point composite (weight × sub-score).
- Cash flow +25.0/30.0
- 1% rule +9.5/10.0
- DSCR +8.2/10.0
- ARV discount +7.5/15.0
- Appreciation +7.1/10.0
- Rent growth +5.0/5.0
- Schools +5.0/10.0
- Condition / age +4.8/5.0
- Livability +3.8/5.0
$385,168
🖨 Deal sheet (PDF) 📄 Offer letter ✓ Due diligence
Listing remarks MLS
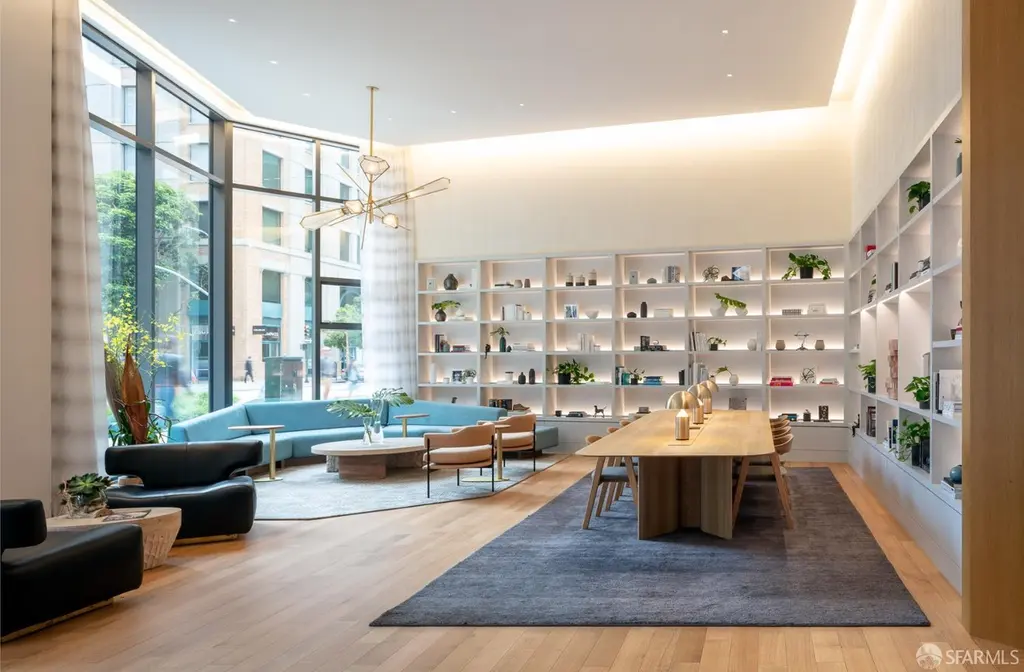
Below Market Rate (BMR) housing opportunity available at MIRA through the Mayor's Office of Housing and Community Development (MOHCD) & subject to resale controls, monitoring and other restrictions. This home is a new home and has never been occupied. Explore a new angle on life at MIRA, luxury condominium homes developed by the team at Tishman Speyer and designed by award-winning architecture Studio Gang. Located at the corner of Main and Folsom Streets in San Francisco, CA, MIRA features iconic architecture, innovative layouts and a bold attitude. Fresh and forward-thinking, MIRA invites you to shift your perspective on living in San Francisco. All images are representative of the development.
Key facts
- Iconic architecture
- Innovative layouts
- New home
Tags
Neighborhood map
What this means for you Summary
Snapshot
- This is a 2-bed/1.0-bath condo listed at $385k. Condition is rated excellent.
Deal economics
- At list price, monthly cash flow is $839 ($10k/yr) — positive.
- The deal already cash-flows at list — no discount required.
- Meets the 1% rule at list price ($6k rent vs $385k).
- Recommended offer: $339k (12.0% below list) — sets the bar for market timing.
- Cap rate 8.9% vs local median 2.1% in San Francisco — top-decile yield for the area; either an underpriced asset or a hidden risk that comps aren't pricing in. Stress-test before assuming the spread holds.
Location & tenants
- Location reads 76/100 on livability (#90 in CA, #3,143 nationally) — a middle-class / working-renter tenant base. Strengths: amenities A+, commute A+, employment A+; Watch: crime F, cost of living F.
- San Francisco Unified (urban): math 50% / reading 56% proficiency, ranked #322 of 1,400 in CA (top 23%) — acceptable for families but not a draw, mixed tenant base, ~2y average lease.
- Zoned schools: Lilienthal (Claire) Elementary (669 students, 19% FRL); Giannini (A.P.) Middle (1,192 students, 34% FRL); Lowell High (2,632 students, 37% FRL) — zoned schools average 30% FRL vs 49% district-wide (19 pts lower); this property's tenant base skews higher-income than the district average.
- Market conditions: Rents rising fast (+19.7%/yr); 119 active listings in the ZIP; 40 comparable units currently listed for rent nearby; rentals leasing fast (median 7d on market — plan ~1-2 weeks tenant-placement turnaround); high-income renter base; 750 units permitted in San Francisco County in 2024 (688 in 5+ unit buildings).
Forward outlook
- In year one you build about $19k of equity ($3k loan paydown + $16k appreciation (4.3% local appreciation)).
- San Francisco County population projected at +39% by 2050 — long-run rental-demand tailwind backs the buy-and-hold thesis.
- At projected returns (4.3% appreciation + 8.0% rent growth), your $108k cash investment doubles in ~4 years — after that, you're playing with house money.
- By year 2, paydown + projected appreciation supports a ~$31k cash-out refi (75% LTV) — recoverable capital for the next deal without selling this one.
Negotiation context
- It's been on market 124 days — a 12% lower offer ($339k) is reasonable based on typical stale-listing flexibility.
Questions for the listing agent
- It's been on market 124 days. Have you received any prior offers? Is the seller open to a 12% concession, seller financing, or rate buy-down credit?
- What does the HOA fee cover, when was the last increase, and are there any pending special assessments or reserve-fund shortfalls?
- Any open or pending special assessments — roof, HVAC, plumbing, elevator, façade? What's the per-unit balance and payoff schedule, and is the seller paying it off at close or rolling it to the buyer?
- Why hasn't it sold? Are there any deal-killer items the seller is aware of (foundation, flood, title, zoning, code violations)?
- Is there a deadline driving the sale (1031 exchange, divorce, estate, relocation)? That informs how much negotiation room exists.
- Schools are B-rated — typically a magnet for longer-tenancy family renters. What's the average tenant stay here, and is there a school-zone premium baked into asking?
- Crime grade is F in this area — have there been break-ins, vandalism, or insurance claims at this property in the last 3 years? What carrier currently insures it and at what premium?
- What's the average days-on-market for RENTAL listings here right now (not sales)? A rising rental-DOM trend means longer vacancies and softer asking-rent achievability than the comps imply.
- What's the recent tenant-quality profile in this submarket — average credit score on applications, eviction rate, late-payment / NSF rate, and stable-employment percentage? A property-management company in the area should have these aggregated.
- How much new apartment / multifamily construction is in the pipeline within 1–3 miles? Heavy new supply (>2% of stock underway) typically softens rents 12–24 months out; light construction supports rent growth.
Investment metrics
- 1% rule
- 1.45% ✓
- Cap rate
- 8.91%
- Cash-on-cash
- 9.34%
- DSCR
- 1.42
- GRM
- 5.7
CMA / ARV
- ARV (median comp)
- $979,893
- List price
- $385,168
- Delta
- -60.69%
- Verdict
- UNDERPRICED
- Comps
- 20 within 1.0 mi
Projected returns pro-forma
4.27% appreciation · 8.0% rent growth · sell at horizon
- IRR
- 23.0%
- Equity multiple
- 2.45×
- Total profit
- $156,598
- Equity at exit
- $201,360
- IRR
- 26.0%
- Equity multiple
- 5.71×
- Total profit
- $507,683
- Equity at exit
- $334,282
Cash invested: $107,847 (down + closing). Projections, not guarantees.
Landlord ↔ Tenant lean methodology
- Overall (CITY)
- 0 Strongly Tenant-Friendly
- State California
- 18 Strongly Tenant-Friendly · D+13
- County
- — inherits STATE
- City San Francisco
- 0 Strongly Tenant-Friendly · D+57
ZIP-level market 94105
- Home prices YoY
- 2.4%
- Rents YoY
- 19.7%
- Active inventory
- 119
- Price-to-rent
- 5.7×
Monthly cashflow live
- Estimated rent
- $5,601 high interval (Pro) →
- Mortgage (P&I)
- −$2,020
- Tax from tax record
- −$480 /mo · $5,758/yr
- Insurance
- −$160
- HOA
- −$925
- Vacancy / Maint / Mgmt
- −$1,176
- Net cashflow
- $839
Break-even live
Sensitivity live
| Price | -10% $1,057 | -5% $948 | +0% $839 | +5% $730 | +10% $621 |
|---|---|---|---|---|---|
| Rent | -10% $397 | -5% $618 | +0% $839 | +5% $1,061 | +10% $1,282 |
| Rate | -1.0pp $1,033 | -0.5pp $937 | base $839 | +0.5pp $740 | +1.0pp $638 |
UW: 25.0% down · 7.5% · 30yr · 1.5% tax · 5.0% vac · 8.0% maint · 8.0% mgmt
Financing live
Cash to close
- Down payment
- $96,292
- Closing costs
- $11,555
- Reserves months
- —
- Total cash needed
- —
Loan-product check · same deal, 3 products live
Conventional
25% down · 7.5% · 30yr
- Down + closing
- —
- Monthly P&I
- —
- Monthly cashflow
- —
- DSCR
- —
- Eligible?
- —
Personal DTI + credit; lowest rate.
DSCR
20% down · 8.5% · 30yr
- Down + closing
- —
- Monthly P&I
- —
- Monthly cashflow
- —
- DSCR
- —
- Eligible?
- —
No personal income docs; deal must DSCR.
Hard money
10% down · 12.0% · 12mo
- Down + closing
- —
- Monthly P&I
- —
- Monthly cashflow
- —
- DSCR
- —
- Eligible?
- —
Short-term bridge; refi at stabilization.
Rent comps 40 comps
| Address | Beds | Baths | Sqft | Rent | $/sqft | DOM | Units | Dist |
|---|---|---|---|---|---|---|---|---|
| 280 Spear St San Francisco, CA | 1.0–2.0 | 1.0 | 865 | $6,950 | $8.03 | 45d | 2 | 0.04mi |
| 301 Main St Unit 20C San Francisco, CA | 1.0 | 1.0 | 758 | $5,950 | $7.85 | 26d | 1 | 0.07mi |
| 333 Main St San Francisco, CA | 1.0 | 1.0 | 835 | $4,950 | $5.93 | 45d | 1 | 0.08mi |
| 88 Howard St San Francisco, CA | 1.0 | 1.0 | 578 | $4,960 | $8.57 | 0d | 10 | 0.12mi |
| 299 Fremont St San Francisco, CA | 1.0 | 1.0 | 536 | $5,829 | $10.88 | 0d | 7 | 0.14mi |
| 403 Main St Unit 206N San Francisco, CA | 1.0 | 1.0 | 910 | $5,200 | $5.71 | 26d | 1 | 0.19mi |
| 399 Fremont St San Francisco, CA | 2.0 | 1.0–2.0 | 825 | $8,808 | $10.68 | 0d | 44 | 0.19mi |
| 201 Harrison St Unit 3A San Francisco, CA | 1.0 | 1.0 | 572 | $1,900 | $3.32 | 23d | 1 | 0.19mi |
| 340 Fremont St San Francisco, CA | 3.0 | 1.0–3.0 | 1146 | $7,028 | $6.13 | 3d | 5 | 0.21mi |
| 400 Beale St San Francisco, CA | 1.0 | 1.0 | 812 | $4,260 | $5.25 | 45d | 1 | 0.21mi |
| 400 Beale St San Francisco, CA | 2.0 | 1.0–2.0 | 1167 | $6,425 | $5.50 | 22d | 2 | 0.21mi |
| 355 1st St Unit S302 San Francisco, CA | 2.0 | 2.0 | 939 | $5,800 | $6.18 | 45d | 1 | 0.23mi |
| 500 Folsom St San Francisco, CA | 1.0 | 1.0 | 676 | $6,987 | $10.34 | 0d | 18 | 0.24mi |
| 38 Bryant St #806 San Francisco, CA | 1.0 | 1.0 | 582 | $3,995 | $6.86 | 45d | 1 | 0.25mi |
| 390 1st St San Francisco, CA | 2.0 | 1.0–2.0 | 676 | $7,546 | $11.16 | 0d | 12 | 0.29mi |
| 39 Tehama St San Francisco, CA | 1.0–2.0 | 1.0–2.0 | 1291 | $20,493 | $15.87 | 0d | 13 | 0.30mi |
| 45 Lansing St San Francisco, CA | 1.0 | 1.0 | 640 | $5,332 | $8.32 | 0d | 4 | 0.30mi |
| 3 Bayside Village Pl San Francisco, CA | 2.0 | 1.0–2.0 | 686 | $6,390 | $9.31 | 0d | 22 | 0.33mi |
| 501 Delancey St #182 San Francisco, CA | 1.0 | 1.0 | 640 | $3,200 | $5.00 | 16d | 1 | 0.34mi |
| 1 Pine St San Francisco, CA | 1.0 | 1.0 | 846 | $3,900 | $4.61 | 20d | 1 | 0.37mi |
| 631 Folsom St San Francisco, CA | 2.0 | 2.0 | 1054 | $6,400 | $6.07 | 26d | 1 | 0.44mi |
| 1 Hawthorne St Unit 8G San Francisco, CA | 1.0 | 1.0 | 846 | $4,200 | $4.96 | 20d | 1 | 0.48mi |
| 219 Brannan St Unit 2B San Francisco, CA | 2.0 | 2.0 | 1062 | $6,000 | $5.65 | 7d | 1 | 0.52mi |
| 1 St Francis Pl San Francisco, CA | 3.0 | 1.0–2.0 | 923 | $4,365 | $4.73 | 0d | 4 | 0.54mi |
| 2 Townsend St San Francisco, CA | 1.0–2.0 | 1.0–2.0 | 786 | $6,925 | $8.81 | 0d | 4 | 0.56mi |
| 460 Davis Ct San Francisco, CA | 3.0 | 1.0–2.5 | 907 | $8,249 | $9.09 | 0d | 15 | 0.58mi |
| 88 Townsend St #311 San Francisco, CA | 1.0 | 1.0 | 632 | $4,450 | $7.04 | 26d | 1 | 0.63mi |
| 555 Bryant St San Francisco, CA | 2.0 | 1.0–2.0 | 687 | $6,574 | $9.57 | 0d | 10 | 0.74mi |
| 555 4th St #539 San Francisco, CA | 1.0 | 1.0 | 752 | $4,500 | $5.98 | 45d | 1 | 0.78mi |
| 821 Folsom St #401 San Francisco, CA | 1.0 | 1.0 | 652 | $3,650 | $5.60 | 26d | 1 | 0.78mi |
| 540 Stockton St Apt 8 San Francisco, CA | 2.0 | 1.0 | 725 | $5,370 | $7.41 | 4d | 1 | 0.83mi |
| 601 4th St #1523 San Francisco, CA | 1.0 | 1.0 | 1085 | $6,070 | $5.59 | 0d | 1 | 0.83mi |
| 260 King St #717 San Francisco, CA | 1.0 | 1.0 | 759 | $4,850 | $6.39 | 4d | 1 | 0.85mi |
| 400 Clementina St #1449 San Francisco, CA | 1.0–2.0 | 1.0–2.0 | 775 | $5,210 | $6.72 | 3d | 2 | 0.94mi |
| 255 King St San Francisco, CA | 3.0 | 1.0–2.5 | 1228 | $6,912 | $5.63 | 0d | 1 | 0.94mi |
| 1142-1146 Montgomery St Unit 1142-A San Francisco, CA | 1.0 | 1.0 | 709 | $4,995 | $7.05 | 26d | 1 | 0.94mi |
| 900 Folsom St San Francisco, CA | 2.0 | 1.0–2.0 | 863 | $6,324 | $7.33 | 0d | 27 | 0.95mi |
| 737 Bush St San Francisco, CA | 1.0 | 1.0 | 750 | $2,595 | $3.46 | 16d | 1 | 0.95mi |
| 2 Mint Plz San Francisco, CA | 2.0 | 1.0 | 800 | $4,500 | $5.62 | 45d | 1 | 0.98mi |
| 1023 3rd St San Francisco, CA | 2.0 | 1.0–2.0 | 743 | $10,000 | $13.46 | 3d | 13 | 0.99mi |
HOA detail condo
- Monthly dues
- $925 · $11,100/yr
- Assessments
- None detected in remarks — confirm with the listing agent.
Listing history 16 events
-
2026-06-21days on market $385,168 Active 124 DOM
-
2026-06-18days on market $385,168 Active 121 DOM
-
2026-06-17days on market $385,168 Active 120 DOM
-
2026-06-16days on market $385,168 Active 119 DOM
-
2026-06-15days on market $385,168 Active 118 DOM
-
2026-06-13days on market $385,168 Active 116 DOM
-
2026-06-13days on market $385,168 Active 115 DOM
-
2026-06-09days on market $385,168 Active 112 DOM
-
2026-06-08days on market $385,168 Active 111 DOM
-
2026-06-07days on market $385,168 Active 110 DOM
-
2026-06-04days on market $385,168 Active 107 DOM
-
2026-06-03days on market $385,168 Active 106 DOM
-
2026-06-02days on market $385,168 Active 105 DOM
-
2026-06-01days on market $385,168 Active 104 DOM
-
2026-05-31days on market $385,168 Active 103 DOM
-
2026-02-17$385,168 Active 710-char remark
Show marketing remark (710 chars)
Below Market Rate (BMR) housing opportunity available at MIRA through the Mayor's Office of Housing and Community Development (MOHCD) & subject to resale controls, monitoring and other restrictions. This home is a new home and has never been occupied. Explore a new angle on life at MIRA, luxury condominium homes developed by the team at Tishman Speyer and designed by award-winning architecture Studio Gang. Located at the corner of Main and Folsom Streets in San Francisco, CA, MIRA features iconic architecture, innovative layouts and a bold attitude. Fresh and forward-thinking, MIRA invites you to shift your perspective on living in San Francisco. All images are representative of the development.
ⓘ Source: listings_history table (triggers on properties + properties_extension) + one-shot
backfill from property_details.listing_events for pre-trigger history.
Tax reassessment forecast CA · Resets to sale price
- Current annual tax
- $5,758 · $480/mo
- Projected year-2 tax
- $5,758 · $480/mo
- Expected delta
- $0/yr ($0/mo · 0.0%)
ⓘ Screening estimate from a state-policy table — verify with the county assessor before closing.
Climate risk First Street
- Flood 1/10 Low FEMA zone X (unshaded) · 0% chance over 30 yrs
- Wildfire 1/10 Low
- Heat 2/10 Low 7 d/yr ≥79°F today · 15 d/yr by 30 yrs out
- Wind 1/10 Low
- Air quality 8/10 Severe 15 unhealthy d/yr today · 15 by 30 yrs out
Nearby sold comps map
Loading sold comps map…
Walkable amenities ~0.75 mi
Loading nearby amenities…
Taxation est. · year 1
- Rental income
- $67,209
- − Mortgage interest
- −$21,575
- − Property taxes
- −$5,758
- − Insurance
- −$1,926
- − Repairs & maintenance
- −$5,377
- − Management
- −$5,377
- − HOA
- −$11,100
- − Depreciation
- −$11,205
- Taxable income
- $4,892
- Est. tax owed @ 24.0%
- −$1,174
- After-tax cash flow
- $8,899/yr
For passive investors: Depreciation is non-cash, so a rental often shows a tax loss while cash-flowing — sheltering income. Rental losses are passive: they offset passive income freely, and up to $25,000/yr can offset ordinary (W-2) income if you actively participate and your MAGI is under $100k (phasing out to $0 by $150k); unused losses carry forward. On sale, claimed depreciation is recaptured at up to 25%, and gains may owe capital-gains tax (a 1031 exchange can defer both). Figures are a year-1 estimate at your 24.0% rate — not tax advice; consult a CPA.
Condition & rehab AI · 12 photos
This modern, move-in-ready condo is in excellent condition with a fresh, clean interior and a well-maintained exterior. It offers a great opportunity for both buyers and renters looking for a high-end living space in a prime location.
Value-add opportunities
- Resale Painting the interior walls — Fresh paint can enhance the home's curb appeal and make it more appealing to potential buyers.
- Resale Updating the flooring — Replacing worn-out flooring with a more modern or durable option can increase the home's value.
- Resale Upgrading the kitchen appliances — Modernizing the kitchen appliances can make the home more appealing to potential buyers.
- Rental Adding smart home features — Smart home features can attract tenants who value convenience and technology.
- Both Landscaping the exterior — A well-maintained and landscaped exterior can enhance the home's curb appeal and attract both buyers and tenants.
Renovation cost estimate screening
Value-add ROI direction
- Resale Painting the interior walls — Fresh paint can enhance the home's curb appeal and make it more appealing to potential buyers. ↑
- Resale Updating the flooring — Replacing worn-out flooring with a more modern or durable option can increase the home's value. ↑
- Resale Upgrading the kitchen appliances — Modernizing the kitchen appliances can make the home more appealing to potential buyers. ↑
- Rental Adding smart home features — Smart home features can attract tenants who value convenience and technology. ↑
- Both Landscaping the exterior — A well-maintained and landscaped exterior can enhance the home's curb appeal and attract both buyers and tenants. ↑
ⓘ Cost ranges are severity-bucket heuristics (US national rule-of-thumb). Get contractor quotes + a written scope before underwriting a rehab budget.
Schools (NCES district)
- District
- San Francisco Unified
- NCES district ID
- 0634410
- Math proficiency
- 50% ▬ 0.00%
- Reading proficiency
- 56% ▲ 1.00%
- Median HH income
- $81,249
- Composite
- 50.14/100
- National rank
- #4088
- State rank
- #322 of 1400 in CA
Livability — San Francisco
- Score
- 76/100
- State rank
- #90
- US rank
- #3143
Category grades
Schools grade is shown separately in the Schools card above.
Census & demographics
- Census place
- San Francisco, CA
- County
- San Francisco County · 827,552 people
- City population
- 827,552
- Metro
- San Francisco-Oakland-Berkeley, CA
- Population (ZIP)
- 13,861
- Household income
- $225,000
- Rent vs Own
- Severe rent burden
- 798.0
Population outlook (San Francisco County) Hauer SSP2
- Today (2025)
- 1,030,936 people
- By 2030
- 1,110,409 · +7.7%
- By 2040
- 1,270,010 · +23.2%
- By 2050
- 1,435,001 · +39.2%
- By 2075
- 1,779,074 · +72.6%
- By 2100
- 1,966,767 · +90.8%
Race, ethnicity, and origin ACS 2023
- Neighborhood character
- Diverse neighborhood (Simpson 0.61)
- Race & ethnicity
- Asian 53% White 31% Hispanic / Latino 9% Two or more races 5% Black 2%
- Hispanic origin (detail)
- Mexican 4%
- Common ancestry
- Italian 4% Scotch-Irish 2% Romanian 2%
- Foreign-born
- 45% · China, Canada, South Korea
- Languages at home
- 52% English-only · Chinese 22% Other Indo-European 6% Spanish 6%
Political lean MEDSL · San Francisco
- 2024 margin
- Solid D (+64.8) · D 80.3% · R 15.5% · Other 4.1%
- 2008→2024 swing
- -5.7pp toward R · 2008: 70.5pp · 2024: 64.8pp
- All cycles
- 2024: D+64.8 2020: D+72.5 2016: D+76.1 2012: D+70.2 2008: D+70.5
Not yet ingested
- Civics
- —
Market trends
- HPI YoY
- ▲ 4.27%
- Current HPI
- 179.3791
- Rent YoY
- ▲ 19.74%
- Metro
- San Francisco-Oakland-Berkeley, CA
- State GDP YoY
- ▲ 3.21%
- F500 in state
- 116
Industry mix (Fortune 500 HQ in CA)
| Industry | F500 HQs | Revenue |
|---|---|---|
| Technology | 27 | $1,492B |
|
||
| Financial Services | 3 | $174B |
|
||
| Retail | 3 | $44B |
|
||
| Insurance | 3 | $26B |
|
||
| Media / Entertainment | 2 | $115B |
|
||
| Pharmaceuticals / Biotech | 2 | $62B |
|
||
Price history
1 event — show timeline
- 2026-02-17 Listed $385,168 San Francisco MLS
Property tax history
+12.7%/yrLatest (2025): $5,758 · +3.2% YoY. Source: county tax records.
Cash-flow waterfall
monthlySold comps — $/sqft
last 12 mo · ≤1 miLoading sold comps…