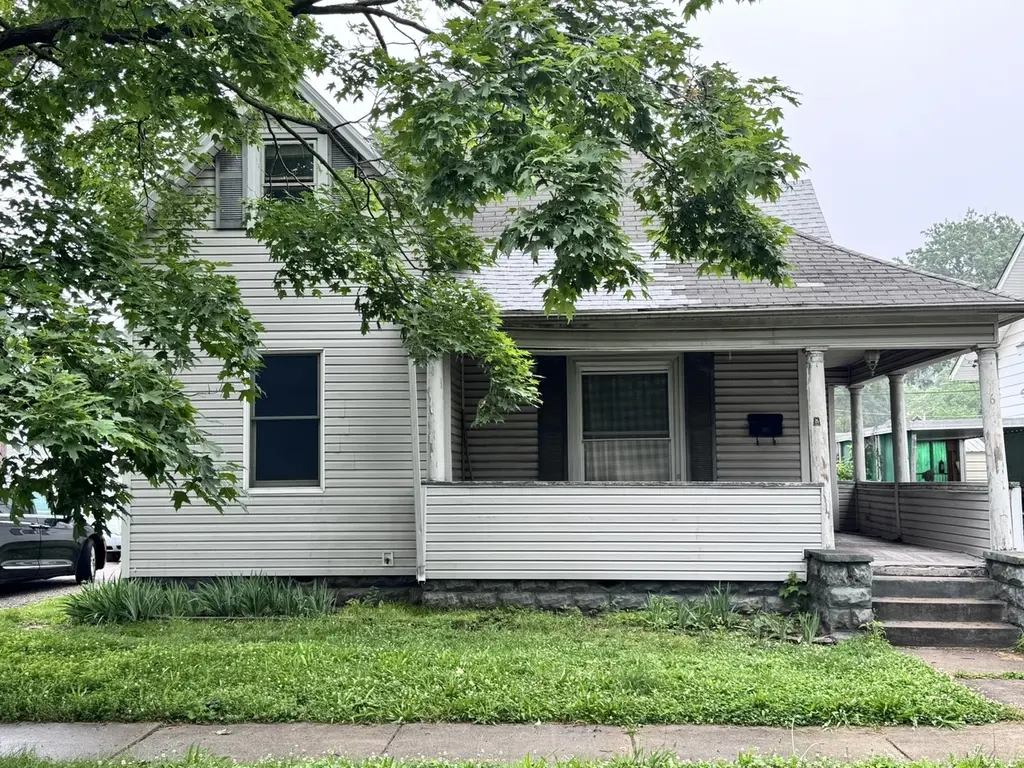
620 E Noleman St · Centralia, IL
Flood risk 1/10 · Minimal
- FEMA flood zone
- X (unshaded)
- Chance of flooding over 30 yrs
- 0.0%
- Est. flood insurance / yr
- $473 – $860
Fire risk 1/10 · Minimal
- Est. fire insurance / yr
- $804 – $1,492
Heat risk 4/10 · Minor
- Hot days now (above 106°F)
- 7 days/yr
- Hot days in 30 yrs
- 20 days/yr
Wind risk 2/10 · Minimal
- Chance of severe wind over 30 yrs
- 2.0%
Air-quality risk 2/10 · Minimal
- Unhealthy air days now
- 1 days/yr
- Unhealthy air days in 30 yrs
- 1 days/yr
Risk factors via First Street. Map © Google.
Why this score? — see what drove the B- grade
The composite is a weighted blend of 9 inputs, each scored 0–100. Each bar is that input's sub-score; the figure is the points it added to the 100-point composite (weight × sub-score).
- Cash flow +30.0/30.0
- 1% rule +10.0/10.0
- DSCR +10.0/10.0
- ARV discount +7.5/15.0
- Livability +3.4/5.0
- Rent growth +2.5/5.0
- Condition / age +2.5/5.0
- Schools +2.2/10.0
- Appreciation +0.0/10.0
$49,900
🖨 Deal sheet (PDF) 📄 Offer letter ✓ Due diligence
Listing remarks
Calling all investors & landlords! This spacious 3 bedroom, 1 bathroom home offers plenty of room and endless potential. Conveniently located within walking distance to local amenities, shopping, and more. Seller is HIGHLY MOTIVATED and ready to make a deal!
Key facts
- 3,179 sq ft lot
- 2 parking spots
- Built 1923
Property features AI
Finance
- Other: Built before 1978
- HOA & community: No master association fee required
Exterior
- Parking: Two owned parking spaces
- Utilities: Public water; Public sewer
- Home design: Detached single-family, one-story home; Fee simple ownership; Property currently leased; Built more than 100 years ago; School bus service available
- Construction: Vinyl siding; Asphalt roof; Block foundation
- Exterior features: Level lot; Lot dimensions approximately 40 x 80; Less than 0.25 acre
Interior
- Kitchen: Kitchen on main level (11 x 11) with vinyl flooring
- Bedrooms: Master bedroom on main level (14 x 11) with carpet; Bedroom on main level (13 x 13) with carpet; Bedroom on main level (11 x 11) with carpet
- Flooring: Carpet in main living areas and bedrooms; Vinyl flooring in kitchen and laundry
- Bathrooms: Three full bathrooms
- Heating & cooling: Forced air heating; Central air conditioning
- Interior features: Six total rooms; Unfinished partial basement
- Laundry & utility: Main-level laundry room (5 x 9) with vinyl flooring
Neighborhood map
What this means for you Summary
Snapshot
- This is a 3-bed/1.0-bath other listed at $50k.
Deal economics
- At list price, monthly cash flow is $237 ($3k/yr) — positive.
- The deal already cash-flows at list — no discount required.
- Meets the 1% rule at list price ($800 rent vs $50k).
- Recommended offer: $49k (1.5% below list) — sets the bar for market timing.
- Cap rate 12.0% vs local median 5.9% in Centralia — top-decile yield for the area; either an underpriced asset or a hidden risk that comps aren't pricing in. Stress-test before assuming the spread holds.
Location & tenants
- Location reads 68/100 on livability (#481 in IL) — a middle-class / working-renter tenant base. Strengths: cost of living A+, housing A+, health & safety A+; Watch: crime F, amenities F, commute F.
- Centralia Hsd 200 (town): math 21% / reading 26% proficiency, ranked #668 of 919 in IL (top 73%) — low school quality limits family demand, transient renter base, plan for 1-2y turnover.
- Zoned schools: Centralia High School (math 22% / reading 17%, grade F, #397 of 693 statewide, top 61%, 863 students, 0% FRL).
- Market conditions: 107 active listings in the ZIP; 1 comparable units currently listed for rent nearby; 2 units permitted in Marion County in 2024 (0 in 5+ unit buildings).
Forward outlook
- Local home prices are declining (-3.0%/yr); year-one equity from $345 of loan paydown is wiped out by about $1k of value loss. Plan a longer hold.
- Marion County population projected at -20% by 2050 — secular population decline; favor cash flow + early exit over multi-decade hold.
- At projected returns (-3.0% appreciation + 3.0% rent growth), your $14k cash investment doubles in ~6 years — after that, you're playing with house money.
Negotiation context
- It's been on market 25 days — a 2% lower offer ($49k) is reasonable based on typical stale-listing flexibility.
- 9 sale attempts since 23y ago with the ask held roughly flat each time — persistent listings suggest the price (not the market) is what's stuck; bring a comps-based counter.
- Current owner paid $12k; list at $50k implies a 319% gain — meaningful room to come down on a strong offer.
Risks & watch-outs
- Watch-outs: property tax is 2.7% of price; built in 1923 — expect roof / HVAC / electrical / plumbing capex.
Questions for the listing agent
- Built in 1923 — when were the roof, HVAC, electrical panel, plumbing, and water heater last replaced?
- Property tax is high relative to price — has the assessment been appealed recently, and will the sale trigger a re-assessment?
- Is there a deadline driving the sale (1031 exchange, divorce, estate, relocation)? That informs how much negotiation room exists.
- Schools are D-rated, which usually means shorter tenancies and higher turnover. Who's the typical renter profile here, and what's been the actual vacancy rate?
- Crime grade is F in this area — have there been break-ins, vandalism, or insurance claims at this property in the last 3 years? What carrier currently insures it and at what premium?
- What's the average days-on-market for RENTAL listings here right now (not sales)? A rising rental-DOM trend means longer vacancies and softer asking-rent achievability than the comps imply.
- What's the recent tenant-quality profile in this submarket — average credit score on applications, eviction rate, late-payment / NSF rate, and stable-employment percentage? A property-management company in the area should have these aggregated.
- How much new for-sale + rental construction is in the pipeline within 1–3 miles? Heavy new supply typically softens prices + rents 12–24 months out; constrained supply supports both.
Investment metrics
- 1% rule
- 1.60% ✓
- Cap rate
- 11.99%
- Cash-on-cash
- 20.36%
- DSCR
- 1.91
- GRM
- 5.2
CMA / ARV
No comps found within radius.
Projected returns pro-forma
-3.0% appreciation · 3.0% rent growth · sell at horizon
- IRR
- 12.7%
- Equity multiple
- 1.50×
- Total profit
- $7,053
- Equity at exit
- $7,440
- IRR
- 21.6%
- Equity multiple
- 2.84×
- Total profit
- $25,754
- Equity at exit
- $4,314
Cash invested: $13,972 (down + closing). Projections, not guarantees.
Landlord ↔ Tenant lean methodology
- Overall (STATE)
- 43 Moderately Tenant-Leaning
- State Illinois
- 43 Moderately Tenant-Leaning · D+7
- County
- — inherits STATE
- City
- — inherits STATE
ZIP-level market 62801
- Home prices YoY
- -13.9%
- Active inventory
- 107
- Price-to-rent
- 5.2×
Monthly cashflow live
- Estimated rent
- $800 medium interval (Pro) →
- Mortgage (P&I)
- −$262
- Tax from tax record
- −$113 /mo · $1,350/yr
- Insurance
- −$21
- HOA
- −$0
- Vacancy / Maint / Mgmt
- −$168
- Net cashflow
- $237
Break-even live
Sensitivity live
| Price | -10% $265 | -5% $251 | +0% $237 | +5% $223 | +10% $209 |
|---|---|---|---|---|---|
| Rent | -10% $174 | -5% $205 | +0% $237 | +5% $269 | +10% $300 |
| Rate | -1.0pp $262 | -0.5pp $250 | base $237 | +0.5pp $224 | +1.0pp $211 |
UW: 25.0% down · 7.5% · 30yr · 1.5% tax · 5.0% vac · 8.0% maint · 8.0% mgmt
Financing live
Cash to close
- Down payment
- $12,475
- Closing costs
- $1,497
- Reserves months
- —
- Total cash needed
- —
Loan-product check · same deal, 3 products live
Conventional
25% down · 7.5% · 30yr
- Down + closing
- —
- Monthly P&I
- —
- Monthly cashflow
- —
- DSCR
- —
- Eligible?
- —
Personal DTI + credit; lowest rate.
DSCR
20% down · 8.5% · 30yr
- Down + closing
- —
- Monthly P&I
- —
- Monthly cashflow
- —
- DSCR
- —
- Eligible?
- —
No personal income docs; deal must DSCR.
Hard money
10% down · 12.0% · 12mo
- Down + closing
- —
- Monthly P&I
- —
- Monthly cashflow
- —
- DSCR
- —
- Eligible?
- —
Short-term bridge; refi at stabilization.
Rent comps 1 comps
| Address | Beds | Baths | Sqft | Rent | $/sqft | DOM | Units | Dist |
|---|---|---|---|---|---|---|---|---|
| 805 S Hickory St Centralia, IL | 3.0 | 2.0 | 1814 | $800 | $0.44 | 45d | 1 | 1.00mi |
Listing history 38 events
-
2026-06-21days on market $49,900 Active 25 DOM
-
2026-06-21days on market $49,900 Active 24 DOM
-
2026-06-18days on market $49,900 Active 22 DOM
-
2026-06-17days on market $49,900 Active 21 DOM
-
2026-06-16days on market $49,900 Active 20 DOM
-
2026-06-15days on market $49,900 Active 19 DOM
-
2026-06-13days on market $49,900 Active 17 DOM
-
2026-06-12days on market $49,900 Active 16 DOM
-
2026-06-09days on market $49,900 Active 13 DOM
-
2026-06-08days on market $49,900 Active 12 DOM
-
2026-06-07days on market $49,900 Active 11 DOM
-
2026-06-07days on market $49,900 Active 10 DOM
-
2026-06-04days on market $49,900 Active 7 DOM
-
2026-06-02days on market $49,900 Active 6 DOM
-
2026-06-01days on market $49,900 Active 5 DOM
-
2026-05-31days on market $49,900 Active 4 DOM
-
2026-05-31days on market $49,900 Active 3 DOM
-
2026-05-25$49,900 Active
-
2025-12-17historical
-
2025-03-25historical
-
2024-10-08$49,000 Active
-
2024-04-23historical
-
2023-10-23$45,000 Active
-
2023-09-23historical
-
2023-04-03$45,000 Active
-
2023-03-22historical
-
2023-01-18price $45,000
-
2022-08-11status Active
-
2021-08-07historical
-
2021-08-06historical
-
2014-03-27soldstatus $11,900
-
2014-03-27soldstatus $11,900
-
2013-11-04$11,900
-
2013-11-04$11,900
-
2004-11-29soldstatus $31,000
-
2004-10-20$32,500
-
2003-08-22soldstatus $18,500
-
2003-06-18$21,000
ⓘ Source: listings_history table (triggers on properties + properties_extension) + one-shot
backfill from property_details.listing_events for pre-trigger history.
Tax reassessment forecast IL · Partial reset (capped growth)
- Current annual tax
- $1,350 · $113/mo
- Projected year-2 tax
- $1,350 · $113/mo
- Expected delta
- $0/yr ($0/mo · 0.0%)
ⓘ Screening estimate from a state-policy table — verify with the county assessor before closing.
Climate risk First Street
- Flood 1/10 Low FEMA zone X (unshaded) · 0% chance over 30 yrs
- Wildfire 1/10 Low
- Heat 4/10 Moderate 7 d/yr ≥106°F today · 20 d/yr by 30 yrs out
- Wind 2/10 Low 2% chance of damaging wind over 30 yrs
- Air quality 2/10 Low 1 unhealthy d/yr today · 1 by 30 yrs out
Nearby sold comps map
Loading sold comps map…
Walkable amenities ~0.75 mi
Loading nearby amenities…
Taxation est. · year 1
- Rental income
- $9,600
- − Mortgage interest
- −$2,795
- − Property taxes
- −$1,350
- − Insurance
- −$250
- − Repairs & maintenance
- −$768
- − Management
- −$768
- − Depreciation
- −$1,452
- Taxable income
- $2,218
- Est. tax owed @ 24.0%
- −$532
- After-tax cash flow
- $2,312/yr
For passive investors: Depreciation is non-cash, so a rental often shows a tax loss while cash-flowing — sheltering income. Rental losses are passive: they offset passive income freely, and up to $25,000/yr can offset ordinary (W-2) income if you actively participate and your MAGI is under $100k (phasing out to $0 by $150k); unused losses carry forward. On sale, claimed depreciation is recaptured at up to 25%, and gains may owe capital-gains tax (a 1031 exchange can defer both). Figures are a year-1 estimate at your 24.0% rate — not tax advice; consult a CPA.
Schools (NCES district)
- District
- Centralia Hsd 200
- NCES district ID
- 1709300
- Math proficiency
- 21% ▲ 6.00%
- Reading proficiency
- 26% ▲ 1.00%
- Median HH income
- $34,555
- Composite
- 22.43/100
- National rank
- #13470
- State rank
- #668 of 919 in IL
Livability — Centralia
- Score
- 68/100
- State rank
- #481
- US rank
- #9987
Category grades
Schools grade is shown separately in the Schools card above.
Census & demographics
- Census place
- Centralia, IL
- City population
- 19,941
- Population (ZIP)
- 19,941
Population outlook (Marion County) Hauer SSP2
- Today (2025)
- 36,071 people
- By 2030
- 34,598 · -4.1%
- By 2040
- 31,754 · -12.0%
- By 2050
- 28,912 · -19.8%
- By 2075
- 22,527 · -37.5%
- By 2100
- 16,455 · -54.4%
Race, ethnicity, and origin ACS 2023
- Neighborhood character
- Predominantly White (81%)
- Race & ethnicity
- White 81% Black 11% Two or more races 4% Hispanic / Latino 4% Asian 1%
- Common ancestry
- Serbian 2% Romanian 2% Lithuanian 1%
- Foreign-born
- 3% · Canada, China
- Languages at home
- 96% English-only · Spanish 2%
Political lean MEDSL · Marion
- 2024 margin
- Solid R (+49.5) · D 24.6% · R 74.1% · Other 1.4%
- 2008→2024 swing
- -47.5pp toward R · 2008: -2.0pp · 2024: -49.5pp
- All cycles
- 2024: R+49.5 2020: R+46.6 2016: R+44.9 2012: R+19.2 2008: R+2.0
Not yet ingested
- Civics
- —
Market trends
- HPI YoY
- ▼ -34.12%
- Current HPI
- 211.3835
- Rent YoY
- —
- Metro
- —
- State GDP YoY
- ▲ 1.59%
- F500 in state
- 60
Industry mix (Fortune 500 HQ in IL)
| Industry | F500 HQs | Revenue |
|---|---|---|
| Insurance | 4 | $201B |
|
||
| Consumer Goods | 4 | $87B |
|
||
| Industrial Machinery | 3 | $64B |
|
||
| Healthcare | 2 | $55B |
|
||
| Retail / Pharmacy | 1 | $148B |
|
||
| Agriculture / Food | 1 | $86B |
|
||
Price history
+137.6% since first listed21 events — show timeline
- 2026-05-25 Listed $49,900 MRED as Distributed by MLS Grid
- 2025-12-17 Listing Removed — MRED as Distributed by MLS Grid
- 2025-03-25 Delisted — MARIS as Distributed by MLS Grid
- 2024-10-08 Listed $49,000 MARIS as Distributed by MLS Grid
- 2024-04-23 Delisted — MARIS as Distributed by MLS Grid
- 2023-10-23 Listed $45,000 MARIS as Distributed by MLS Grid
- 2023-09-23 Delisted — MARIS as Distributed by MLS Grid
- 2023-04-03 Listed $45,000 MARIS as Distributed by MLS Grid
- 2023-03-22 Delisted — MARIS as Distributed by MLS Grid
- 2023-01-18 Price Changed $45,000 MARIS as Distributed by MLS Grid
- 2022-08-11 Relisted — MARIS as Distributed by MLS Grid
- 2021-08-07 Listing Removed — RMLSA as Distributed by MLS Grid
- 2021-08-06 Listing Removed — RMLSA as Distributed by MLS Grid
- 2014-03-27 Sold (MLS) $11,900 MRED as Distributed by MLS Grid
- 2014-03-27 Sold (MLS) $11,900 RMLSA as Distributed by MLS Grid
- 2013-11-04 Listed $11,900 MRED as Distributed by MLS Grid
- 2013-11-04 Listed $11,900 RMLSA as Distributed by MLS Grid
- 2004-11-29 Sold (MLS) $31,000 RMLSA as Distributed by MLS Grid
- 2004-10-20 Listed $32,500 RMLSA as Distributed by MLS Grid
- 2003-08-22 Sold (MLS) $18,500 RMLSA as Distributed by MLS Grid
- 2003-06-18 Listed $21,000 RMLSA as Distributed by MLS Grid
Property tax history
+3.1%/yrLatest (2024): $1,350 · -3.1% YoY. Source: county tax records.
Cash-flow waterfall
monthlySold comps — $/sqft
last 12 mo · ≤1 miLoading sold comps…