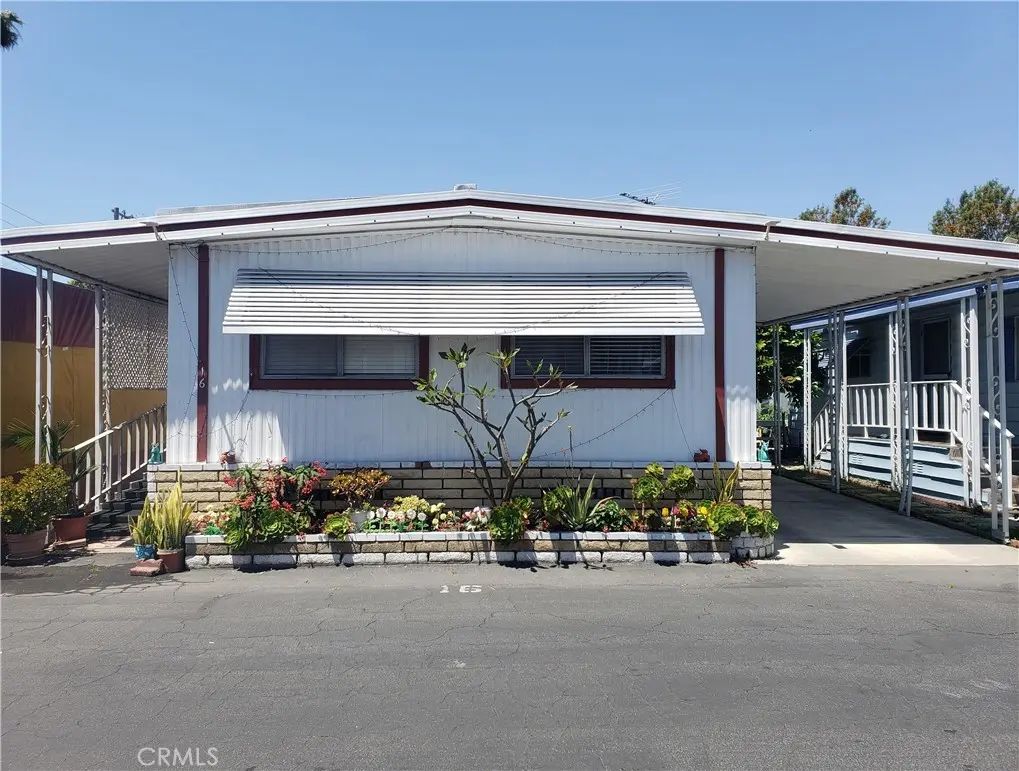
3929 W 5th Street, #16 · Santa Ana, CA
Flood risk 2/10 · Minimal
- FEMA flood zone
- A
- Chance of flooding over 30 yrs
- 0.05%
- Est. flood insurance / yr
- $1,009 – $1,996
Fire risk 1/10 · Minimal
- Est. fire insurance / yr
- $659 – $1,223
Heat risk 5/10 · Moderate
- Hot days now (above 89°F)
- 7 days/yr
- Hot days in 30 yrs
- 23 days/yr
Wind risk 1/10 · Minimal
- Chance of severe wind over 30 yrs
- —
Air-quality risk 4/10 · Minor
- Unhealthy air days now
- 5 days/yr
- Unhealthy air days in 30 yrs
- 5 days/yr
Risk factors via First Street. Map © Google.
Why this score? — see what drove the C+ grade
The composite is a weighted blend of 9 inputs, each scored 0–100. Each bar is that input's sub-score; the figure is the points it added to the 100-point composite (weight × sub-score).
- Cash flow +30.0/30.0
- 1% rule +10.0/10.0
- DSCR +10.0/10.0
- Schools +4.5/10.0
- Livability +2.8/5.0
- Rent growth +2.5/5.0
- Condition / age +2.5/5.0
- ARV discount +1.1/15.0
- Appreciation +0.0/10.0
$159,950
🖨 Deal sheet (PDF) 📄 Offer letter ✓ Due diligence
Listing remarks
Quiet, peaceful, and well maintained senior mobile home park Town and Country Villa. Move in condition. 2 bedrooms, 2 bathrooms and 800 sqft spacious and bright airy living space. Home offers large living room, master bedroom, dining room area, 1 car port and abundance of community parking spaces. Washer and Dryer inside. Registered owner has to be 55+ year old and 2nd person is 40+ year old. Low lease space for only $1,120 per month. Amenities include spacious clubhouse for special and important events, multiple guest parking spaces, and swimming pool. Conveniently close to restaurants, stores, and supermarkets
Key facts
- Dining room area
- Swimming pool
- Large living room
Tags
Property features AI
Finance
- Financial info: Monthly land lease of $1,120 (park-managed)
- HOA & community: Part of association; Senior community; Park name: Town and Country Villa Park; Manager approval required
Exterior
- Parking: Private carport (1 space)
- Security: Carbon monoxide detector(s)
- Utilities: District/public water; Public sewer; Natural gas connected; Electricity connected
- Home design: Manufactured/mobile home (10' x 40'); Mobile home remains on site; Single-story; Entry level 1
- Construction: Year built per builder
- Exterior features: Shed; Community pool; Greenbelt; Close to clubhouse; Sidewalks
Interior
- Kitchen: Gas cooktop; Water heater unit
- Bedrooms: Primary bedroom
- Flooring: Laminate flooring
- Bathrooms: 2 full bathrooms with showers
- Heating & cooling: Forced air heating; Wall/window cooling
- Interior features: Front entry; One-level home; Carbon monoxide detector(s)
- Laundry & utility: Laundry inside; Gas and electric dryer hookups
Neighborhood map
What this means for you Summary
Snapshot
- This is a 2-bed/2.0-bath manufactured listed at $160k.
Deal economics
- At list price, monthly cash flow is $830 ($10k/yr) — positive.
- The deal already cash-flows at list — no discount required.
- Meets the 1% rule at list price ($3k rent vs $160k).
- Recommended offer: $158k (1.5% below list) — sets the bar for market timing.
- Cap rate 13.5% vs local median 2.5% in Santa Ana — top-decile yield for the area; either an underpriced asset or a hidden risk that comps aren't pricing in. Stress-test before assuming the spread holds.
Location & tenants
- Location reads 55/100 on livability (#871 in CA) — a working-class tenant base; expect higher turnover. Strengths: employment A; Watch: schools D, crime D-, amenities F.
- Garden Grove Unified (suburban): math 38% / reading 65% proficiency, ranked #132 of 517 in CA (top 26%) — acceptable for families but not a draw, mixed tenant base, ~2y average lease; 60% free/reduced lunch — lower-income household profile, screen leases tightly.
- Market conditions: 60 active listings in the ZIP; 28 comparable units currently listed for rent nearby; rentals at typical pace (median 20d on market — plan ~3-4 weeks tenant-placement turnaround); solid renter incomes; 6,974 units permitted in Orange County in 2024 (3,839 in 5+ unit buildings).
- This rent runs 37% of the median local income ($84k/yr) — at the standard rent-burdened threshold; future hikes will face affordability resistance.
Forward outlook
- Local home prices are declining (-3.0%/yr); year-one equity from $1k of loan paydown is wiped out by about $5k of value loss. Plan a longer hold.
- Orange County population projected at +14% by 2050 — modest demand growth; plan on rents tracking national, not racing it.
- At projected returns (-3.0% appreciation + 3.0% rent growth), your $45k cash investment doubles in ~6 years — after that, you're playing with house money.
Negotiation context
- It's been on market 15 days — a 2% lower offer ($158k) is reasonable based on typical stale-listing flexibility.
- 5 sale attempts since 5y ago with the ask held roughly flat each time — persistent listings suggest the price (not the market) is what's stuck; bring a comps-based counter.
- Current owner paid $85k; list at $160k implies a 88% gain — meaningful room to come down on a strong offer.
Risks & watch-outs
- Watch-outs: flood insurance adds $125/mo.
- Climate carrying-cost: in FEMA flood zone A (mandatory federal flood insurance); extreme-heat days projected 7→23/yr by 2055 (HVAC capex compounding) — expect insurance premiums to compound above CPI over the hold.
Questions for the listing agent
- Built in 1972 — when were the roof, HVAC, electrical panel, plumbing, and water heater last replaced?
- What's the actual annual flood-insurance premium (NFIP or private), and is the property in a SFHA with mandatory coverage?
- Is there a deadline driving the sale (1031 exchange, divorce, estate, relocation)? That informs how much negotiation room exists.
- Schools are D-rated, which usually means shorter tenancies and higher turnover. Who's the typical renter profile here, and what's been the actual vacancy rate?
- Crime grade is D in this area — have there been break-ins, vandalism, or insurance claims at this property in the last 3 years? What carrier currently insures it and at what premium?
- What's the average days-on-market for RENTAL listings here right now (not sales)? A rising rental-DOM trend means longer vacancies and softer asking-rent achievability than the comps imply.
- What's the recent tenant-quality profile in this submarket — average credit score on applications, eviction rate, late-payment / NSF rate, and stable-employment percentage? A property-management company in the area should have these aggregated.
- How much new for-sale + rental construction is in the pipeline within 1–3 miles? Heavy new supply typically softens prices + rents 12–24 months out; constrained supply supports both.
Investment metrics
- 1% rule
- 1.63% ✓
- Cap rate
- 13.46%
- Cash-on-cash
- 25.58%
- DSCR
- 2.14
- GRM
- 5.1
CMA / ARV
- ARV (on-the-fly)
- $140,000
- Comps found
- 1
Show comp detail 1 sale within ~0.75 mi
| Address | Dist | Beds/Ba | Sqft | Sold | Price | $/sf | Match |
|---|---|---|---|---|---|---|---|
| 4117 W Mc Fadden #313 | 0.72mi | 2/2.0 | 800 (0%) | 8mo | $140,000 | $175 | 60 |
Match score weights: distance 35% · size 25% · config 20% · recency 20%. Top-matched comps best support the ARV.
Projected returns pro-forma
-3.0% appreciation · 3.0% rent growth · sell at horizon
- IRR
- 15.0%
- Equity multiple
- 1.60×
- Total profit
- $27,031
- Equity at exit
- $23,849
- IRR
- 23.8%
- Equity multiple
- 3.06×
- Total profit
- $92,042
- Equity at exit
- $13,830
Cash invested: $44,786 (down + closing). Projections, not guarantees.
Landlord ↔ Tenant lean methodology
- Overall (STATE)
- 18 Strongly Tenant-Friendly
- State California
- 18 Strongly Tenant-Friendly · D+13
- County
- — inherits STATE
- City
- — inherits STATE
ZIP-level market 92703
- Active inventory
- 60
- Price-to-rent
- 5.1×
Monthly cashflow live
- Estimated rent
- $2,608 high interval (Pro) →
- Mortgage (P&I)
- −$839
- Tax est. 1.5%
- −$200 /mo · $2,399/yr
- Insurance
- −$67
- Flood insurance flood zone
- −$125 /mo · $1,502/yr
- HOA
- −$0
- Vacancy / Maint / Mgmt
- −$548
- Net cashflow
- $830
Break-even live
Sensitivity live
| Price | -10% $940 | -5% $885 | +0% $830 | +5% $774 | +10% $719 |
|---|---|---|---|---|---|
| Rent | -10% $624 | -5% $727 | +0% $830 | +5% $933 | +10% $1,036 |
| Rate | -1.0pp $910 | -0.5pp $870 | base $830 | +0.5pp $788 | +1.0pp $746 |
UW: 25.0% down · 7.5% · 30yr · 1.5% tax · 5.0% vac · 8.0% maint · 8.0% mgmt
Financing live
Cash to close
- Down payment
- $39,988
- Closing costs
- $4,798
- Reserves months
- —
- Total cash needed
- —
Loan-product check · same deal, 3 products live
Conventional
25% down · 7.5% · 30yr
- Down + closing
- —
- Monthly P&I
- —
- Monthly cashflow
- —
- DSCR
- —
- Eligible?
- —
Personal DTI + credit; lowest rate.
DSCR
20% down · 8.5% · 30yr
- Down + closing
- —
- Monthly P&I
- —
- Monthly cashflow
- —
- DSCR
- —
- Eligible?
- —
No personal income docs; deal must DSCR.
Hard money
10% down · 12.0% · 12mo
- Down + closing
- —
- Monthly P&I
- —
- Monthly cashflow
- —
- DSCR
- —
- Eligible?
- —
Short-term bridge; refi at stabilization.
Rent comps 28 comps
| Address | Beds | Baths | Sqft | Rent | $/sqft | DOM | Units | Dist |
|---|---|---|---|---|---|---|---|---|
| 4109 W 5th St Unit C3 Santa Ana, CA | 2.0 | 2.0 | 921 | $2,500 | $2.71 | 23d | 1 | 0.08mi |
| 4109 W 5th St Unit C3 Santa Ana, CA | 2.0 | 2.0 | 921 | $2,900 | $3.15 | 44d | 1 | 0.08mi |
| 4201 W 5th St Santa Ana, CA | 2.0 | 1.0 | 921 | $2,800 | $3.04 | 8d | 1 | 0.14mi |
| 3900 W 5th St Santa Ana, CA | 1.0–2.0 | 1.0–2.0 | 780 | $2,175 | $2.79 | 14d | 1 | 0.16mi |
| 4200 W 1st St Santa Ana, CA | 1.0–2.0 | 1.0–2.0 | 714 | $2,929 | $4.10 | 0d | 5 | 0.38mi |
| 1314 N Harbor Blvd Santa Ana, CA | 2.0 | 2.0 | 884 | $2,742 | $3.10 | 14d | 4 | 0.49mi |
| 225 S Newhope St Santa Ana, CA | 1.0–2.0 | 1.0–2.0 | 822 | $2,288 | $2.78 | 0d | 2 | 0.54mi |
| 1500 N Harbor Blvd Santa Ana, CA | 1.0–2.0 | 1.0–2.0 | 780 | $2,575 | $3.30 | 16d | 1 | 0.55mi |
| 3200 W 5th St Santa Ana, CA | 1.0–2.0 | 1.0–2.0 | 769 | $3,350 | $4.36 | 0d | 9 | 0.66mi |
| 308 S Laurel St Unit C Santa Ana, CA | 2.0 | 1.0 | 950 | $2,650 | $2.79 | 44d | 1 | 0.66mi |
| 3630 Westminster Ave Santa Ana, CA | 1.0 | 1.0 | 696 | $2,508 | $3.60 | 23d | 1 | 0.66mi |
| 3630 Westminster Ave Santa Ana, CA | 2.0 | 2.0 | 997 | $2,758 | $2.77 | 44d | 1 | 0.66mi |
| 517 S Newhope St Santa Ana, CA | 2.0 | 1.0 | 840 | $2,125 | $2.53 | 45d | 1 | 0.72mi |
| 11075 Westminster Ave Garden Grove, CA | 1.0 | 1.0 | 717 | $1,995 | $2.78 | 3d | 1 | 1.04mi |
| 4800 W McFadden Ave Santa Ana, CA | 2.0 | 1.0 | 820 | $2,450 | $2.99 | 19d | 1 | 1.04mi |
| 13884 Euclid St Unit F08 Garden Grove, CA | 2.0 | 1.5 | 900 | $2,895 | $3.22 | 25d | 1 | 1.11mi |
| 13884 Euclid St Apt C12 Garden Grove, CA | 3.0 | 1.5 | 1060 | $3,335 | $3.15 | 25d | 1 | 1.11mi |
| 13884 Euclid St Unit D07 Garden Grove, CA | 3.0 | 1.5 | 1060 | $3,300 | $3.11 | 3d | 1 | 1.11mi |
| 13884 Euclid St Garden Grove, CA | 2.0–3.0 | 1.5 | 980 | $2,965 | $3.03 | 3d | 4 | 1.11mi |
| 11655 Trask Ave Unit 6 Garden Grove, CA | 2.0 | 2.0 | 950 | $2,800 | $2.95 | 44d | 1 | 1.20mi |
| 11655 Trask Ave Unit 3 Garden Grove, CA | 2.0 | 2.0 | 950 | $2,750 | $2.89 | 44d | 1 | 1.20mi |
| 12562 Cardinal Ave Unit B Garden Grove, CA | 3.0 | 1.0 | 1100 | $2,800 | $2.55 | 44d | 1 | 1.29mi |
| 1806 N Fairview St Unit Q Santa Ana, CA | 1.0 | 1.0 | 693 | $2,526 | $3.65 | 25d | 1 | 1.36mi |
| 10500 Westminster Ave Unit 37 Garden Grove, CA | 1.0 | 1.0 | 756 | $1,850 | $2.45 | 8d | 1 | 1.46mi |
| 10500 Westminster Ave Apt 4 Garden Grove, CA | 1.0 | 1.0 | 768 | $1,895 | $2.47 | 44d | 1 | 1.46mi |
| 10500 Westminster Ave Garden Grove, CA | 1.0–3.0 | 1.0–2.0 | 1001 | $2,525 | $2.52 | 16d | 5 | 1.48mi |
| 10500 Westminster Ave Unit 11 Garden Grove, CA | 1.0 | 1.0 | 756 | $1,950 | $2.58 | 8d | 1 | 1.48mi |
| 10500 Westminster Ave Unit 9 Garden Grove, CA | 2.0 | 1.0 | 992 | $2,595 | $2.62 | 5d | 1 | 1.48mi |
Listing history 11 events
-
2026-06-21days on market $159,950 Active 15 DOM
-
2026-06-18days on market $159,950 Active 12 DOM
-
2026-06-17days on market $159,950 Active 11 DOM
-
2026-06-16days on market $159,950 Active 10 DOM
-
2026-06-15days on market $159,950 Active 9 DOM
-
2026-06-13days on market $159,950 Active 7 DOM
-
2026-06-13days on market $159,950 Active 6 DOM
-
2026-06-09days on market $159,950 Active 3 DOM
-
2026-06-08days on market $159,950 Active 2 DOM
-
2026-06-07remarks 619-char remark
-
2026-06-07$159,950 Active 1 DOM
ⓘ Source: listings_history table (triggers on properties + properties_extension) + one-shot
backfill from property_details.listing_events for pre-trigger history.
Climate risk First Street
- Flood 2/10 Low FEMA zone A · 5% chance over 30 yrs
- Wildfire 1/10 Low
- Heat 5/10 Major 7 d/yr ≥89°F today · 23 d/yr by 30 yrs out
- Wind 1/10 Low
- Air quality 4/10 Moderate 5 unhealthy d/yr today · 5 by 30 yrs out
Nearby sold comps map
Loading sold comps map…
Walkable amenities ~0.75 mi
Loading nearby amenities…
Taxation est. · year 1
- Rental income
- $31,293
- − Mortgage interest
- −$8,960
- − Property taxes
- −$2,399
- − Insurance
- −$2,302
- − Repairs & maintenance
- −$2,503
- − Management
- −$2,503
- − Depreciation
- −$4,653
- Taxable income
- $7,972
- Est. tax owed @ 24.0%
- −$1,913
- After-tax cash flow
- $8,041/yr
For passive investors: Depreciation is non-cash, so a rental often shows a tax loss while cash-flowing — sheltering income. Rental losses are passive: they offset passive income freely, and up to $25,000/yr can offset ordinary (W-2) income if you actively participate and your MAGI is under $100k (phasing out to $0 by $150k); unused losses carry forward. On sale, claimed depreciation is recaptured at up to 25%, and gains may owe capital-gains tax (a 1031 exchange can defer both). Figures are a year-1 estimate at your 24.0% rate — not tax advice; consult a CPA.
Schools (NCES district)
- District
- Garden Grove Unified
- NCES district ID
- 0614880
- Math proficiency
- 38% ▼ -14.00%
- Reading proficiency
- 65% ▲ 4.00%
- Median HH income
- $60,089
- Composite
- 44.89/100
- National rank
- #2715
- State rank
- #132 of 517 in CA
Livability — Santa Ana
- Score
- 55/100
- State rank
- #871
- US rank
- #23502
Category grades
Schools grade is shown separately in the Schools card above.
Census & demographics
- Census place
- Santa Ana, CA
- County
- Orange County · 3,096,323 people
- City population
- 288,255
- Metro
- Los Angeles-Long Beach-Anaheim, CA
- Population (ZIP)
- 62,447
- Household income
- $84,437
- Rent vs Own
- Severe rent burden
- 1835.0
Population outlook (Orange County) Hauer SSP2
- Today (2025)
- 3,477,456 people
- By 2030
- 3,613,117 · +3.9%
- By 2040
- 3,835,945 · +10.3%
- By 2050
- 3,968,736 · +14.1%
- By 2075
- 4,097,053 · +17.8%
- By 2100
- 3,903,633 · +12.3%
Race, ethnicity, and origin ACS 2023
- Neighborhood character
- Predominantly Hispanic (77%)
- Race & ethnicity
- Hispanic / Latino 77% Two or more races 19% Asian 16% White 5% Native American 2%
- Hispanic origin (detail)
- Mexican 72%
- Common ancestry
- Iranian 1%
- Foreign-born
- 47% · Canada, Vietnam, China
- Languages at home
- 17% English-only · Spanish 68% Vietnamese 13% Other Asian/Pacific 1%
Political lean MEDSL · Orange
- 2024 margin
- Toss-up / Even · D 49.7% · R 47.1% · Other 3.2%
- 2008→2024 swing
- +5.2pp toward D · 2008: -2.6pp · 2024: 2.6pp
- All cycles
- 2024: D+2.6 2020: D+9.0 2016: D+7.7 2012: R+8.3 2008: R+2.6
Not yet ingested
- Civics
- —
Market trends
- HPI YoY
- ▼ -666.61%
- Current HPI
- 458.1824
- Rent YoY
- —
- Metro
- Los Angeles-Long Beach-Anaheim, CA
- State GDP YoY
- ▲ 3.21%
- F500 in state
- 116
Industry mix (Fortune 500 HQ in CA)
| Industry | F500 HQs | Revenue |
|---|---|---|
| Technology | 27 | $1,492B |
|
||
| Financial Services | 3 | $174B |
|
||
| Retail | 3 | $44B |
|
||
| Insurance | 3 | $26B |
|
||
| Media / Entertainment | 2 | $115B |
|
||
| Pharmaceuticals / Biotech | 2 | $62B |
|
||
Price history
+102.5% since first listed11 events — show timeline
- 2026-06-06 Listed $159,950 CRMLS
- 2026-04-22 Listing Removed — CRMLS
- 2026-04-20 Relisted — CRMLS
- 2026-03-05 Listed $159,950 CRMLS
- 2026-02-28 Listing Removed — CRMLS
- 2025-10-10 Price Changed $162,000 CRMLS
- 2025-06-10 Price Changed $165,000 CRMLS
- 2025-05-14 Listed $170,000 CRMLS
- 2021-06-17 Sold (MLS) $85,000 CRMLS
- 2021-06-01 Pending — CRMLS
- 2021-05-20 Listed $79,000 CRMLS
Property tax history
-0.1%/yrLatest (2021): $49 · +0.2% YoY. Source: county tax records.
Cash-flow waterfall
monthlySold comps — $/sqft
last 12 mo · ≤1 miLoading sold comps…