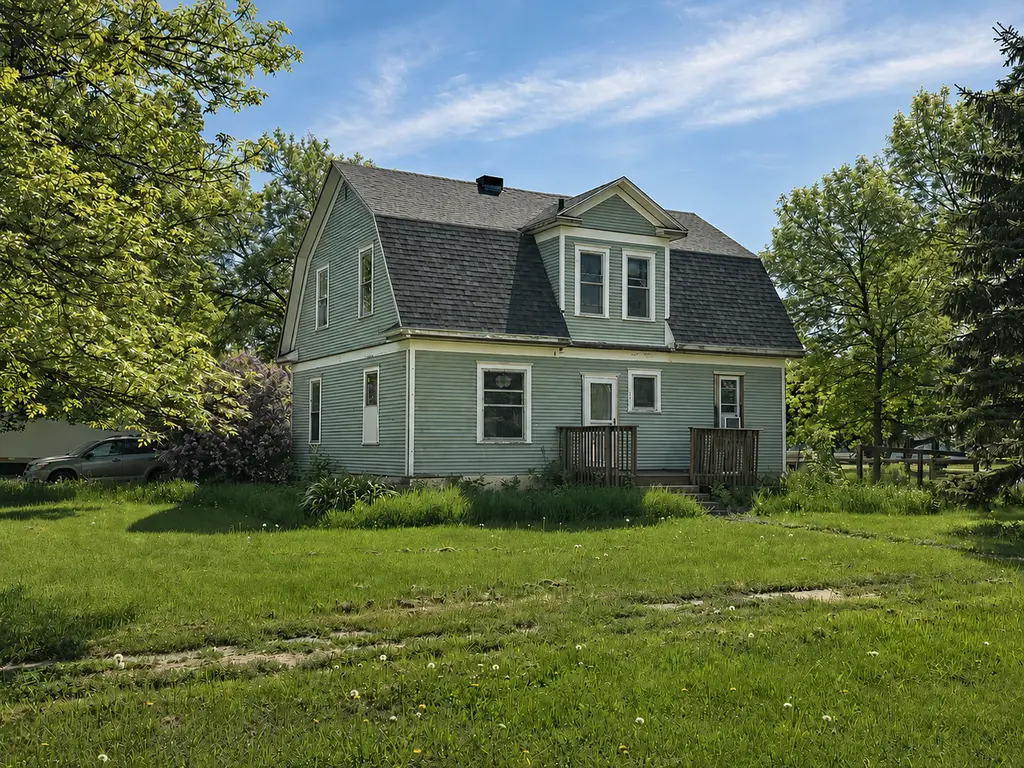
210 Glasgow Ave · Donnelly, MN
Flood risk No data
- FEMA flood zone
- —
- Chance of flooding over 30 yrs
- —
- Est. flood insurance / yr
- —
Fire risk No data
- Est. fire insurance / yr
- —
Heat risk No data
- Hot days now (above threshold)
- —
- Hot days in 30 yrs
- —
Wind risk No data
- Chance of severe wind over 30 yrs
- —
Air-quality risk No data
- Unhealthy air days now
- —
- Unhealthy air days in 30 yrs
- —
Risk factors via First Street. Map © Google.
Why this score? — see what drove the B+ grade
The composite is a weighted blend of 9 inputs, each scored 0–100. Each bar is that input's sub-score; the figure is the points it added to the 100-point composite (weight × sub-score).
- Cash flow +30.0/30.0
- 1% rule +10.0/10.0
- DSCR +10.0/10.0
- ARV discount +7.5/15.0
- Appreciation +5.0/10.0
- Schools +5.0/10.0
- Livability +3.4/5.0
- Rent growth +2.5/5.0
- Condition / age +2.5/5.0
$55,000
🖨 Deal sheet 📄 Offer letter ✓ Due diligence
Listing remarks
Large nearly . 75 acre corner lot features 1800 sq. ft 3 bedroom/1 bath house. Bring your toolbox and ideas and make this into your dream home. 2 BR on the second floor and a room that could become a second full bath. Newer furnace, water heater and water softener. Several outbuildings for added storage and a gazebo for relaxing. Plenty of room to build an additional garage, gardens, etc. Partial fenced yard area for pets.
Key facts
- 0.64 acre lot
- Garage
- Built 1900
Property features AI
Finance
- Financial info: Property type: Residential
Exterior
- Parking: Gravel parking; 1-car garage (approx. 18 x 14)
- Utilities: City water connected; City sewer connected (also holding tank); Propane fuel; 100 amp electrical service with circuit breakers
- Home design: Residential property; Two stories; Corner lot
- Construction: Built on poured concrete and stone foundation; Foundation dimensions: 38 x 28 and 10 x 18
- Exterior features: Wood exterior; Partial fencing; Gazebo; Storage shed; Detached garage
Interior
- Bedrooms: 3 bedrooms
- Bathrooms: 1 full bathroom on the main floor
- Heating & cooling: Forced air heating; Window air conditioning units
- Interior features: Separate formal dining room; Unfinished basement with sump pump
- Laundry & utility: Main level laundry
Neighborhood map
What this means for you Summary
Snapshot
- This is a 3-bed/1.0-bath other listed at $55k.
Deal economics
- At list price, monthly cash flow is $690 ($8k/yr) — positive.
- The deal already cash-flows at list — no discount required.
- Meets the 1% rule at list price ($1k rent vs $55k).
- Recommended offer: $54k (1.5% below list) — sets the bar for market timing.
Location & tenants
- Location reads 68/100 on livability (#386 in MN) — a middle-class / working-renter tenant base. Strengths: employment A+, cost of living A+, housing A+; Watch: crime C-, health & safety C-, schools D-.
- Market conditions: 6 active listings in the ZIP; 5 units permitted in Stevens County in 2024 (0 in 5+ unit buildings).
Forward outlook
- In year one you build about $2k of equity ($380 loan paydown + $2k appreciation (3.0% local appreciation)).
- Stevens County population projected at +7% by 2050 — modest demand growth; plan on rents tracking national, not racing it.
- At projected returns (3.0% appreciation + 3.0% rent growth), your $15k cash investment doubles in ~2 years — after that, you're playing with house money.
Negotiation context
- It's been on market 22 days — a 2% lower offer ($54k) is reasonable based on typical stale-listing flexibility.
Risks & watch-outs
- Watch-outs: built in 1900 — expect roof / HVAC / electrical / plumbing capex.
Questions for the listing agent
- Built in 1900 — when were the roof, HVAC, electrical panel, plumbing, and water heater last replaced?
- Is there a deadline driving the sale (1031 exchange, divorce, estate, relocation)? That informs how much negotiation room exists.
- Schools are D-rated, which usually means shorter tenancies and higher turnover. Who's the typical renter profile here, and what's been the actual vacancy rate?
- What's the average days-on-market for RENTAL listings here right now (not sales)? A rising rental-DOM trend means longer vacancies and softer asking-rent achievability than the comps imply.
- What's the recent tenant-quality profile in this submarket — average credit score on applications, eviction rate, late-payment / NSF rate, and stable-employment percentage? A property-management company in the area should have these aggregated.
- How much new for-sale + rental construction is in the pipeline within 1–3 miles? Heavy new supply typically softens prices + rents 12–24 months out; constrained supply supports both.
Investment metrics
- 1% rule
- 2.43% ✓
- Cap rate
- 21.35%
- Cash-on-cash
- 53.76%
- DSCR
- 3.39
- GRM
- 3.4
CMA / ARV
No comps found within radius.
Projected returns pro-forma
3.0% appreciation · 3.0% rent growth · sell at horizon
- IRR
- 58.8%
- Equity multiple
- 4.28×
- Total profit
- $50,580
- Equity at exit
- $24,730
- IRR
- 58.4%
- Equity multiple
- 8.69×
- Total profit
- $118,497
- Equity at exit
- $38,112
Cash invested: $15,400 (down + closing). Projections, not guarantees.
Landlord ↔ Tenant lean methodology
- Overall (STATE)
- 46 Balanced
- State Minnesota
- 46 Balanced · D+2
- County
- — inherits STATE
- City
- — inherits STATE
ZIP-level market 56235
- Active inventory
- 6
- Price-to-rent
- 3.4×
Monthly cashflow live
- Estimated rent
- $1,335 medium interval (Pro) →
- Mortgage (P&I)
- −$288
- Tax from tax record
- −$53 /mo · $636/yr
- Insurance
- −$23
- HOA
- −$0
- Vacancy / Maint / Mgmt
- −$280
- Net cashflow
- $690
Break-even live
UW: 25.0% down · 7.5% · 30yr · 1.5% tax · 5.0% vac · 8.0% maint · 8.0% mgmt
Financing live
Cash to close
- Down payment
- $13,750
- Closing costs
- $1,650
- Reserves months
- —
- Total cash needed
- —
Loan-product check · same deal, 3 products live
Conventional
25% down · 7.5% · 30yr
- Down + closing
- —
- Monthly P&I
- —
- Monthly cashflow
- —
- DSCR
- —
- Eligible?
- —
Personal DTI + credit; lowest rate.
DSCR
20% down · 8.5% · 30yr
- Down + closing
- —
- Monthly P&I
- —
- Monthly cashflow
- —
- DSCR
- —
- Eligible?
- —
No personal income docs; deal must DSCR.
Hard money
10% down · 12.0% · 12mo
- Down + closing
- —
- Monthly P&I
- —
- Monthly cashflow
- —
- DSCR
- —
- Eligible?
- —
Short-term bridge; refi at stabilization.
Listing history 17 events
-
2026-06-18days on market $55,000 Active 22 DOM
-
2026-06-17days on market $55,000 Active 21 DOM
-
2026-06-16days on market $55,000 Active 20 DOM
-
2026-06-15days on market $55,000 Active 19 DOM
-
2026-06-13days on market $55,000 Active 17 DOM
-
2026-06-12days on market $55,000 Active 16 DOM
-
2026-06-09days on market $55,000 Active 13 DOM
-
2026-06-08days on market $55,000 Active 12 DOM
-
2026-06-07days on market $55,000 Active 11 DOM
-
2026-06-07days on market $55,000 Active 10 DOM
-
2026-06-04days on market $55,000 Active 7 DOM
-
2026-06-02days on market $55,000 Active 6 DOM
-
2026-06-01days on market $55,000 Active 5 DOM
-
2026-05-31days on market $55,000 Active 4 DOM
-
2026-05-31days on market $55,000 Active 3 DOM
-
2026-05-27$55,000 Active
-
2024-08-15soldstatus $55,000
ⓘ Source: listings_history table (triggers on properties + properties_extension) + one-shot
backfill from property_details.listing_events for pre-trigger history.
Tax reassessment forecast MN · Partial reset (capped growth)
- Current annual tax
- $636 · $53/mo
- Projected year-2 tax
- $636 · $53/mo
- Expected delta
- $0/yr ($0/mo · 0.0%)
ⓘ Screening estimate from a state-policy table — verify with the county assessor before closing.
Nearby sold comps map
Loading sold comps map…
Walkable amenities ~0.75 mi
Loading nearby amenities…
Taxation est. · year 1
- Rental income
- $16,015
- − Mortgage interest
- −$3,081
- − Property taxes
- −$636
- − Insurance
- −$275
- − Repairs & maintenance
- −$1,281
- − Management
- −$1,281
- − Depreciation
- −$1,600
- Taxable income
- $7,861
- Est. tax owed @ 24.0%
- −$1,887
- After-tax cash flow
- $6,393/yr
For passive investors: Depreciation is non-cash, so a rental often shows a tax loss while cash-flowing — sheltering income. Rental losses are passive: they offset passive income freely, and up to $25,000/yr can offset ordinary (W-2) income if you actively participate and your MAGI is under $100k (phasing out to $0 by $150k); unused losses carry forward. On sale, claimed depreciation is recaptured at up to 25%, and gains may owe capital-gains tax (a 1031 exchange can defer both). Figures are a year-1 estimate at your 24.0% rate — not tax advice; consult a CPA.
Schools (NCES district)
No district data.
Livability — Donnelly
- Score
- 68/100
- State rank
- #386
- US rank
- #9168
Category grades
Schools grade is shown separately in the Schools card above.
Census & demographics
- Census place
- Donnelly, MN
- Population (ZIP)
- 486
Population outlook (Stevens County) Hauer SSP2
- Today (2025)
- 9,907 people
- By 2030
- 9,987 · +0.8%
- By 2040
- 10,214 · +3.1%
- By 2050
- 10,642 · +7.4%
- By 2075
- 12,546 · +26.6%
- By 2100
- 14,065 · +42.0%
Race, ethnicity, and origin ACS 2023
- Neighborhood character
- Predominantly White (99%)
- Race & ethnicity
- White 99% Two or more races 1%
- Common ancestry
- Portuguese 26% Romanian 6% Scottish 4%
- Foreign-born
- 0%
- Languages at home
- 97% English-only · Spanish 3%
Political lean MEDSL · Stevens
- 2024 margin
- Strong R (+27.1) · D 35.7% · R 62.7% · Other 1.6%
- 2008→2024 swing
- -28.3pp toward R · 2008: 1.3pp · 2024: -27.1pp
- All cycles
- 2024: R+27.1 2020: R+22.1 2016: R+12.8 2012: R+0.4 2008: D+1.3
Not yet ingested
- Civics
- —
Market trends
- HPI YoY
- —
- Current HPI
- —
- Rent YoY
- —
- Metro
- —
- State GDP YoY
- ▲ 2.41%
- F500 in state
- 34
Industry mix (Fortune 500 HQ in MN)
| Industry | F500 HQs | Revenue |
|---|---|---|
| Healthcare | 2 | $407B |
|
||
| Retail | 2 | $150B |
|
||
| Consumer Goods | 2 | $32B |
|
||
| Industrial Machinery | 2 | $6B |
|
||
| Agriculture | 1 | $40B |
|
||
| Healthcare / Medical Devices | 1 | $32B |
|
||
Price history
+0.0% since first listed2 events — show timeline
- 2026-05-27 Listed $55,000 NORTHSTARMLS as Distributed by MLS Grid
- 2024-08-15 Sold (Public Records) $55,000 Public Records
Property tax history
-1.4%/yrLatest (2026): $636 · +52.2% YoY. Source: county tax records.
Cash-flow waterfall
monthlySold comps — $/sqft
last 12 mo · ≤1 miLoading sold comps…