650 S Topaz Trl · Prescott, AZ
Flood risk 1/10 · Minimal
- FEMA flood zone
- X (unshaded)
- Chance of flooding over 30 yrs
- 0.0%
- Est. flood insurance / yr
- $507 – $1,088
Fire risk 6/10 · Moderate
- Est. fire insurance / yr
- $610 – $1,132
Heat risk 3/10 · Minor
- Hot days now (above 89°F)
- 4 days/yr
- Hot days in 30 yrs
- 10 days/yr
Wind risk 1/10 · Minimal
- Chance of severe wind over 30 yrs
- —
Air-quality risk 2/10 · Minimal
- Unhealthy air days now
- 1 days/yr
- Unhealthy air days in 30 yrs
- 1 days/yr
Risk factors via First Street. Map © Google.
Why this score? — see what drove the B- grade
The composite is a weighted blend of 9 inputs, each scored 0–100. Each bar is that input's sub-score; the figure is the points it added to the 100-point composite (weight × sub-score).
- Cash flow +30.0/30.0
- 1% rule +10.0/10.0
- DSCR +10.0/10.0
- ARV discount +7.5/15.0
- Livability +3.7/5.0
- Schools +3.3/10.0
- Rent growth +2.6/5.0
- Condition / age +2.5/5.0
- Appreciation +0.0/10.0
$80,000
🖨 Deal sheet (PDF) 📄 Offer letter ✓ Due diligence
Listing remarks
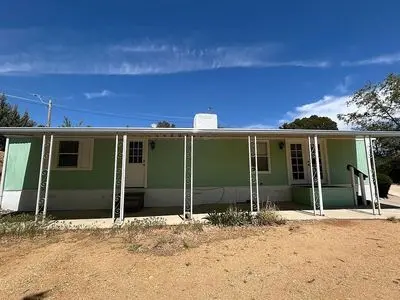
Rare Prescott Opportunity & acirc; & euro; & ldquo; Own the Land + Views Tucked away in a quiet Prescott neighborhood, this 1 bed + den home offers a rare chance to own land with beautiful views and strong potential. BRAND NEW ROOF! What makes this one stand out: you own the land (no park, no land lease) in a peaceful setting at a hard-to-find price point. Approx. 600 sq ft with a functional layout, this property is ideal for an investor, remodeler, or buyer looking for a project or quiet retreat. Complete with an outdoor workshop/storage. All-cash sale due to the age and condition of the manufactured home (year unknown, to be provided). Estate sale & acirc; & euro; &
Key facts
- Brand new roof
- Outdoor workshop
- Built 1973
Tags
Neighborhood map
What this means for you Summary
Snapshot
- This is a 2-bed/1.0-bath manufactured listed at $80k.
Deal economics
- At list price, monthly cash flow is $652 ($8k/yr) — positive.
- The deal already cash-flows at list — no discount required.
- Meets the 1% rule at list price ($1k rent vs $80k).
- Recommended offer: $78k (3.0% below list) — sets the bar for market timing.
- Cap rate 16.1% vs local median 2.4% in Prescott — top-decile yield for the area; either an underpriced asset or a hidden risk that comps aren't pricing in. Stress-test before assuming the spread holds.
Location & tenants
- Location reads 73/100 on livability (#22 in AZ) — a middle-class / working-renter tenant base. Strengths: health & safety A+, amenities A, schools A-; Watch: cost of living D, commute F.
- Prescott Unified District (4466) (urban): math 34% / reading 44% proficiency, ranked #70 of 249 in AZ (top 28%) — families likely to look elsewhere, expect single-tenant / working-renter base with shorter leases.
- Market conditions: Rents flat; 520 active listings in the ZIP; 10 comparable units currently listed for rent nearby; rentals lingering (median 45d on market — plan ~5-8 weeks vacancy on turnover, expect pricing pressure); 50% of comp listings sitting > 30 days — soft ceiling on asking rent; 2,062 units permitted in Yavapai County in 2024 (98 in 5+ unit buildings).
Forward outlook
- Local home prices are declining (-3.0%/yr); year-one equity from $553 of loan paydown is wiped out by about $2k of value loss. Plan a longer hold.
- Yavapai County population projected at +10% by 2050 — modest demand growth; plan on rents tracking national, not racing it.
- At projected returns (-3.0% appreciation + 0.5% rent growth), your $22k cash investment doubles in ~4 years — after that, you're playing with house money.
Negotiation context
- It's been on market 40 days — a 3% lower offer ($78k) is reasonable based on typical stale-listing flexibility.
- Current owner paid $30k; list at $80k implies a 167% gain — meaningful room to come down on a strong offer.
Risks & watch-outs
- Climate carrying-cost: major wildfire risk — expect insurance premiums to compound above CPI over the hold.
Questions for the listing agent
- It's been on market 40 days. Have you received any prior offers? Is the seller open to a 3% concession, seller financing, or rate buy-down credit?
- Built in 1973 — when were the roof, HVAC, electrical panel, plumbing, and water heater last replaced?
- Is there a deadline driving the sale (1031 exchange, divorce, estate, relocation)? That informs how much negotiation room exists.
- Schools are A-rated — typically a magnet for longer-tenancy family renters. What's the average tenant stay here, and is there a school-zone premium baked into asking?
- What's the average days-on-market for RENTAL listings here right now (not sales)? A rising rental-DOM trend means longer vacancies and softer asking-rent achievability than the comps imply.
- What's the recent tenant-quality profile in this submarket — average credit score on applications, eviction rate, late-payment / NSF rate, and stable-employment percentage? A property-management company in the area should have these aggregated.
- How much new for-sale + rental construction is in the pipeline within 1–3 miles? Heavy new supply typically softens prices + rents 12–24 months out; constrained supply supports both.
Investment metrics
- 1% rule
- 1.78% ✓
- Cap rate
- 16.07%
- Cash-on-cash
- 34.91%
- DSCR
- 2.55
- GRM
- 4.7
CMA / ARV
- ARV (on-the-fly)
- $194,400
- Comps found
- 1
Show comp detail 1 sale within ~0.75 mi
| Address | Dist | Beds/Ba | Sqft | Sold | Price | $/sf | Match |
|---|---|---|---|---|---|---|---|
| 535 S Emerald Trl | 0.12mi | 2/1.0 | 685 (+14%) | 19mo | $222,000 | $324 | 55 |
Match score weights: distance 35% · size 25% · config 20% · recency 20%. Top-matched comps best support the ARV.
Projected returns pro-forma
-3.0% appreciation · 0.51% rent growth · sell at horizon
- IRR
- 27.7%
- Equity multiple
- 2.12×
- Total profit
- $25,040
- Equity at exit
- $11,928
- IRR
- 33.8%
- Equity multiple
- 3.75×
- Total profit
- $61,567
- Equity at exit
- $6,917
Cash invested: $22,400 (down + closing). Projections, not guarantees.
Landlord ↔ Tenant lean methodology
- Overall (STATE)
- 87 Strongly Landlord-Friendly
- State Arizona
- 87 Strongly Landlord-Friendly · R+3
- County
- — inherits STATE
- City
- — inherits STATE
ZIP-level market 86303
- Home prices YoY
- -28.9%
- Rents YoY
- 0.5%
- Active inventory
- 520
- Price-to-rent
- 4.7×
Monthly cashflow live
- Estimated rent
- $1,422 high interval (Pro) →
- Mortgage (P&I)
- −$420
- Tax from tax record
- −$19 /mo · $224/yr
- Insurance
- −$33
- HOA
- −$0
- Vacancy / Maint / Mgmt
- −$299
- Net cashflow
- $652
Break-even live
Sensitivity live
| Price | -10% $697 | -5% $674 | +0% $652 | +5% $629 | +10% $606 |
|---|---|---|---|---|---|
| Rent | -10% $539 | -5% $596 | +0% $652 | +5% $708 | +10% $764 |
| Rate | -1.0pp $692 | -0.5pp $672 | base $652 | +0.5pp $631 | +1.0pp $610 |
UW: 25.0% down · 7.5% · 30yr · 1.5% tax · 5.0% vac · 8.0% maint · 8.0% mgmt
Financing live
Cash to close
- Down payment
- $20,000
- Closing costs
- $2,400
- Reserves months
- —
- Total cash needed
- —
Loan-product check · same deal, 3 products live
Conventional
25% down · 7.5% · 30yr
- Down + closing
- —
- Monthly P&I
- —
- Monthly cashflow
- —
- DSCR
- —
- Eligible?
- —
Personal DTI + credit; lowest rate.
DSCR
20% down · 8.5% · 30yr
- Down + closing
- —
- Monthly P&I
- —
- Monthly cashflow
- —
- DSCR
- —
- Eligible?
- —
No personal income docs; deal must DSCR.
Hard money
10% down · 12.0% · 12mo
- Down + closing
- —
- Monthly P&I
- —
- Monthly cashflow
- —
- DSCR
- —
- Eligible?
- —
Short-term bridge; refi at stabilization.
Rent comps 10 comps
| Address | Beds | Baths | Sqft | Rent | $/sqft | DOM | Units | Dist |
|---|---|---|---|---|---|---|---|---|
| 135 S Arizona Ave Unit 1/2 Prescott, AZ | 1.0 | 1.0 | 550 | $1,600 | $2.91 | 45d | 1 | 0.94mi |
| 314 S Virginia St #2 Prescott, AZ | 1.0 | 1.0 | 700 | $950 | $1.36 | 45d | 1 | 1.10mi |
| 606 E Willis St Prescott, AZ | 1.0 | 1.0 | 604 | $1,225 | $2.03 | 22d | 1 | 1.13mi |
| 403 S Pleasant St Prescott, AZ | 1.0 | 1.0 | 750 | $1,475 | $1.97 | 45d | 1 | 1.22mi |
| 109 N Pleasant St Unit C Prescott, AZ | 1.0 | 1.0 | 750 | $1,395 | $1.86 | 45d | 1 | 1.25mi |
| 123 N Cortez St Unit 223 Prescott, AZ | 1.0 | 1.0 | 650 | $1,295 | $1.99 | 22d | 1 | 1.49mi |
| 123 N Cortez St Unit 222 Prescott, AZ | 1.0 | 1.0 | 385 | $1,145 | $2.97 | 22d | 1 | 1.49mi |
| 129 N Cortez St Prescott, AZ | 1.0 | 1.0 | 292 | $1,225 | $4.19 | 45d | 3 | 1.49mi |
| 129 N Cortez St Unit 223 Prescott, AZ | 1.0 | 1.0 | 650 | $1,295 | $1.99 | 22d | 1 | 1.49mi |
| 129 N Cortez St Unit 222 Prescott, AZ | 1.0 | 1.0 | 385 | $1,195 | $3.10 | 22d | 1 | 1.49mi |
Listing history 18 events
-
2026-06-21days on market $80,000 Active 40 DOM
-
2026-06-18days on market $80,000 Active 37 DOM
-
2026-06-17days on market $80,000 Active 36 DOM
-
2026-06-16days on market $80,000 Active 35 DOM
-
2026-06-15days on market $80,000 Active 34 DOM
-
2026-06-14days on market $80,000 Active 32 DOM
-
2026-06-13days on market $80,000 Active 31 DOM
-
2026-06-10days on market $80,000 Active 29 DOM
-
2026-06-09days on market $80,000 Active 28 DOM
-
2026-06-08days on market $80,000 Active 27 DOM
-
2026-06-07days on market $80,000 Active 26 DOM
-
2026-06-05days on market $80,000 Active 23 DOM
-
2026-06-02days on market $80,000 Active 21 DOM
-
2026-06-01days on market $80,000 Active 20 DOM
-
2026-05-31days on market $80,000 Active 19 DOM
-
2026-05-30days on market $80,000 Active 18 DOM
-
2026-05-12$80,000 Active 874-char remark
-
1981-09-21soldstatus $30,000
ⓘ Source: listings_history table (triggers on properties + properties_extension) + one-shot
backfill from property_details.listing_events for pre-trigger history.
Tax reassessment forecast AZ · Resets to sale price
- Current annual tax
- $224 · $19/mo
- Projected year-2 tax
- $528 · $44/mo
- Expected delta
- +$304/yr (+$25/mo · 135.7%)
ⓘ Screening estimate from a state-policy table — verify with the county assessor before closing.
Climate risk First Street
- Flood 1/10 Low FEMA zone X (unshaded) · 0% chance over 30 yrs
- Wildfire 6/10 Major
- Heat 3/10 Moderate 4 d/yr ≥89°F today · 10 d/yr by 30 yrs out
- Wind 1/10 Low
- Air quality 2/10 Low 1 unhealthy d/yr today · 1 by 30 yrs out
Nearby sold comps map
Loading sold comps map…
Walkable amenities ~0.75 mi
Loading nearby amenities…
Taxation est. · year 1
- Rental income
- $17,062
- − Mortgage interest
- −$4,481
- − Property taxes
- −$224
- − Insurance
- −$400
- − Repairs & maintenance
- −$1,365
- − Management
- −$1,365
- − Depreciation
- −$2,327
- Taxable income
- $6,899
- Est. tax owed @ 24.0%
- −$1,656
- After-tax cash flow
- $6,165/yr
For passive investors: Depreciation is non-cash, so a rental often shows a tax loss while cash-flowing — sheltering income. Rental losses are passive: they offset passive income freely, and up to $25,000/yr can offset ordinary (W-2) income if you actively participate and your MAGI is under $100k (phasing out to $0 by $150k); unused losses carry forward. On sale, claimed depreciation is recaptured at up to 25%, and gains may owe capital-gains tax (a 1031 exchange can defer both). Figures are a year-1 estimate at your 24.0% rate — not tax advice; consult a CPA.
Schools (NCES district)
- District
- Prescott Unified District (4466)
- NCES district ID
- 0406730
- Math proficiency
- 34% ▼ -16.00%
- Reading proficiency
- 44% ▼ -13.00%
- Median HH income
- $48,354
- Composite
- 33.47/100
- National rank
- #5450
- State rank
- #70 of 249 in AZ
Livability — Prescott
- Score
- 73/100
- State rank
- #22
- US rank
- #5579
Category grades
Schools grade is shown separately in the Schools card above.
Census & demographics
- County
- Yavapai County · 190,406 people
- City population
- 66,312
- Metro
- Prescott Valley-Prescott, AZ
- Population (ZIP)
- 19,446
- Household income
- $72,359
- Rent vs Own
- Severe rent burden
- 763.0
Population outlook (Yavapai County) Hauer SSP2
- Today (2025)
- 241,389 people
- By 2030
- 249,523 · +3.4%
- By 2040
- 259,966 · +7.7%
- By 2050
- 264,736 · +9.7%
- By 2075
- 269,334 · +11.6%
- By 2100
- 256,505 · +6.3%
Race, ethnicity, and origin ACS 2023
- Neighborhood character
- Predominantly White (84%)
- Race & ethnicity
- White 84% Hispanic / Latino 11% Two or more races 6%
- Hispanic origin (detail)
- Mexican 9%
- Common ancestry
- Romanian 5% Lithuanian 4% Slovak 3%
- Foreign-born
- 4% · Canada
- Languages at home
- 94% English-only · Spanish 4% Other Indo-European 1%
Political lean MEDSL · Yavapai
- 2024 margin
- Solid R (+33.9) · D 32.6% · R 66.5%
- 2008→2024 swing
- -9.5pp toward R · 2008: -24.4pp · 2024: -33.9pp
- All cycles
- 2024: R+33.9 2020: R+29.3 2016: R+31.4 2012: R+30.7 2008: R+24.4
Not yet ingested
- Civics
- —
Market trends
- HPI YoY
- ▼ -131.63%
- Current HPI
- 323.9554
- Rent YoY
- ▲ 0.51%
- Metro
- Prescott Valley-Prescott, AZ
- State GDP YoY
- ▲ 4.54%
- F500 in state
- 20
Industry mix (Fortune 500 HQ in AZ)
| Industry | F500 HQs | Revenue |
|---|---|---|
| Technology | 2 | $13B |
|
||
| Mining / Metals | 1 | $23B |
|
||
| Environmental Services | 1 | $16B |
|
||
| Metals / Steel | 1 | $14B |
|
||
| Technology Distribution | 1 | $9B |
|
||
| Homebuilding | 1 | $8B |
|
||
Price history
+166.7% since first listed2 events — show timeline
- 2026-05-12 Listed $80,000 FSBO.com
- 1981-09-21 Sold (Public Records) $30,000 Public Records
Property tax history
-1.3%/yrLatest (2019): $224 · -0.1% YoY. Source: county tax records.
Cash-flow waterfall
monthlySold comps — $/sqft
last 12 mo · ≤1 miLoading sold comps…