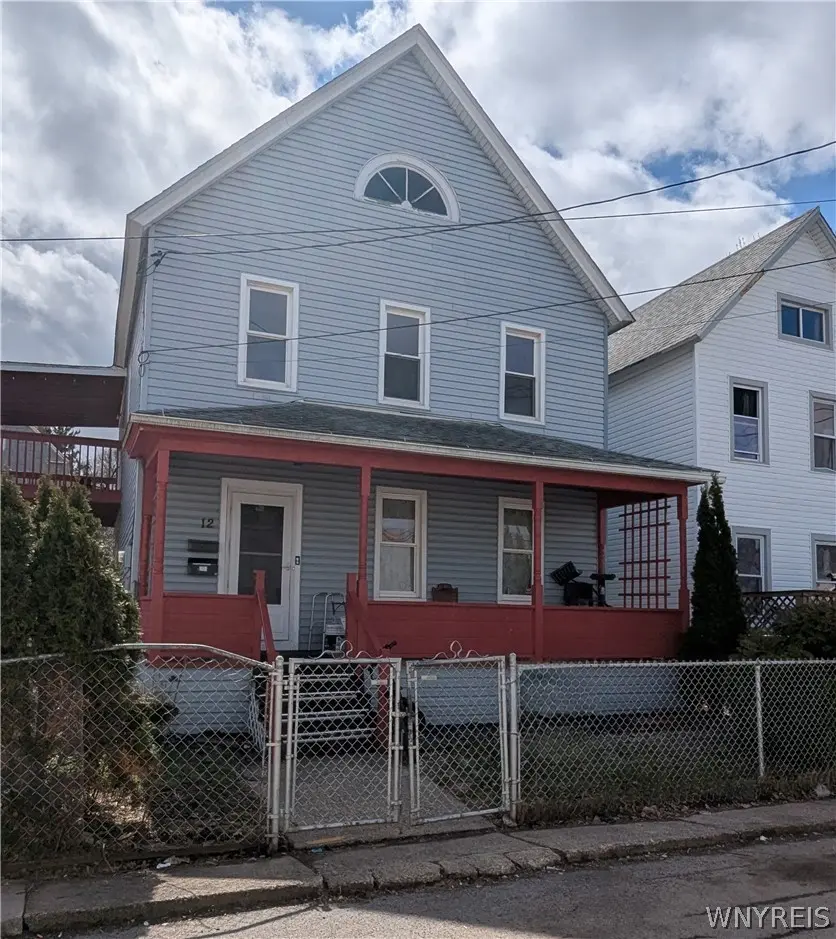
12 Ashley Pl · Lockport, NY
Flood risk 1/10 · Minimal
- FEMA flood zone
- X (unshaded)
- Chance of flooding over 30 yrs
- 0.0%
- Est. flood insurance / yr
- $473 – $860
Fire risk 2/10 · Minimal
- Est. fire insurance / yr
- $691 – $1,283
Heat risk 2/10 · Minimal
- Hot days now (above 95°F)
- 7 days/yr
- Hot days in 30 yrs
- 15 days/yr
Wind risk 1/10 · Minimal
- Chance of severe wind over 30 yrs
- —
Air-quality risk 2/10 · Minimal
- Unhealthy air days now
- 1 days/yr
- Unhealthy air days in 30 yrs
- 2 days/yr
Risk factors via First Street. Map © Google.
Why this score? — see what drove the B grade
The composite is a weighted blend of 9 inputs, each scored 0–100. Each bar is that input's sub-score; the figure is the points it added to the 100-point composite (weight × sub-score).
- Cash flow +30.0/30.0
- DSCR +10.0/10.0
- 1% rule +9.1/10.0
- ARV discount +7.5/15.0
- Schools +3.9/10.0
- Livability +3.8/5.0
- Rent growth +3.4/5.0
- Condition / age +2.5/5.0
- Appreciation +0.0/10.0
$100,000
🖨 Deal sheet 📄 Offer letter ✓ Due diligence
Listing remarks
NEW PRICE. .. So many updates have already been completed for you at 12 Ashley Place in Lockport! This spacious home offers incredible flexibility and room for everyone. Currently being used as a 2 unit with 2 bedrooms full bath, kitchen and living room on the 1st floor. 2nd floor has 3 bdrms, bathroom, kitchen and covered deck for enjoying the city landscape. The driveway with carport has room for 3 cars. Tear off roof, furnace, hot water tank 2020. Replacement windows throughout, full attic, laminate flooring. Would make an excellent in-law setup. Could easily be converted back to a single family. If conventional financing, upper Kitchen can be changed into a 2nd floor laundry room.
Key facts
- Covered deck
- Tear off roof
- Laminate flooring
Tags
Property features AI
Finance
- Other: Lot irregularly shaped; Near public transit; Partial fencing; Lot dimensions approximately 45 x 86
Exterior
- Parking: Carport
- Utilities: Public water (connected); Sewer connected; Circuit breaker electric
- Home design: 2-story home; Resale property
- Construction: Vinyl siding; Copper plumbing; Asphalt roof; Stone foundation; Existing (year built details)
- Exterior features: Blacktop driveway; Balcony; Fence; Covered porch
Interior
- Kitchen: Gas oven; Gas range; Refrigerator; Eat-in kitchen layout; Second kitchen
- Bedrooms: Two main-level bedrooms; In-law suite included
- Flooring: Carpet; Hardwood; Laminate; Varies by room
- Bathrooms: Two full bathrooms; One main-level bathroom
- Heating & cooling: Gas heating; Forced air heating
- Interior features: Entrance foyer; Eat-in kitchen; Separate/formal living room; Second kitchen (in-law setup); In-law floorplan; See remarks
- Laundry & utility: Laundry on main level; Laundry on upper level; Gas water heater
Neighborhood map
What this means for you Summary
Snapshot
- This is a 3-bed/2.0-bath single-family listed at $100k.
Deal economics
- At list price, monthly cash flow is $373 ($4k/yr) — positive.
- The deal already cash-flows at list — no discount required.
- Meets the 1% rule at list price ($1k rent vs $100k).
- Recommended offer: $91k (9.0% below list) — sets the bar for market timing.
- Cap rate 10.8% vs local median 4.5% in Lockport — top-decile yield for the area; either an underpriced asset or a hidden risk that comps aren't pricing in. Stress-test before assuming the spread holds.
Location & tenants
- Location reads 76/100 on livability (#232 in NY, #3,669 nationally) — a middle-class / working-renter tenant base. Strengths: amenities A+, cost of living A+, housing A+; Watch: commute D+, crime F, employment D-.
- Lockport City School District (town): math 44% / reading 49% proficiency, ranked #452 of 590 in NY (top 77%) — families likely to look elsewhere, expect single-tenant / working-renter base with shorter leases.
- Market conditions: Rents rising (+3.7%/yr); 357 active listings in the ZIP; 1 comparable units currently listed for rent nearby; solid renter incomes; 167 units permitted in Niagara County in 2024 (0 in 5+ unit buildings).
Forward outlook
- Local home prices are declining (-3.0%/yr); year-one equity from $691 of loan paydown is wiped out by about $3k of value loss. Plan a longer hold.
- Niagara County population projected at -19% by 2050 — secular population decline; favor cash flow + early exit over multi-decade hold.
- At projected returns (-3.0% appreciation + 3.7% rent growth), your $28k cash investment doubles in ~8 years — after that, you're playing with house money.
Negotiation context
- It's been on market 118 days — a 9% lower offer ($91k) is reasonable based on typical stale-listing flexibility.
Risks & watch-outs
- Watch-outs: built in 1880 — expect roof / HVAC / electrical / plumbing capex.
Questions for the listing agent
- It's been on market 118 days. Have you received any prior offers? Is the seller open to a 9% concession, seller financing, or rate buy-down credit?
- Built in 1880 — when were the roof, HVAC, electrical panel, plumbing, and water heater last replaced?
- Why hasn't it sold? Are there any deal-killer items the seller is aware of (foundation, flood, title, zoning, code violations)?
- Is there a deadline driving the sale (1031 exchange, divorce, estate, relocation)? That informs how much negotiation room exists.
- Schools are B-rated — typically a magnet for longer-tenancy family renters. What's the average tenant stay here, and is there a school-zone premium baked into asking?
- Crime grade is F in this area — have there been break-ins, vandalism, or insurance claims at this property in the last 3 years? What carrier currently insures it and at what premium?
- What's the average days-on-market for RENTAL listings here right now (not sales)? A rising rental-DOM trend means longer vacancies and softer asking-rent achievability than the comps imply.
- What's the recent tenant-quality profile in this submarket — average credit score on applications, eviction rate, late-payment / NSF rate, and stable-employment percentage? A property-management company in the area should have these aggregated.
- How much new for-sale + rental construction is in the pipeline within 1–3 miles? Heavy new supply typically softens prices + rents 12–24 months out; constrained supply supports both.
Investment metrics
- 1% rule
- 1.41% ✓
- Cap rate
- 10.77%
- Cash-on-cash
- 15.97%
- DSCR
- 1.71
- GRM
- 5.9
CMA / ARV
- ARV (on-the-fly)
- $203,904
- Comps found
- 12
Show comp detail 12 sales within ~0.75 mi
| Address | Dist | Beds/Ba | Sqft | Sold | Price | $/sf | Match |
|---|---|---|---|---|---|---|---|
| 8 Blackley Ct | 0.21mi | 3/2.0 | 1,658 (-4%) | 2mo | $135,000 | $81 | 82 |
| 100 Regent St | 0.49mi | 3/2.5 | 1,795 (+4%) | 0mo | $248,000 | $138 | 69 |
| 160 Waterman St | 0.31mi | 4/1.5 (+1) | 1,868 (+8%) | 3mo | $150,000 | $80 | 63 |
| 413 Pine St | 0.59mi | 4/1.5 (+1) | 1,704 (-1%) | 6mo | $275,000 | $161 | 59 |
| 250 Pine St | 0.30mi | 3/1.5 | 1,956 (+13%) | 5mo | $260,000 | $133 | 58 |
| 106 Saxton St | 0.42mi | 3/1.0 | 1,560 (-10%) | 4mo | $75,000 | $48 | 57 |
| 391 Walnut St | 0.44mi | 4/1.0 (+1) | 1,856 (+7%) | 2mo | $180,400 | $97 | 57 |
| 293 Pine St | 0.40mi | 3/2.0 | 1,480 (-14%) | 2mo | $275,000 | $186 | 56 |
| 44 Erie St | 0.39mi | 4/2.0 (+1) | 1,528 (-12%) | 3mo | $180,000 | $118 | 55 |
| 69 Morrow Ave | 0.47mi | 3/1.0 | 1,510 (-13%) | 1mo | $195,000 | $129 | 52 |
| 319 Willow St | 0.50mi | 4/1.0 (+1) | 1,912 (+11%) | 2mo | $200,000 | $105 | 48 |
| 62 Grand St | 0.59mi | 3/1.0 | 1,505 (-13%) | 4mo | $45,000 | $30 | 44 |
Match score weights: distance 35% · size 25% · config 20% · recency 20%. Top-matched comps best support the ARV.
Projected returns pro-forma
-3.0% appreciation · 3.67% rent growth · sell at horizon
- IRR
- 7.7%
- Equity multiple
- 1.31×
- Total profit
- $8,547
- Equity at exit
- $14,910
- IRR
- 17.6%
- Equity multiple
- 2.51×
- Total profit
- $42,214
- Equity at exit
- $8,646
Cash invested: $28,000 (down + closing). Projections, not guarantees.
Landlord ↔ Tenant lean methodology
- Overall (STATE)
- 15 Strongly Tenant-Friendly
- State New York
- 15 Strongly Tenant-Friendly · D+10
- County
- — inherits STATE
- City
- — inherits STATE
ZIP-level market 14094
- Rents YoY
- 3.7%
- Active inventory
- 357
- Price-to-rent
- 5.9×
Monthly cashflow live
- Estimated rent
- $1,412 medium interval (Pro) →
- Mortgage (P&I)
- −$524
- Tax from tax record
- −$177 /mo · $2,124/yr
- Insurance
- −$42
- HOA
- −$0
- Vacancy / Maint / Mgmt
- −$297
- Net cashflow
- $373
Break-even live
UW: 25.0% down · 7.5% · 30yr · 1.5% tax · 5.0% vac · 8.0% maint · 8.0% mgmt
Financing live
Cash to close
- Down payment
- $25,000
- Closing costs
- $3,000
- Reserves months
- —
- Total cash needed
- —
Loan-product check · same deal, 3 products live
Conventional
25% down · 7.5% · 30yr
- Down + closing
- —
- Monthly P&I
- —
- Monthly cashflow
- —
- DSCR
- —
- Eligible?
- —
Personal DTI + credit; lowest rate.
DSCR
20% down · 8.5% · 30yr
- Down + closing
- —
- Monthly P&I
- —
- Monthly cashflow
- —
- DSCR
- —
- Eligible?
- —
No personal income docs; deal must DSCR.
Hard money
10% down · 12.0% · 12mo
- Down + closing
- —
- Monthly P&I
- —
- Monthly cashflow
- —
- DSCR
- —
- Eligible?
- —
Short-term bridge; refi at stabilization.
Rent comps 1 comps
| Address | Beds | Baths | Sqft | Rent | $/sqft | DOM | Units | Dist |
|---|---|---|---|---|---|---|---|---|
| 47 Waterman St Unit 3 Lockport, NY | 2.0 | 1.0 | 1100 | $1,150 | $1.05 | 23d | 1 | 0.13mi |
Listing history 18 events
-
2026-06-18days on market $100,000 Active 118 DOM
-
2026-06-17days on market $100,000 Active 117 DOM
-
2026-06-16days on market $100,000 Active 116 DOM
-
2026-06-15days on market $100,000 Active 115 DOM
-
2026-06-13days on market $100,000 Active 113 DOM
-
2026-06-13days on market $100,000 Active 112 DOM
-
2026-06-10days on market $100,000 Active 110 DOM
-
2026-06-09days on market $100,000 Active 109 DOM
-
2026-06-08days on market $100,000 Active 108 DOM
-
2026-06-07days on market $100,000 Active 107 DOM
-
2026-06-05days on market $100,000 Active 104 DOM
-
2026-06-03days on market $100,000 Active 103 DOM
-
2026-06-02days on market $100,000 Active 102 DOM
-
2026-06-01days on market $100,000 Active 101 DOM
-
2026-05-31days on market $100,000 Active 100 DOM
-
2026-04-21price $100,000
-
2026-03-30price $115,000
-
2026-02-20$125,000 Active
ⓘ Source: listings_history table (triggers on properties + properties_extension) + one-shot
backfill from property_details.listing_events for pre-trigger history.
Tax reassessment forecast NY · Partial reset (capped growth)
- Current annual tax
- $2,124 · $177/mo
- Projected year-2 tax
- $2,124 · $177/mo
- Expected delta
- $0/yr ($0/mo · 0.0%)
ⓘ Screening estimate from a state-policy table — verify with the county assessor before closing.
Climate risk First Street
- Flood 1/10 Low FEMA zone X (unshaded) · 0% chance over 30 yrs
- Wildfire 2/10 Low
- Heat 2/10 Low 7 d/yr ≥95°F today · 15 d/yr by 30 yrs out
- Wind 1/10 Low
- Air quality 2/10 Low 1 unhealthy d/yr today · 2 by 30 yrs out
Nearby sold comps map
Loading sold comps map…
Walkable amenities ~0.75 mi
Loading nearby amenities…
Taxation est. · year 1
- Rental income
- $16,950
- − Mortgage interest
- −$5,602
- − Property taxes
- −$2,124
- − Insurance
- −$500
- − Repairs & maintenance
- −$1,356
- − Management
- −$1,356
- − Depreciation
- −$2,909
- Taxable income
- $3,102
- Est. tax owed @ 24.0%
- −$745
- After-tax cash flow
- $3,728/yr
For passive investors: Depreciation is non-cash, so a rental often shows a tax loss while cash-flowing — sheltering income. Rental losses are passive: they offset passive income freely, and up to $25,000/yr can offset ordinary (W-2) income if you actively participate and your MAGI is under $100k (phasing out to $0 by $150k); unused losses carry forward. On sale, claimed depreciation is recaptured at up to 25%, and gains may owe capital-gains tax (a 1031 exchange can defer both). Figures are a year-1 estimate at your 24.0% rate — not tax advice; consult a CPA.
Schools (NCES district)
- District
- Lockport City School District
- NCES district ID
- 3617670
- Math proficiency
- 44% ▼ -7.00%
- Reading proficiency
- 49% ▲ 3.00%
- Median HH income
- $43,793
- Composite
- 39.28/100
- National rank
- #3997
- State rank
- #452 of 590 in NY
Livability — Lockport
- Score
- 76/100
- State rank
- #232
- US rank
- #3669
Category grades
Schools grade is shown separately in the Schools card above.
Census & demographics
- Census place
- Lockport, NY
- County
- Niagara County · 157,377 people
- Metro
- Buffalo-Cheektowaga, NY
- Population (ZIP)
- 50,153
- Household income
- $75,427
- Rent vs Own
- Severe rent burden
- 1112.0
Population outlook (Niagara County) Hauer SSP2
- Today (2025)
- 204,149 people
- By 2030
- 197,900 · -3.1%
- By 2040
- 182,239 · -10.7%
- By 2050
- 165,198 · -19.1%
- By 2075
- 129,416 · -36.6%
- By 2100
- 96,222 · -52.9%
Race, ethnicity, and origin ACS 2023
- Neighborhood character
- Predominantly White (84%)
- Race & ethnicity
- White 84% Two or more races 6% Black 6% Hispanic / Latino 3%
- Common ancestry
- Romanian 9% Slovak 2% Lithuanian 2%
- Foreign-born
- 3% · Canada
- Languages at home
- 96% English-only · Spanish 1% Russian/Polish/Slavic 1% Other Indo-European 1%
Political lean MEDSL · Niagara
- 2024 margin
- R (+14.9) · D 42.5% · R 57.5%
- 2008→2024 swing
- -15.9pp toward R · 2008: 1.0pp · 2024: -14.9pp
- All cycles
- 2024: R+14.9 2020: R+9.7 2016: R+19.0 2012: D+0.6 2008: D+1.0
Not yet ingested
- Civics
- —
Market trends
- HPI YoY
- ▼ -262.57%
- Current HPI
- 303.6109
- Rent YoY
- ▲ 3.67%
- Metro
- Buffalo-Cheektowaga, NY
- State GDP YoY
- ▲ 2.60%
- F500 in state
- 92
Industry mix (Fortune 500 HQ in NY)
| Industry | F500 HQs | Revenue |
|---|---|---|
| Financial Services | 10 | $950B |
|
||
| Consumer Goods | 9 | $162B |
|
||
| Insurance | 4 | $225B |
|
||
| Telecommunications | 2 | $144B |
|
||
| Pharmaceuticals | 2 | $112B |
|
||
| Media / Entertainment | 2 | $69B |
|
||
Price history
-20.0% since first listed3 events — show timeline
- 2026-04-21 Price Changed $100,000 WNYREIS
- 2026-03-30 Price Changed $115,000 WNYREIS
- 2026-02-20 Listed $125,000 WNYREIS
Property tax history
+40.6%/yrLatest (2025): $2,124 · +2.8% YoY. Source: county tax records.
Cash-flow waterfall
monthlySold comps — $/sqft
last 12 mo · ≤1 miLoading sold comps…