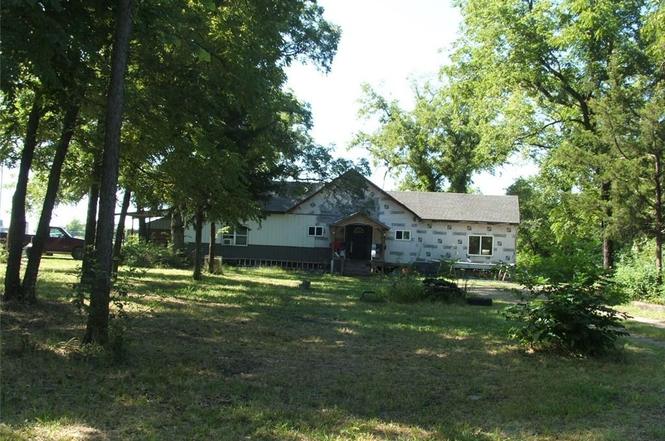
1523 Bridge St · Humboldt, KS
Flood risk 1/10 · Minimal
- FEMA flood zone
- X (unshaded)
- Chance of flooding over 30 yrs
- 0.0%
- Est. flood insurance / yr
- $507 – $1,088
Fire risk 3/10 · Minor
- Est. fire insurance / yr
- $1,154 – $2,142
Heat risk 5/10 · Moderate
- Hot days now (above 108°F)
- 7 days/yr
- Hot days in 30 yrs
- 19 days/yr
Wind risk 2/10 · Minimal
- Chance of severe wind over 30 yrs
- 1.0%
Air-quality risk 2/10 · Minimal
- Unhealthy air days now
- 1 days/yr
- Unhealthy air days in 30 yrs
- 1 days/yr
Risk factors via First Street. Map © Google.
Why this score? — see what drove the C- grade
The composite is a weighted blend of 9 inputs, each scored 0–100. Each bar is that input's sub-score; the figure is the points it added to the 100-point composite (weight × sub-score).
- Cash flow +17.4/30.0
- ARV discount +7.5/15.0
- Appreciation +7.2/10.0
- DSCR +5.4/10.0
- 1% rule +4.7/10.0
- Livability +3.6/5.0
- Rent growth +2.5/5.0
- Condition / age +2.5/5.0
- Schools +2.0/10.0
$84,900
🖨 Deal sheet (PDF) 📄 Offer letter ✓ Due diligence
Key facts
- Loft
- Newer addition
- 4.31 acre lot
Tags
Property features AI
Finance
- Other: Directions available from Humboldt stop lights to 1523 Bridge St
- HOA & community: No association fees
Exterior
- Parking: Detached garage (1 car)
- Utilities: Water source: Other; Septic tank sewer
- Home design: Single family residence (manufactured/mobile); Ranch floor plan; Composition roof; Frame construction; About 41–50 years old; Approximately 1,300 above-grade living area
- Construction: Frame construction; Composition roof; Garage structures on property
- Exterior features: Property includes garages; Lot approximately 4.31 acres; Not in a flood plain
Interior
- Kitchen: Kitchen; Eat-in kitchen
- Bedrooms: 2 bedrooms
- Flooring: Carpet; Vinyl
- Bathrooms: 1 full bathroom; 1 half bathroom
- Heating & cooling: Propane heating; Window air conditioning units
- Interior features: Basement with other/unfinished features; Eat-in kitchen
- Laundry & utility: Laundry located off the kitchen
Neighborhood map
What this means for you Summary
Snapshot
- This is a 2-bed/1.5-bath single-family listed at $85k.
Deal economics
- At list price, monthly cash flow is $64 ($771/yr) — positive.
- The deal already cash-flows at list — no discount required.
- To meet the 1% rule (rent ≥ 1% of price), the offer needs to be $82k (2.9% below list).
- Recommended offer: $75k (12.0% below list) — sets the bar for market timing.
Location & tenants
- Location reads 72/100 on livability (#112 in KS) — a middle-class / working-renter tenant base. Strengths: cost of living A+, housing A+, health & safety A+; Watch: employment D, schools D-, amenities F.
- Humboldt (rural): math 18% / reading 29% proficiency, ranked #148 of 169 in KS (top 88%) — low school quality limits family demand, transient renter base, plan for 1-2y turnover.
- Market conditions: 11 active listings in the ZIP; 18 units permitted in Allen County in 2024 (0 in 5+ unit buildings).
Forward outlook
- In year one you build about $4k of equity ($587 loan paydown + $4k appreciation (4.5% local appreciation)).
- Allen County population projected at -21% by 2050 — secular population decline; favor cash flow + early exit over multi-decade hold.
- At projected returns (4.5% appreciation + 3.0% rent growth), your $24k cash investment doubles in ~5 years — after that, you're playing with house money.
- By year 8, paydown + projected appreciation supports a ~$33k cash-out refi (75% LTV) — recoverable capital for the next deal without selling this one.
Negotiation context
- It's been on market 287 days — a 12% lower offer ($75k) is reasonable based on typical stale-listing flexibility.
- 2 sale attempts with the ask held roughly flat each time — persistent listings suggest the price (not the market) is what's stuck; bring a comps-based counter.
- Current owner paid $43k; list at $85k implies a 97% gain — meaningful room to come down on a strong offer.
Risks & watch-outs
- Climate carrying-cost: extreme-heat days projected 7→19/yr by 2055 (HVAC capex compounding) — expect insurance premiums to compound above CPI over the hold.
Questions for the listing agent
- It's been on market 287 days. Have you received any prior offers? Is the seller open to a 12% concession, seller financing, or rate buy-down credit?
- Why hasn't it sold? Are there any deal-killer items the seller is aware of (foundation, flood, title, zoning, code violations)?
- Is there a deadline driving the sale (1031 exchange, divorce, estate, relocation)? That informs how much negotiation room exists.
- Schools are D-rated, which usually means shorter tenancies and higher turnover. Who's the typical renter profile here, and what's been the actual vacancy rate?
- What's the average days-on-market for RENTAL listings here right now (not sales)? A rising rental-DOM trend means longer vacancies and softer asking-rent achievability than the comps imply.
- What's the recent tenant-quality profile in this submarket — average credit score on applications, eviction rate, late-payment / NSF rate, and stable-employment percentage? A property-management company in the area should have these aggregated.
- How much new for-sale + rental construction is in the pipeline within 1–3 miles? Heavy new supply typically softens prices + rents 12–24 months out; constrained supply supports both.
Investment metrics
- 1% rule
- 0.97% ✗
- Cap rate
- 7.20%
- Cash-on-cash
- 3.25%
- DSCR
- 1.14
- GRM
- 8.6
CMA / ARV
No comps found within radius.
Projected returns pro-forma
4.48% appreciation · 3.0% rent growth · sell at horizon
- IRR
- 14.4%
- Equity multiple
- 1.89×
- Total profit
- $21,164
- Equity at exit
- $45,440
- IRR
- 15.3%
- Equity multiple
- 3.60×
- Total profit
- $61,741
- Equity at exit
- $76,299
Cash invested: $23,772 (down + closing). Projections, not guarantees.
Landlord ↔ Tenant lean methodology
- Overall (STATE)
- 83 Strongly Landlord-Friendly
- State Kansas
- 83 Strongly Landlord-Friendly · R+10
- County
- — inherits STATE
- City
- — inherits STATE
ZIP-level market 66748
- Home prices YoY
- 2.5%
- Active inventory
- 11
- Price-to-rent
- 8.6×
Monthly cashflow live
- Estimated rent
- $824 medium interval (Pro) →
- Mortgage (P&I)
- −$445
- Tax est. 1.5%
- −$106 /mo · $1,274/yr
- Insurance
- −$35
- HOA
- −$0
- Vacancy / Maint / Mgmt
- −$173
- Net cashflow
- $64
Break-even live
Sensitivity live
| Price | -10% $123 | -5% $94 | +0% $64 | +5% $35 | +10% $6 |
|---|---|---|---|---|---|
| Rent | -10% $-1 | -5% $32 | +0% $64 | +5% $97 | +10% $129 |
| Rate | -1.0pp $107 | -0.5pp $86 | base $64 | +0.5pp $42 | +1.0pp $20 |
UW: 25.0% down · 7.5% · 30yr · 1.5% tax · 5.0% vac · 8.0% maint · 8.0% mgmt
Financing live
Cash to close
- Down payment
- $21,225
- Closing costs
- $2,547
- Reserves months
- —
- Total cash needed
- —
Loan-product check · same deal, 3 products live
Conventional
25% down · 7.5% · 30yr
- Down + closing
- —
- Monthly P&I
- —
- Monthly cashflow
- —
- DSCR
- —
- Eligible?
- —
Personal DTI + credit; lowest rate.
DSCR
20% down · 8.5% · 30yr
- Down + closing
- —
- Monthly P&I
- —
- Monthly cashflow
- —
- DSCR
- —
- Eligible?
- —
No personal income docs; deal must DSCR.
Hard money
10% down · 12.0% · 12mo
- Down + closing
- —
- Monthly P&I
- —
- Monthly cashflow
- —
- DSCR
- —
- Eligible?
- —
Short-term bridge; refi at stabilization.
Listing history 21 events
-
2026-06-21days on market $84,900 Active 287 DOM
-
2026-06-18days on market $84,900 Active 285 DOM
-
2026-06-17days on market $84,900 Active 284 DOM
-
2026-06-16days on market $84,900 Active 283 DOM
-
2026-06-15days on market $84,900 Active 282 DOM
-
2026-06-13days on market $84,900 Active 280 DOM
-
2026-06-12days on market $84,900 Active 279 DOM
-
2026-06-09days on market $84,900 Active 276 DOM
-
2026-06-08days on market $84,900 Active 275 DOM
-
2026-06-07days on market $84,900 Active 274 DOM
-
2026-06-05days on market $84,900 Active 272 DOM
-
2026-06-04days on market $84,900 Active 270 DOM
-
2026-06-02days on market $84,900 Active 269 DOM
-
2026-06-01days on market $84,900 Active 268 DOM
-
2026-05-31days on market $84,900 Active 267 DOM
-
2026-05-31days on market $84,900 Active 266 DOM
-
2026-03-04price $84,900
-
2026-02-23status Active
-
2026-01-30historical
-
2025-08-13$89,000 Active
-
2007-06-01soldstatus $43,000
ⓘ Source: listings_history table (triggers on properties + properties_extension) + one-shot
backfill from property_details.listing_events for pre-trigger history.
Climate risk First Street
- Flood 1/10 Low FEMA zone X (unshaded) · 0% chance over 30 yrs
- Wildfire 3/10 Moderate
- Heat 5/10 Major 7 d/yr ≥108°F today · 19 d/yr by 30 yrs out
- Wind 2/10 Low 100% chance of damaging wind over 30 yrs
- Air quality 2/10 Low 1 unhealthy d/yr today · 1 by 30 yrs out
Nearby sold comps map
Loading sold comps map…
Walkable amenities ~0.75 mi
Loading nearby amenities…
Taxation est. · year 1
- Rental income
- $9,889
- − Mortgage interest
- −$4,756
- − Property taxes
- −$1,274
- − Insurance
- −$424
- − Repairs & maintenance
- −$791
- − Management
- −$791
- − Depreciation
- −$2,470
- Taxable loss
- −$617
- Est. tax savings @ 24.0%
- +$148
- After-tax cash flow
- $920/yr
For passive investors: Depreciation is non-cash, so a rental often shows a tax loss while cash-flowing — sheltering income. Rental losses are passive: they offset passive income freely, and up to $25,000/yr can offset ordinary (W-2) income if you actively participate and your MAGI is under $100k (phasing out to $0 by $150k); unused losses carry forward. On sale, claimed depreciation is recaptured at up to 25%, and gains may owe capital-gains tax (a 1031 exchange can defer both). Figures are a year-1 estimate at your 24.0% rate — not tax advice; consult a CPA.
Schools (NCES district)
- District
- Humboldt
- NCES district ID
- 2007590
- Math proficiency
- 18% ▼ -6.00%
- Reading proficiency
- 29% ▼ -11.00%
- Median HH income
- $43,599
- Composite
- 20.16/100
- National rank
- #8634
- State rank
- #148 of 169 in KS
Livability — Humboldt
- Score
- 72/100
- State rank
- #112
- US rank
- #6241
Category grades
Schools grade is shown separately in the Schools card above.
Census & demographics
- Population (ZIP)
- 2,864
Population outlook (Allen County) Hauer SSP2
- Today (2025)
- 11,885 people
- By 2030
- 11,352 · -4.5%
- By 2040
- 10,285 · -13.5%
- By 2050
- 9,342 · -21.4%
- By 2075
- 7,482 · -37.0%
- By 2100
- 5,871 · -50.6%
Race, ethnicity, and origin ACS 2023
- Neighborhood character
- Predominantly White (92%)
- Race & ethnicity
- White 92% Hispanic / Latino 4% Two or more races 2% Asian 2% Pacific Islander 1%
- Common ancestry
- Italian 4% Slovak 2% Serbian 2%
- Foreign-born
- 1% · China, Canada
- Languages at home
- 97% English-only · Chinese 2%
Political lean MEDSL · Allen
- 2024 margin
- Solid R (+46.1) · D 25.8% · R 72.0% · Other 2.2%
- 2008→2024 swing
- -22.9pp toward R · 2008: -23.3pp · 2024: -46.1pp
- All cycles
- 2024: R+46.1 2020: R+44.4 2016: R+41.0 2012: R+27.2 2008: R+23.3
Not yet ingested
- Civics
- —
Market trends
- HPI YoY
- ▲ 4.48%
- Current HPI
- 180.3616
- Rent YoY
- —
- Metro
- —
- State GDP YoY
- —
- F500 in state
- 0
Price history
+97.4% since first listed5 events — show timeline
- 2026-03-04 Price Changed $84,900 Heartland MLS as Distributed by MLS Grid
- 2026-02-23 Relisted — Heartland MLS as Distributed by MLS Grid
- 2026-01-30 Listing Removed — Heartland MLS as Distributed by MLS Grid
- 2025-08-13 Listed $89,000 Heartland MLS as Distributed by MLS Grid
- 2007-06-01 Sold (Public Records) $43,000 Public Records
Cash-flow waterfall
monthlySold comps — $/sqft
last 12 mo · ≤1 miLoading sold comps…