1252 Carrick Ct · Odessa, DE
Flood risk 1/10 · Minimal
- FEMA flood zone
- X (unshaded)
- Chance of flooding over 30 yrs
- 0.0%
- Est. flood insurance / yr
- $507 – $1,088
Fire risk 2/10 · Minimal
- Est. fire insurance / yr
- $476 – $884
Heat risk 8/10 · Major
- Hot days now (above 102°F)
- 7 days/yr
- Hot days in 30 yrs
- 16 days/yr
Wind risk 6/10 · Moderate
- Chance of severe wind over 30 yrs
- 27.0%
Air-quality risk 2/10 · Minimal
- Unhealthy air days now
- 1 days/yr
- Unhealthy air days in 30 yrs
- 2 days/yr
Risk factors via First Street. Map © Google.
Why this score? — see what drove the D- grade
The composite is a weighted blend of 9 inputs, each scored 0–100. Each bar is that input's sub-score; the figure is the points it added to the 100-point composite (weight × sub-score).
- Cash flow +11.7/30.0
- ARV discount +8.2/15.0
- Schools +4.2/10.0
- Livability +3.6/5.0
- DSCR +3.4/10.0
- Rent growth +2.8/5.0
- 1% rule +2.7/10.0
- Condition / age +2.5/5.0
- Appreciation +0.0/10.0
$389,900
🖨 Deal sheet 📄 Offer letter ✓ Due diligence
Listing remarks
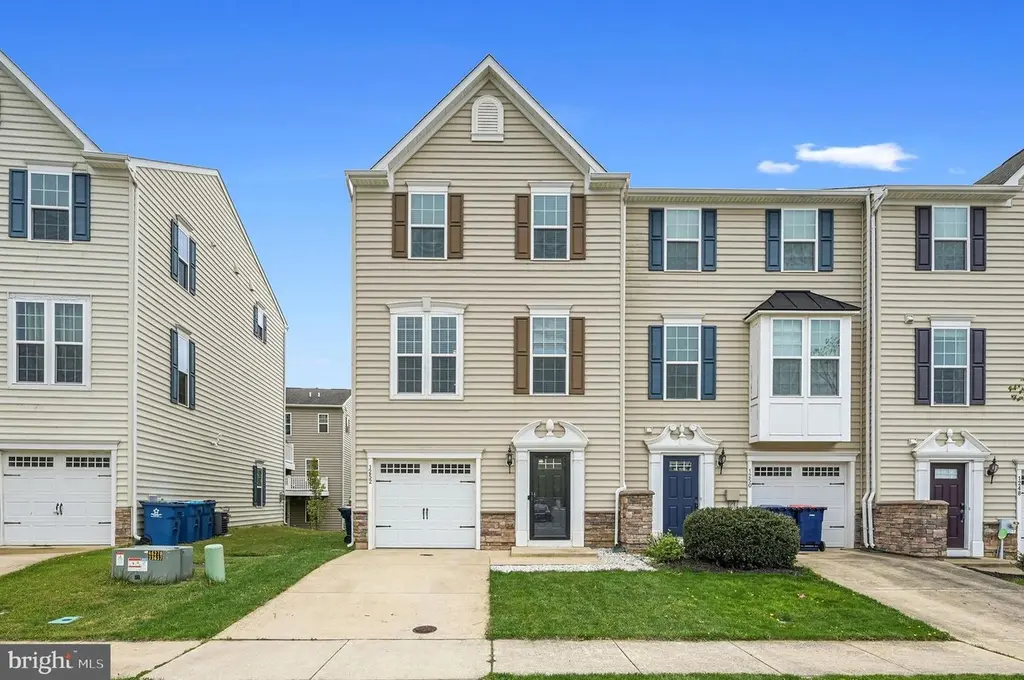
This 3-bedroom, 2.5-bath townhome with a one-car garage, located in the Appoquinimink School District, offers a spacious and functional layout in the MOT area. The exterior features stone veneer accents and classic styling that create a welcoming first impression. Inside, a bright foyer leads to a finished lower-level space currently used as a gym or secondary living area, offering flexibility to fit your needs. This level also includes two closets for additional storage and French doors that provide direct access to the backyard. The main level features an open-concept layout with a light-filled living and dining area that flows into a spacious eat-in kitchen. The kitchen is well-equipped
Key facts
- $42 HOA
- Garage
- Built 2015
Property features AI
Finance
- HOA & community: HOA fee of $500 annually
Exterior
- Parking: Attached front-entry garage with garage door opener and inside access; Driveway parking
- Utilities: Public water; Public sewer; Electric service
- Home design: End of row townhouse; Fee simple ownership; Finished above-grade living area per assessor
- Construction: Vinyl siding and stone exterior; Slab foundation
- Exterior features: Awning(s); Deck(s)
Interior
- Kitchen: Dishwasher; Disposal; Microwave; Electric oven/range; Refrigerator; Kitchen island
- Bedrooms: Three bedrooms located on the upper level
- Flooring: Carpet
- Bathrooms: Two full bathrooms; One half bathroom
- Heating & cooling: Forced air heating (electric); Central air conditioning (electric); Natural gas hot water
- Interior features: Stall shower and tub/shower combination; Carpeted areas; Ceiling fans; Combination kitchen and dining area; Dining area; Kitchen island; Master bathroom; Recessed lighting; Walk-in closets
- Laundry & utility: Washer and dryer included; Laundry located on upper floor; Water heater
Neighborhood map
What this means for you Summary
Snapshot
- This is a 3-bed/2.5-bath townhouse listed at $390k.
Deal economics
- At list price, monthly cash flow is $-114 ($-1k/yr) — negative.
- To cash-flow at today's rent, offer at most $370k (5.2% below list).
- To meet the 1% rule (rent ≥ 1% of price), the offer needs to be $301k (22.8% below list).
- Recommended offer: $301k (22.8% below list) — sets the bar for 1% rule.
- Cap rate 5.9% vs local median 3.2% in Odessa — top-decile yield for the area; either an underpriced asset or a hidden risk that comps aren't pricing in. Stress-test before assuming the spread holds.
Location & tenants
- Location reads 72/100 on livability (#19 in DE) — a middle-class / working-renter tenant base. Strengths: housing A+, health & safety A+, employment B+; Watch: amenities F, commute F.
- Appoquinimink School District (rural): math 37% / reading 52% proficiency, ranked #6 of 26 in DE (top 23%) — families likely to look elsewhere, expect single-tenant / working-renter base with shorter leases; only 18% free/reduced lunch — higher-income household profile.
- Zoned schools: Lorewood Grove Elementary School (math 42% / reading 49%, grade D-, #16 of 105 statewide, top 14%, 763 students, 0% FRL); Cantwells Bridge Middle School (805 students, 0% FRL); Odessa High School (917 students, 0% FRL) — zoned schools average 0% FRL vs 18% district-wide (18 pts lower); this property's tenant base skews higher-income than the district average.
- Market conditions: Rents rising (+1.1%/yr); 451 active listings in the ZIP; 2 comparable units currently listed for rent nearby; high-income renter base; 1,367 units permitted in New Castle County in 2024 (201 in 5+ unit buildings).
Forward outlook
- Local home prices are declining (-3.0%/yr); year-one equity from $3k of loan paydown is wiped out by about $12k of value loss. Plan a longer hold.
- New Castle County population projected at +9% by 2050 — modest demand growth; plan on rents tracking national, not racing it.
Negotiation context
- Only 9 days on market — expect competitive offers; lowballing is unlikely to land.
Risks & watch-outs
- Climate carrying-cost: major wind risk, 27% chance of damaging wind over 30y; extreme-heat days projected 7→16/yr by 2055 (HVAC capex compounding) — expect insurance premiums to compound above CPI over the hold.
Questions for the listing agent
- What do current leases actually rent for vs. the listed asking? Can we see a recent rent roll and the last 12 months of T-12 income?
- What does the HOA fee cover, when was the last increase, and are there any pending special assessments or reserve-fund shortfalls?
- Is there a deadline driving the sale (1031 exchange, divorce, estate, relocation)? That informs how much negotiation room exists.
- Schools are B-rated — typically a magnet for longer-tenancy family renters. What's the average tenant stay here, and is there a school-zone premium baked into asking?
- The area grade is low — what's the realistic commute time and amenity access for the typical tenant pool here? Any planned neighborhood developments (good or bad) we should know about?
- What's the average days-on-market for RENTAL listings here right now (not sales)? A rising rental-DOM trend means longer vacancies and softer asking-rent achievability than the comps imply.
- What's the recent tenant-quality profile in this submarket — average credit score on applications, eviction rate, late-payment / NSF rate, and stable-employment percentage? A property-management company in the area should have these aggregated.
- How much new for-sale + rental construction is in the pipeline within 1–3 miles? Heavy new supply typically softens prices + rents 12–24 months out; constrained supply supports both.
Investment metrics
- 1% rule
- 0.77% ✗
- Cap rate
- 5.94%
- Cash-on-cash
- -1.25%
- DSCR
- 0.94
- GRM
- 10.8
CMA / ARV
- ARV (median comp)
- $396,349
- List price
- $389,900
- Delta
- -1.63%
- Verdict
- FAIR
- Comps
- 20 within 1.0 mi
Show comp detail 12 sales within ~0.75 mi
| Address | Dist | Beds/Ba | Sqft | Sold | Price | $/sf | Match |
|---|---|---|---|---|---|---|---|
| 1252 Carrick Ct | 0.00mi | 3/2.5 | 1,950 (0%) | 1mo | $395,000 | $203 | 100 |
| 1222 Carrick Ct | 0.07mi | 3/2.5 | 1,975 (+1%) | 3mo | $375,000 | $190 | 92 |
| 633 Barrie Rd | 0.07mi | 3/2.5 | 1,950 (0%) | 7mo | $360,000 | $185 | 91 |
| 635 Barrie Rd | 0.07mi | 3/2.5 | 1,950 (0%) | 10mo | $375,000 | $192 | 89 |
| 621 Barrie Rd | 0.10mi | 3/2.5 | 1,950 (0%) | 9mo | $385,000 | $197 | 88 |
| 464 Smee Rd | 0.08mi | 3/2.5 | 1,700 (-13%) | 5mo | $395,000 | $232 | 70 |
| 1302 Carrick Ct | 0.11mi | 4/3.5 (+1) | 2,175 (+12%) | 1mo | $389,900 | $179 | 66 |
| 607 Barrie Rd | 0.13mi | 3/2.5 | 2,200 (+13%) | 9mo | $390,000 | $177 | 65 |
| 1353 Carrick Ct | 0.23mi | 3/2.5 | 2,178 (+12%) | 7mo | $375,000 | $172 | 64 |
| 405 Smee Rd | 0.15mi | 3/1.5 | 1,725 (-12%) | 12mo | $382,000 | $221 | 60 |
| 1346 Carrick Ct | 0.21mi | 3/2.5 | 2,150 (+10%) | 20mo | $384,900 | $179 | 56 |
| 1306 Carrick Ct | 0.12mi | 4/3.5 (+1) | 2,175 (+12%) | 16mo | $377,000 | $173 | 52 |
Match score weights: distance 35% · size 25% · config 20% · recency 20%. Top-matched comps best support the ARV.
Projected returns pro-forma
-3.0% appreciation · 1.07% rent growth · sell at horizon
- IRR
- -20.4%
- Equity multiple
- 0.30×
- Total profit
- $-76,254
- Equity at exit
- $58,135
- IRR
- -18.1%
- Equity multiple
- 0.10×
- Total profit
- $-98,708
- Equity at exit
- $33,711
Cash invested: $109,172 (down + closing). Projections, not guarantees.
Landlord ↔ Tenant lean methodology
- Overall (STATE)
- 70 Landlord-Friendly
- State Delaware
- 70 Landlord-Friendly · D+7
- County
- — inherits STATE
- City
- — inherits STATE
ZIP-level market 19709
- Home prices YoY
- -21.4%
- Rents YoY
- 1.1%
- Active inventory
- 451
- Price-to-rent
- 10.8×
Monthly cashflow live
- Estimated rent
- $3,010 medium interval (Pro) →
- Mortgage (P&I)
- −$2,045
- Tax from tax record
- −$243 /mo · $2,913/yr
- Insurance
- −$162
- HOA
- −$42
- Vacancy / Maint / Mgmt
- −$632
- Net cashflow
- $-114
Break-even live
UW: 25.0% down · 7.5% · 30yr · 1.5% tax · 5.0% vac · 8.0% maint · 8.0% mgmt
Financing live
Cash to close
- Down payment
- $97,475
- Closing costs
- $11,697
- Reserves months
- —
- Total cash needed
- —
Loan-product check · same deal, 3 products live
Conventional
25% down · 7.5% · 30yr
- Down + closing
- —
- Monthly P&I
- —
- Monthly cashflow
- —
- DSCR
- —
- Eligible?
- —
Personal DTI + credit; lowest rate.
DSCR
20% down · 8.5% · 30yr
- Down + closing
- —
- Monthly P&I
- —
- Monthly cashflow
- —
- DSCR
- —
- Eligible?
- —
No personal income docs; deal must DSCR.
Hard money
10% down · 12.0% · 12mo
- Down + closing
- —
- Monthly P&I
- —
- Monthly cashflow
- —
- DSCR
- —
- Eligible?
- —
Short-term bridge; refi at stabilization.
Rent comps 2 comps
| Address | Beds | Baths | Sqft | Rent | $/sqft | DOM | Units | Dist |
|---|---|---|---|---|---|---|---|---|
| 1310 Carrick Ct Middletown, DE | 3.0 | 2.5 | 2325 | $2,800 | $1.20 | 24d | 1 | 0.10mi |
| 1222 Carrick Ct Middletown, DE | 3.0 | 2.5 | 2200 | $2,450 | $1.11 | 15d | 1 | 0.11mi |
HOA detail
- Monthly dues
- $42 · $504/yr
- Likely covers
- gym
Listing history 4 events
-
2026-05-08status Pending 1692-char remark
-
2026-05-07historical 1692-char remark
-
2026-04-29$389,900 Active 1692-char remark
-
2026-04-28historical $389,900 1692-char remark
ⓘ Source: listings_history table (triggers on properties + properties_extension) + one-shot
backfill from property_details.listing_events for pre-trigger history.
Tax reassessment forecast DE · Partial reset (capped growth)
- Current annual tax
- $2,913 · $243/mo
- Projected year-2 tax
- $2,913 · $243/mo
- Expected delta
- $0/yr ($0/mo · 0.0%)
ⓘ Screening estimate from a state-policy table — verify with the county assessor before closing.
Climate risk First Street
- Flood 1/10 Low FEMA zone X (unshaded) · 0% chance over 30 yrs
- Wildfire 2/10 Low
- Heat 8/10 Severe 7 d/yr ≥102°F today · 16 d/yr by 30 yrs out
- Wind 6/10 Major 27% chance of damaging wind over 30 yrs
- Air quality 2/10 Low 1 unhealthy d/yr today · 2 by 30 yrs out
Nearby sold comps map
Loading sold comps map…
Walkable amenities ~0.75 mi
Loading nearby amenities…
Taxation est. · year 1
- Rental income
- $36,120
- − Mortgage interest
- −$21,840
- − Property taxes
- −$2,913
- − Insurance
- −$1,950
- − Repairs & maintenance
- −$2,890
- − Management
- −$2,890
- − HOA
- −$504
- − Depreciation
- −$11,343
- Taxable loss
- −$8,209
- Est. tax savings @ 24.0%
- +$1,970
- After-tax cash flow
- $602/yr
For passive investors: Depreciation is non-cash, so a rental often shows a tax loss while cash-flowing — sheltering income. Rental losses are passive: they offset passive income freely, and up to $25,000/yr can offset ordinary (W-2) income if you actively participate and your MAGI is under $100k (phasing out to $0 by $150k); unused losses carry forward. On sale, claimed depreciation is recaptured at up to 25%, and gains may owe capital-gains tax (a 1031 exchange can defer both). Figures are a year-1 estimate at your 24.0% rate — not tax advice; consult a CPA.
Schools (NCES district)
- District
- Appoquinimink School District
- NCES district ID
- 1000080
- Math proficiency
- 37% ▼ -13.00%
- Reading proficiency
- 52% ▼ -13.00%
- Median HH income
- $93,397
- Composite
- 42.32/100
- National rank
- #3256
- State rank
- #6 of 26 in DE
Livability — Odessa
- Score
- 72/100
- State rank
- #19
- US rank
- #6505
Category grades
Schools grade is shown separately in the Schools card above.
Census & demographics
- County
- New Castle County · 483,412 people
- City population
- 506
- Metro
- Philadelphia-Camden-Wilmington, PA-NJ-DE-MD
- Population (ZIP)
- 53,234
- Household income
- $132,956
- Rent vs Own
- Severe rent burden
- 268.0
Population outlook (New Castle County) Hauer SSP2
- Today (2025)
- 594,686 people
- By 2030
- 609,164 · +2.4%
- By 2040
- 632,154 · +6.3%
- By 2050
- 649,068 · +9.1%
- By 2075
- 687,771 · +15.7%
- By 2100
- 694,961 · +16.9%
Race, ethnicity, and origin ACS 2023
- Neighborhood character
- Diverse neighborhood (Simpson 0.59)
- Race & ethnicity
- White 59% Black 23% Asian 7% Two or more races 6% Hispanic / Latino 6%
- Hispanic origin (detail)
- Mexican 1% Puerto Rican 3%
- Common ancestry
- Romanian 5% Slovak 1% Iranian 1%
- Foreign-born
- 11% · Canada, China
- Languages at home
- 87% English-only · Other Indo-European 4% Spanish 3% French/Haitian/Cajun 1%
Political lean MEDSL · New Castle
- 2024 margin
- Solid D (+32.6) · D 65.5% · R 32.9% · Other 1.6%
- 2008→2024 swing
- -8.1pp toward R · 2008: 40.6pp · 2024: 32.6pp
- All cycles
- 2024: D+32.6 2020: D+37.1 2016: D+29.6 2012: D+34.1 2008: D+40.6
Not yet ingested
- Civics
- —
Market trends
- HPI YoY
- ▼ -86.40%
- Current HPI
- 317.1386
- Rent YoY
- ▲ 1.07%
- Metro
- Philadelphia-Camden-Wilmington, PA-NJ-DE-MD
- State GDP YoY
- —
- F500 in state
- 0
Price history
+1.3% since first listed5 events — show timeline
- 2026-06-03 Sold (MLS) $395,000 BRIGHT MLS
- 2026-05-08 Pending — BRIGHT MLS
- 2026-05-07 Listing Removed — BRIGHT MLS
- 2026-04-29 Listed $389,900 BRIGHT MLS
- 2026-04-28 Coming Soon $389,900 BRIGHT MLS
Property tax history
+64.5%/yrLatest (2024): $2,913 · +16.6% YoY. Source: county tax records.
Cash-flow waterfall
monthlySold comps — $/sqft
last 12 mo · ≤1 miLoading sold comps…