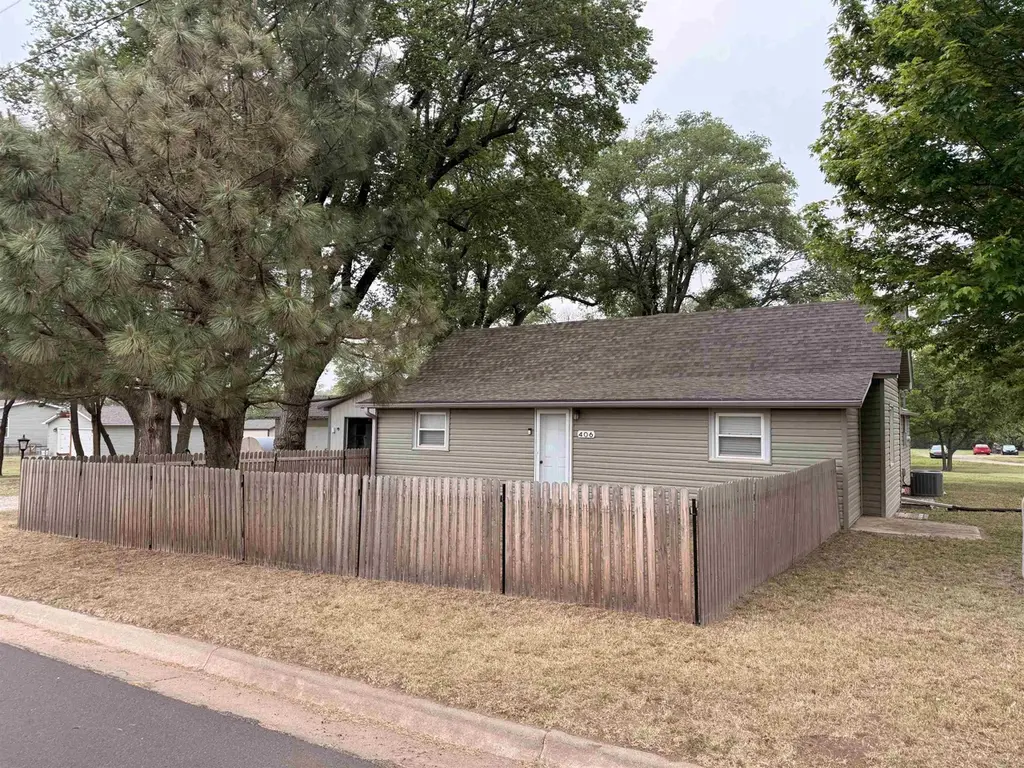
406 W Burns · Norwich, KS
Flood risk 1/10 · Minimal
- FEMA flood zone
- —
- Chance of flooding over 30 yrs
- 0.0%
- Est. flood insurance / yr
- —
Fire risk 5/10 · Moderate
- Est. fire insurance / yr
- $1,154 – $2,142
Heat risk 5/10 · Moderate
- Hot days now (above 107°F)
- 7 days/yr
- Hot days in 30 yrs
- 18 days/yr
Wind risk 2/10 · Minimal
- Chance of severe wind over 30 yrs
- 0.0%
Air-quality risk 2/10 · Minimal
- Unhealthy air days now
- 1 days/yr
- Unhealthy air days in 30 yrs
- 1 days/yr
Risk factors via First Street. Map © Google.
Why this score? — see what drove the D grade
The composite is a weighted blend of 9 inputs, each scored 0–100. Each bar is that input's sub-score; the figure is the points it added to the 100-point composite (weight × sub-score).
- Cash flow +12.9/30.0
- ARV discount +7.5/15.0
- Appreciation +5.7/10.0
- DSCR +3.9/10.0
- 1% rule +3.6/10.0
- Livability +3.2/5.0
- Rent growth +2.5/5.0
- Condition / age +2.5/5.0
- Schools +2.3/10.0
$149,999
🖨 Deal sheet (PDF) 📄 Offer letter ✓ Due diligence
Key facts
- 0.6 acre lot
- 2 garage spots
- Built 1904
Property features AI
Exterior
- Parking: 2-car garage
- Utilities: Public water; Sewer available; Natural gas available
- Home design: Single-family onsite-built home
- Construction: Composition roof; Full daylight foundation
- Exterior features: One level; Full daylight foundation; Composition roof
Interior
- Kitchen: Refrigerator; Range
- Bathrooms: 2 full bathrooms
- Heating & cooling: Forced air heating (natural gas); Central electric air conditioning
- Interior features: Unfinished basement
- Laundry & utility: Main-floor laundry in a separate room
Neighborhood map
What this means for you Summary
Snapshot
- This is a 4-bed/2.0-bath single-family listed at $150k.
Deal economics
- At list price, monthly cash flow is $-11 ($-135/yr) — negative.
- To cash-flow at today's rent, offer at most $148k (1.3% below list).
- To meet the 1% rule (rent ≥ 1% of price), the offer needs to be $128k (14.4% below list).
- Recommended offer: $128k (14.4% below list) — sets the bar for 1% rule.
Location & tenants
- Location reads 65/100 on livability (#302 in KS) — a middle-class / working-renter tenant base. Strengths: cost of living A+, health & safety A+, housing A-; Watch: crime F, amenities F, commute F.
- Kingman-Norwich (town): math 22% / reading 30% proficiency, ranked #129 of 169 in KS (top 76%) — low school quality limits family demand, transient renter base, plan for 1-2y turnover.
- Zoned schools: Kingman Elementary School (math 22% / reading 27%, grade F, #540 of 684 statewide, top 82%, 349 students, 59% FRL); Kingman Middle School (math 8% / reading 17%, grade F, #192 of 219 statewide, top 88%, 94 students, 54% FRL); Kingman High (math 15% / reading 24%, grade F, #198 of 327 statewide, top 66%, 203 students, 44% FRL) — zoned schools average 53% FRL vs 37% district-wide (15 pts higher); higher-poverty schools than district average — tighter screening recommended.
- Market conditions: 8 active listings in the ZIP; 52 units permitted in Kingman County in 2024 (30 in 5+ unit buildings).
Forward outlook
- In year one you build about $3k of equity ($1k loan paydown + $2k appreciation (1.4% local appreciation)).
- Kingman County population projected at -10% by 2050 — secular population decline; favor cash flow + early exit over multi-decade hold.
- At projected returns (1.4% appreciation + 3.0% rent growth), your $42k cash investment doubles in ~9 years — after that, you're playing with house money.
- By year 10, paydown + projected appreciation supports a ~$31k cash-out refi (75% LTV) — recoverable capital for the next deal without selling this one.
Negotiation context
- Only 6 days on market — expect competitive offers; lowballing is unlikely to land.
- Current owner paid $25k; list at $150k implies a 500% gain — meaningful room to come down on a strong offer.
Risks & watch-outs
- Watch-outs: built in 1904 — expect roof / HVAC / electrical / plumbing capex.
- Climate carrying-cost: moderate wildfire risk; extreme-heat days projected 7→18/yr by 2055 (HVAC capex compounding) — expect insurance premiums to compound above CPI over the hold.
Questions for the listing agent
- What do current leases actually rent for vs. the listed asking? Can we see a recent rent roll and the last 12 months of T-12 income?
- Built in 1904 — when were the roof, HVAC, electrical panel, plumbing, and water heater last replaced?
- Is there a deadline driving the sale (1031 exchange, divorce, estate, relocation)? That informs how much negotiation room exists.
- Crime grade is F in this area — have there been break-ins, vandalism, or insurance claims at this property in the last 3 years? What carrier currently insures it and at what premium?
- The area grade is low — what's the realistic commute time and amenity access for the typical tenant pool here? Any planned neighborhood developments (good or bad) we should know about?
- What's the average days-on-market for RENTAL listings here right now (not sales)? A rising rental-DOM trend means longer vacancies and softer asking-rent achievability than the comps imply.
- What's the recent tenant-quality profile in this submarket — average credit score on applications, eviction rate, late-payment / NSF rate, and stable-employment percentage? A property-management company in the area should have these aggregated.
- How much new for-sale + rental construction is in the pipeline within 1–3 miles? Heavy new supply typically softens prices + rents 12–24 months out; constrained supply supports both.
Investment metrics
- 1% rule
- 0.86% ✗
- Cap rate
- 6.20%
- Cash-on-cash
- -0.32%
- DSCR
- 0.99
- GRM
- 9.7
CMA / ARV
No comps found within radius.
Projected returns pro-forma
1.36% appreciation · 3.0% rent growth · sell at horizon
- IRR
- 2.2%
- Equity multiple
- 1.11×
- Total profit
- $4,732
- Equity at exit
- $54,005
- IRR
- 6.5%
- Equity multiple
- 1.83×
- Total profit
- $34,706
- Equity at exit
- $73,982
Cash invested: $42,000 (down + closing). Projections, not guarantees.
Landlord ↔ Tenant lean methodology
- Overall (STATE)
- 83 Strongly Landlord-Friendly
- State Kansas
- 83 Strongly Landlord-Friendly · R+10
- County
- — inherits STATE
- City
- — inherits STATE
ZIP-level market 67118
- Home prices YoY
- 0.6%
- Active inventory
- 8
- Price-to-rent
- 9.7×
Monthly cashflow live
- Estimated rent
- $1,284 medium interval (Pro) →
- Mortgage (P&I)
- −$787
- Tax from tax record
- −$177 /mo · $2,119/yr
- Insurance
- −$62
- HOA
- −$0
- Vacancy / Maint / Mgmt
- −$270
- Net cashflow
- $-11
Break-even live
Sensitivity live
| Price | -10% $74 | -5% $31 | +0% $-11 | +5% $-54 | +10% $-96 |
|---|---|---|---|---|---|
| Rent | -10% $-113 | -5% $-62 | +0% $-11 | +5% $39 | +10% $90 |
| Rate | -1.0pp $64 | -0.5pp $27 | base $-11 | +0.5pp $-50 | +1.0pp $-90 |
UW: 25.0% down · 7.5% · 30yr · 1.5% tax · 5.0% vac · 8.0% maint · 8.0% mgmt
Financing live
Cash to close
- Down payment
- $37,500
- Closing costs
- $4,500
- Reserves months
- —
- Total cash needed
- —
Loan-product check · same deal, 3 products live
Conventional
25% down · 7.5% · 30yr
- Down + closing
- —
- Monthly P&I
- —
- Monthly cashflow
- —
- DSCR
- —
- Eligible?
- —
Personal DTI + credit; lowest rate.
DSCR
20% down · 8.5% · 30yr
- Down + closing
- —
- Monthly P&I
- —
- Monthly cashflow
- —
- DSCR
- —
- Eligible?
- —
No personal income docs; deal must DSCR.
Hard money
10% down · 12.0% · 12mo
- Down + closing
- —
- Monthly P&I
- —
- Monthly cashflow
- —
- DSCR
- —
- Eligible?
- —
Short-term bridge; refi at stabilization.
Listing history 4 events
-
2026-05-04status Pending
-
2026-04-29price $149,999
-
2026-04-26$165,000 Active
-
1985-10-01soldstatus $25,000
ⓘ Source: listings_history table (triggers on properties + properties_extension) + one-shot
backfill from property_details.listing_events for pre-trigger history.
Tax reassessment forecast KS · Resets to sale price
- Current annual tax
- $2,119 · $177/mo
- Projected year-2 tax
- $2,119 · $177/mo
- Expected delta
- $0/yr ($0/mo · 0.0%)
ⓘ Screening estimate from a state-policy table — verify with the county assessor before closing.
Climate risk First Street
- Flood 1/10 Low 0% chance over 30 yrs
- Wildfire 5/10 Major
- Heat 5/10 Major 7 d/yr ≥107°F today · 18 d/yr by 30 yrs out
- Wind 2/10 Low 0% chance of damaging wind over 30 yrs
- Air quality 2/10 Low 1 unhealthy d/yr today · 1 by 30 yrs out
Nearby sold comps map
Loading sold comps map…
Walkable amenities ~0.75 mi
Loading nearby amenities…
Taxation est. · year 1
- Rental income
- $15,410
- − Mortgage interest
- −$8,402
- − Property taxes
- −$2,119
- − Insurance
- −$750
- − Repairs & maintenance
- −$1,233
- − Management
- −$1,233
- − Depreciation
- −$4,364
- Taxable loss
- −$2,691
- Est. tax savings @ 24.0%
- +$646
- After-tax cash flow
- $511/yr
For passive investors: Depreciation is non-cash, so a rental often shows a tax loss while cash-flowing — sheltering income. Rental losses are passive: they offset passive income freely, and up to $25,000/yr can offset ordinary (W-2) income if you actively participate and your MAGI is under $100k (phasing out to $0 by $150k); unused losses carry forward. On sale, claimed depreciation is recaptured at up to 25%, and gains may owe capital-gains tax (a 1031 exchange can defer both). Figures are a year-1 estimate at your 24.0% rate — not tax advice; consult a CPA.
Schools (NCES district)
- District
- Kingman-Norwich
- NCES district ID
- 2008070
- Math proficiency
- 22% ▬ 0.00%
- Reading proficiency
- 30% ▲ 1.00%
- Median HH income
- $48,914
- Composite
- 22.76/100
- National rank
- #8028
- State rank
- #129 of 169 in KS
Livability — Norwich
- Score
- 65/100
- State rank
- #302
- US rank
- #13319
Category grades
Schools grade is shown separately in the Schools card above.
Census & demographics
- Census place
- Norwich, KS
- Population (ZIP)
- 856
Population outlook (Kingman County) Hauer SSP2
- Today (2025)
- 7,491 people
- By 2030
- 7,380 · -1.5%
- By 2040
- 7,090 · -5.4%
- By 2050
- 6,736 · -10.1%
- By 2075
- 6,400 · -14.6%
- By 2100
- 6,125 · -18.2%
Race, ethnicity, and origin ACS 2023
- Neighborhood character
- Predominantly White (88%)
- Race & ethnicity
- White 88% Hispanic / Latino 7% Two or more races 6%
- Hispanic origin (detail)
- Mexican 7%
- Common ancestry
- Slovak 4% Iranian 2% Lithuanian 2%
- Foreign-born
- 0%
Political lean MEDSL · Kingman
- 2024 margin
- Solid R (+59.9) · D 19.1% · R 79.0% · Other 1.9%
- 2008→2024 swing
- -15.2pp toward R · 2008: -44.8pp · 2024: -59.9pp
- All cycles
- 2024: R+59.9 2020: R+60.0 2016: R+58.3 2012: R+51.3 2008: R+44.8
Not yet ingested
- Civics
- —
Market trends
- HPI YoY
- ▲ 1.36%
- Current HPI
- 224.8903
- Rent YoY
- —
- Metro
- —
- State GDP YoY
- —
- F500 in state
- 0
Price history
+500.0% since first listed4 events — show timeline
- 2026-05-04 Pending — SCKMLS as Distributed by MLS Grid
- 2026-04-29 Price Changed $149,999 SCKMLS as Distributed by MLS Grid
- 2026-04-26 Listed $165,000 SCKMLS as Distributed by MLS Grid
- 1985-10-01 Sold (Public Records) $25,000 Public Records
Property tax history
+4.6%/yrLatest (2025): $2,119 · +4.6% YoY. Source: county tax records.
Cash-flow waterfall
monthlySold comps — $/sqft
last 12 mo · ≤1 miLoading sold comps…