604 Greenwood Ave · Camden, AR
Flood risk No data
- FEMA flood zone
- —
- Chance of flooding over 30 yrs
- —
- Est. flood insurance / yr
- —
Fire risk No data
- Est. fire insurance / yr
- —
Heat risk No data
- Hot days now (above threshold)
- —
- Hot days in 30 yrs
- —
Wind risk No data
- Chance of severe wind over 30 yrs
- —
Air-quality risk No data
- Unhealthy air days now
- —
- Unhealthy air days in 30 yrs
- —
Risk factors via First Street. Map © Google.
Why this score? — see what drove the D grade
The composite is a weighted blend of 9 inputs, each scored 0–100. Each bar is that input's sub-score; the figure is the points it added to the 100-point composite (weight × sub-score).
- Cash flow +15.0/30.0
- ARV discount +7.5/15.0
- 1% rule +5.0/10.0
- DSCR +5.0/10.0
- Livability +2.9/5.0
- Rent growth +2.5/5.0
- Condition / age +2.5/5.0
- Schools +0.9/10.0
- Appreciation +0.0/10.0
$8,500
🖨 Deal sheet (PDF) 📄 Offer letter ✓ Due diligence
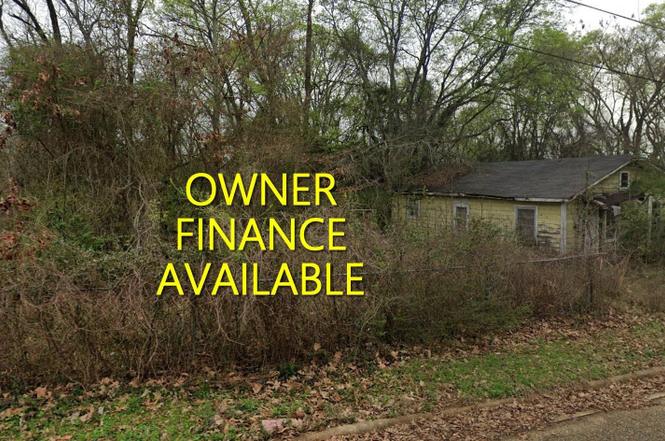
Listing remarks
Owner-finance available! Home will need renovations but you keep the equity once it's paid off. Home sits on a good sized corner lot and property taxes are low. Make this into your first starter home or fix quickly to add to your rental portfolio. Owner/Agent. Easy terms to finance. $500 finance fee. No interest and no prepayment penalty. 18 months for $500 to own. Closing costs included. Parcel - 732-00030-000R
Key facts
- 0.33 acre lot
- 3 parking spots
- Built 1940
Neighborhood map
What this means for you Summary
Snapshot
- This is a 2-bed/1.0-bath single-family listed at $8k.
Deal economics
- At list price, monthly cash flow is $1k ($13k/yr) — positive.
- The deal already cash-flows at list — no discount required.
- Meets the 1% rule at list price ($1k rent vs $8k).
- Recommended offer: $8k (6.0% below list) — sets the bar for market timing.
- Cap rate 154.9% vs local median 5.2% in Camden — top-decile yield for the area; either an underpriced asset or a hidden risk that comps aren't pricing in. Stress-test before assuming the spread holds.
Location & tenants
- Location reads 57/100 on livability (#364 in AR) — a working-class tenant base; expect higher turnover. Strengths: cost of living A+, housing A+, health & safety A+; Watch: crime F, amenities F, commute F.
- Camden Fairview School District (town): math 9% / reading 15% proficiency, ranked #229 of 238 in AR (top 96%) — low school quality limits family demand, transient renter base, plan for 1-2y turnover; 68% free/reduced lunch — lower-income household profile, screen leases tightly.
- Zoned schools: Fairview Elementary School (591 students, 100% FRL); Camden Fairview Middle School (math 7% / reading 19%, grade F, #188 of 201 statewide, top 94%, 519 students, 99% FRL); Camden Fairview High School (math 4% / reading 17%, grade F, #271 of 292 statewide, top 93%, 704 students, 100% FRL) — zoned schools average 100% FRL vs 68% district-wide (31 pts higher); higher-poverty schools than district average — tighter screening recommended.
- Market conditions: 133 active listings in the ZIP; 1 comparable units currently listed for rent nearby; 18 units permitted in Ouachita County in 2024 (0 in 5+ unit buildings).
Forward outlook
- Local home prices are declining (-3.0%/yr); year-one equity from $59 of loan paydown is wiped out by about $255 of value loss. Plan a longer hold.
- Ouachita County population projected at -33% by 2050 — secular population decline; favor cash flow + early exit over multi-decade hold.
- At projected returns (-3.0% appreciation + 3.0% rent growth), your $2k cash investment doubles in ~1 year — after that, you're playing with house money.
Negotiation context
- It's been on market 83 days — a 6% lower offer ($8k) is reasonable based on typical stale-listing flexibility.
- 5 sale attempts since 2y ago; this cycle's ask has dropped $1k (11%) from the opening price — seller is motivated, your offer sets the floor, not the list.
Risks & watch-outs
- Watch-outs: built in 1940 — expect roof / HVAC / electrical / plumbing capex.
Questions for the listing agent
- It's been on market 83 days. Have you received any prior offers? Is the seller open to a 6% concession, seller financing, or rate buy-down credit?
- Built in 1940 — when were the roof, HVAC, electrical panel, plumbing, and water heater last replaced?
- Why hasn't it sold? Are there any deal-killer items the seller is aware of (foundation, flood, title, zoning, code violations)?
- Is there a deadline driving the sale (1031 exchange, divorce, estate, relocation)? That informs how much negotiation room exists.
- Schools are F-rated, which usually means shorter tenancies and higher turnover. Who's the typical renter profile here, and what's been the actual vacancy rate?
- Crime grade is F in this area — have there been break-ins, vandalism, or insurance claims at this property in the last 3 years? What carrier currently insures it and at what premium?
- The area grade is low — what's the realistic commute time and amenity access for the typical tenant pool here? Any planned neighborhood developments (good or bad) we should know about?
- What's the average days-on-market for RENTAL listings here right now (not sales)? A rising rental-DOM trend means longer vacancies and softer asking-rent achievability than the comps imply.
- What's the recent tenant-quality profile in this submarket — average credit score on applications, eviction rate, late-payment / NSF rate, and stable-employment percentage? A property-management company in the area should have these aggregated.
- How much new for-sale + rental construction is in the pipeline within 1–3 miles? Heavy new supply typically softens prices + rents 12–24 months out; constrained supply supports both.
Investment metrics
- 1% rule
- 16.47% ✓
- Cap rate
- 154.88%
- Cash-on-cash
- 530.68%
- DSCR
- 24.61
- GRM
- 0.5
CMA / ARV
No comps found within radius.
Projected returns pro-forma
-3.0% appreciation · 3.0% rent growth · sell at horizon
- IRR
- —
- Equity multiple
- 28.59×
- Total profit
- $65,675
- Equity at exit
- $1,267
- IRR
- —
- Equity multiple
- 61.33×
- Total profit
- $143,580
- Equity at exit
- $735
Cash invested: $2,380 (down + closing). Projections, not guarantees.
Landlord ↔ Tenant lean methodology
- Overall (STATE)
- 92 Strongly Landlord-Friendly
- State Arkansas
- 92 Strongly Landlord-Friendly · R+14
- County
- — inherits STATE
- City
- — inherits STATE
ZIP-level market 71701
- Home prices YoY
- -20.5%
- Active inventory
- 133
- Price-to-rent
- 0.5×
Monthly cashflow live
- Estimated rent
- $1,400 medium interval (Pro) →
- Mortgage (P&I)
- −$45
- Tax from tax record
- −$5 /mo · $64/yr
- Insurance
- −$4
- HOA
- −$0
- Vacancy / Maint / Mgmt
- −$294
- Net cashflow
- $1,053
Break-even live
Sensitivity live
| Price | -10% $1,057 | -5% $1,055 | +0% $1,053 | +5% $1,050 | +10% $1,048 |
|---|---|---|---|---|---|
| Rent | -10% $942 | -5% $997 | +0% $1,053 | +5% $1,108 | +10% $1,163 |
| Rate | -1.0pp $1,057 | -0.5pp $1,055 | base $1,053 | +0.5pp $1,050 | +1.0pp $1,048 |
UW: 25.0% down · 7.5% · 30yr · 1.5% tax · 5.0% vac · 8.0% maint · 8.0% mgmt
Financing live
Cash to close
- Down payment
- $2,125
- Closing costs
- $255
- Reserves months
- —
- Total cash needed
- —
Loan-product check · same deal, 3 products live
Conventional
25% down · 7.5% · 30yr
- Down + closing
- —
- Monthly P&I
- —
- Monthly cashflow
- —
- DSCR
- —
- Eligible?
- —
Personal DTI + credit; lowest rate.
DSCR
20% down · 8.5% · 30yr
- Down + closing
- —
- Monthly P&I
- —
- Monthly cashflow
- —
- DSCR
- —
- Eligible?
- —
No personal income docs; deal must DSCR.
Hard money
10% down · 12.0% · 12mo
- Down + closing
- —
- Monthly P&I
- —
- Monthly cashflow
- —
- DSCR
- —
- Eligible?
- —
Short-term bridge; refi at stabilization.
Rent comps 1 comps
| Address | Beds | Baths | Sqft | Rent | $/sqft | DOM | Units | Dist |
|---|---|---|---|---|---|---|---|---|
| 106 Madison Ave NE Camden, AR | 1.0 | 1.0 | 650 | $1,400 | $2.15 | 45d | 1 | 0.60mi |
Listing history 15 events
-
2026-01-28status Under Contract
-
2026-01-10status Back on Market
-
2025-08-28status Under Contract
-
2025-08-23price $8,500
-
2025-08-22status Price Change
-
2025-07-01status Under Contract
-
2025-06-27status Back on Market
-
2025-04-07status Under Contract
-
2025-04-03status Back on Market
-
2025-03-27historical
-
2024-06-06status Under Contract
-
2024-06-04price $7,900
-
2024-05-08price $8,250
-
2024-04-29price $8,500
-
2024-04-15$9,500 New Listing
ⓘ Source: listings_history table (triggers on properties + properties_extension) + one-shot
backfill from property_details.listing_events for pre-trigger history.
Tax reassessment forecast AR · Resets to sale price
- Current annual tax
- $64 · $5/mo
- Projected year-2 tax
- $64 · $5/mo
- Expected delta
- $0/yr ($0/mo · 0.0%)
ⓘ Screening estimate from a state-policy table — verify with the county assessor before closing.
Nearby sold comps map
Loading sold comps map…
Walkable amenities ~0.75 mi
Loading nearby amenities…
Taxation est. · year 1
- Rental income
- $16,800
- − Mortgage interest
- −$476
- − Property taxes
- −$64
- − Insurance
- −$42
- − Repairs & maintenance
- −$1,344
- − Management
- −$1,344
- − Depreciation
- −$247
- Taxable income
- $13,282
- Est. tax owed @ 24.0%
- −$3,188
- After-tax cash flow
- $9,443/yr
For passive investors: Depreciation is non-cash, so a rental often shows a tax loss while cash-flowing — sheltering income. Rental losses are passive: they offset passive income freely, and up to $25,000/yr can offset ordinary (W-2) income if you actively participate and your MAGI is under $100k (phasing out to $0 by $150k); unused losses carry forward. On sale, claimed depreciation is recaptured at up to 25%, and gains may owe capital-gains tax (a 1031 exchange can defer both). Figures are a year-1 estimate at your 24.0% rate — not tax advice; consult a CPA.
Schools (NCES district)
- District
- Camden Fairview School District
- NCES district ID
- 0506060
- Math proficiency
- 9% ▼ -16.00%
- Reading proficiency
- 15% ▼ -12.00%
- Median HH income
- $30,854
- Composite
- 9.43/100
- National rank
- #9853
- State rank
- #229 of 238 in AR
Livability — Camden
- Score
- 57/100
- State rank
- #364
- US rank
- #22245
Category grades
Schools grade is shown separately in the Schools card above.
Census & demographics
- Census place
- Camden, AR
- City population
- 17,883
- Population (ZIP)
- 17,883
Population outlook (Ouachita County) Hauer SSP2
- Today (2025)
- 21,485 people
- By 2030
- 19,947 · -7.2%
- By 2040
- 16,990 · -20.9%
- By 2050
- 14,431 · -32.8%
- By 2075
- 10,003 · -53.4%
- By 2100
- 7,418 · -65.5%
Race, ethnicity, and origin ACS 2023
- Neighborhood character
- Diverse neighborhood (Simpson 0.56)
- Race & ethnicity
- White 53% Black 39% Hispanic / Latino 5% Two or more races 4%
- Hispanic origin (detail)
- Mexican 4%
- Common ancestry
- Slovak 2% Iranian 1% Lithuanian 1%
- Foreign-born
- 1% · Canada
- Languages at home
- 97% English-only · Spanish 3%
Political lean MEDSL · Ouachita
- 2024 margin
- R (+19.1) · D 39.5% · R 58.6% · Other 1.8%
- 2008→2024 swing
- -8.2pp toward R · 2008: -10.9pp · 2024: -19.1pp
- All cycles
- 2024: R+19.1 2020: R+13.5 2016: R+10.4 2012: R+8.6 2008: R+10.9
Not yet ingested
- Civics
- —
Market trends
- HPI YoY
- ▼ -44.10%
- Current HPI
- 171.0106
- Rent YoY
- —
- Metro
- —
- State GDP YoY
- ▲ 3.80%
- F500 in state
- 10
Industry mix (Fortune 500 HQ in AR)
| Industry | F500 HQs | Revenue |
|---|---|---|
| Retail | 1 | $681B |
|
||
| Food / Agriculture | 1 | $53B |
|
||
| Retail / Energy | 1 | $22B |
|
||
| Transportation / Logistics | 1 | $12B |
|
||
| Energy | 1 | $4B |
|
||
Price history
-10.5% since first listed15 events — show timeline
- 2026-01-28 Pending — CARMLS
- 2026-01-10 Relisted — CARMLS
- 2025-08-28 Pending — CARMLS
- 2025-08-23 Price Changed $8,500 CARMLS
- 2025-08-22 Relisted — CARMLS
- 2025-07-01 Pending — CARMLS
- 2025-06-27 Relisted — CARMLS
- 2025-04-07 Pending — CARMLS
- 2025-04-03 Relisted — CARMLS
- 2025-03-27 Listing Removed — CARMLS
- 2024-06-06 Pending — CARMLS
- 2024-06-04 Price Changed $7,900 CARMLS
- 2024-05-08 Price Changed $8,250 CARMLS
- 2024-04-29 Price Changed $8,500 CARMLS
- 2024-04-15 Listed $9,500 CARMLS
Property tax history
-5.9%/yrLatest (2025): $64 · -10.4% YoY. Source: county tax records.
Cash-flow waterfall
monthlySold comps — $/sqft
last 12 mo · ≤1 miLoading sold comps…