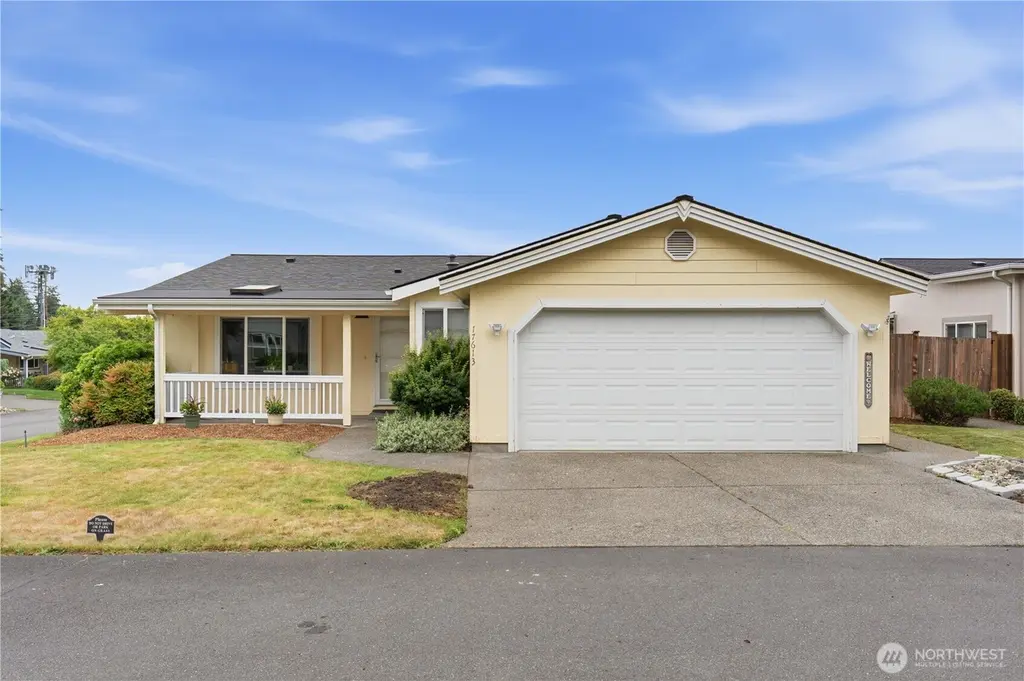
17613 18th Avenue Ct E #94 · Spanaway, WA
Flood risk 1/10 · Minimal
- FEMA flood zone
- X (unshaded)
- Chance of flooding over 30 yrs
- 0.0%
- Est. flood insurance / yr
- $507 – $1,088
Fire risk 2/10 · Minimal
- Est. fire insurance / yr
- $604 – $1,122
Heat risk 3/10 · Minor
- Hot days now (above 87°F)
- 7 days/yr
- Hot days in 30 yrs
- 15 days/yr
Wind risk 1/10 · Minimal
- Chance of severe wind over 30 yrs
- —
Air-quality risk 7/10 · Major
- Unhealthy air days now
- 9 days/yr
- Unhealthy air days in 30 yrs
- 10 days/yr
Risk factors via First Street. Map © Google.
Why this score? — see what drove the C grade
The composite is a weighted blend of 9 inputs, each scored 0–100. Each bar is that input's sub-score; the figure is the points it added to the 100-point composite (weight × sub-score).
- Cash flow +23.3/30.0
- DSCR +7.5/10.0
- ARV discount +6.6/15.0
- 1% rule +5.6/10.0
- Schools +4.9/10.0
- Livability +3.7/5.0
- Rent growth +3.6/5.0
- Condition / age +2.5/5.0
- Appreciation +0.0/10.0
$265,000
🖨 Deal sheet (PDF) 📄 Offer letter ✓ Due diligence
Listing remarks
Welcome home to this immaculately well maintained, 3-bedroom, 1.75-bath home on a corner lot in the highly desired 55+ gated community of Park Lane, known for its beautifully landscaped grounds. The pride of ownership really shows throughout this spacious rambler - separate formal living room - the open-concept, great room, features laminate flooring, a spacious well-designed kitchen with an abundance of counter space, a breakfast bar and added room for a dining table, new refrigerator and a walk-in pantry makes it perfect for everyday living and entertaining - a cozy gas family room fireplace adds warmth and charm. You’ll appreciate the year round comfort of the central heating / air
Key facts
- Gated community
- Laminate flooring
- Landscaped grounds
Tags
Property features AI
Finance
- Other: Land lease amount applies
- Financial info: Listing terms: Cash or Conventional
- HOA & community: Parklane Court manufactured home park; Park has clubhouse, high-speed internet available, and security gate; 94 homes in the park; Land lease applicable
Exterior
- Parking: Individual garage (garage included)
- Security: Security gate
- Utilities: Public water; Gas water heater (located in closet); Electric and natural gas service; TPU power; Pierce County sewer
- Home design: Manufactured home (Triple Wide); One level; Faces west; Vaulted ceilings
- Construction: Cement plank and wood siding; Composition roof; Built by KARST (model: DEVELOPER); Manufactured after 6/15/1976; Mobile home remains
- Exterior features: Corner lot; Curbs; Paved; Patio/porch/deck; Landscaped
Interior
- Kitchen: Dishwasher; Microwave; Refrigerator; Stove/Range; Walk-in pantry
- Bedrooms: 3 bedrooms
- Flooring: Ceramic tile; Laminate; Carpet
- Bathrooms: 1 full bath; 1 three-quarter bath
- Heating & cooling: Forced air heating; Central air conditioning
- Interior features: Fireplace (gas); Water heater
- Laundry & utility: Washer; Dryer
Neighborhood map
What this means for you Summary
Snapshot
- This is a 3-bed/2.0-bath manufactured listed at $265k.
Deal economics
- At list price, monthly cash flow is $486 ($6k/yr) — positive.
- The deal already cash-flows at list — no discount required.
- Meets the 1% rule at list price ($3k rent vs $265k).
- Cap rate 8.5% vs local median 3.6% in Spanaway — top-decile yield for the area; either an underpriced asset or a hidden risk that comps aren't pricing in. Stress-test before assuming the spread holds.
Location & tenants
- Location reads 74/100 on livability (#184 in WA, #4,891 nationally) — a middle-class / working-renter tenant base. Strengths: housing A+, employment A, commute A-; Watch: cost of living C-, health & safety C-, crime D-.
- Bethel School District (suburban): math 47% / reading 59% proficiency, ranked #103 of 291 in WA (top 35%) — acceptable for families but not a draw, mixed tenant base, ~2y average lease.
- Zoned schools: Clover Creek Elementary (630 students, 51% FRL); Spanaway Lake High School (1,817 students, 64% FRL) — zoned schools average 57% FRL vs 36% district-wide (21 pts higher); higher-poverty schools than district average — tighter screening recommended.
- Market conditions: Rents rising fast (+4.2%/yr); 388 active listings in the ZIP; 13 comparable units currently listed for rent nearby; rentals at typical pace (median 20d on market — plan ~3-4 weeks tenant-placement turnaround); solid renter incomes; 3,209 units permitted in Pierce County in 2024 (1,269 in 5+ unit buildings).
- This rent runs 32% of the median local income ($107k/yr) — at the standard rent-burdened threshold; future hikes will face affordability resistance.
Forward outlook
- Local home prices are declining (-3.0%/yr); year-one equity from $2k of loan paydown is wiped out by about $8k of value loss. Plan a longer hold.
- Pierce County population projected at +26% by 2050 — long-run rental-demand tailwind backs the buy-and-hold thesis.
Negotiation context
- Only 9 days on market — expect competitive offers; lowballing is unlikely to land.
- 5 sale attempts since 11y ago with the ask held roughly flat each time — persistent listings suggest the price (not the market) is what's stuck; bring a comps-based counter.
Questions for the listing agent
- Is there a deadline driving the sale (1031 exchange, divorce, estate, relocation)? That informs how much negotiation room exists.
- Schools are B-rated — typically a magnet for longer-tenancy family renters. What's the average tenant stay here, and is there a school-zone premium baked into asking?
- Crime grade is D in this area — have there been break-ins, vandalism, or insurance claims at this property in the last 3 years? What carrier currently insures it and at what premium?
- What's the average days-on-market for RENTAL listings here right now (not sales)? A rising rental-DOM trend means longer vacancies and softer asking-rent achievability than the comps imply.
- What's the recent tenant-quality profile in this submarket — average credit score on applications, eviction rate, late-payment / NSF rate, and stable-employment percentage? A property-management company in the area should have these aggregated.
- How much new for-sale + rental construction is in the pipeline within 1–3 miles? Heavy new supply typically softens prices + rents 12–24 months out; constrained supply supports both.
Investment metrics
- 1% rule
- 1.06% ✓
- Cap rate
- 8.49%
- Cash-on-cash
- 7.86%
- DSCR
- 1.35
- GRM
- 7.9
CMA / ARV
- ARV (on-the-fly)
- $259,720
- Comps found
- 6
Show comp detail 6 sales within ~0.75 mi
| Address | Dist | Beds/Ba | Sqft | Sold | Price | $/sf | Match |
|---|---|---|---|---|---|---|---|
| 17722 19th Avenue Ct E #76 | 0.11mi | 3/2.0 | 1,773 (+3%) | 1mo | $220,000 | $124 | 89 |
| 17612 19th Ave E #83 | 0.02mi | 3/2.0 | 1,697 (-1%) | 11mo | $269,350 | $159 | 88 |
| 17626 19th Avenue Ct E | 0.07mi | 3/2.0 | 1,774 (+3%) | 15mo | $247,000 | $139 | 79 |
| 17606 18th Avenue Ct E | 0.03mi | 3/2.0 | 1,774 (+3%) | 18mo | $205,000 | $116 | 79 |
| 17715 18th Avenue Ct E | 0.08mi | 3/2.0 | 1,599 (-7%) | 20mo | $245,000 | $153 | 68 |
| 2020 177th Street Ct E #42 | 0.16mi | 3/2.0 | 1,592 (-7%) | 14mo | $240,000 | $151 | 68 |
Match score weights: distance 35% · size 25% · config 20% · recency 20%. Top-matched comps best support the ARV.
Projected returns pro-forma
-3.0% appreciation · 4.24% rent growth · sell at horizon
- IRR
- -3.0%
- Equity multiple
- 0.89×
- Total profit
- $-8,469
- Equity at exit
- $39,512
- IRR
- 8.0%
- Equity multiple
- 1.64×
- Total profit
- $47,336
- Equity at exit
- $22,912
Cash invested: $74,200 (down + closing). Projections, not guarantees.
Landlord ↔ Tenant lean methodology
- Overall (STATE)
- 28 Tenant-Leaning
- State Washington
- 28 Tenant-Leaning · D+8
- County
- — inherits STATE
- City
- — inherits STATE
ZIP-level market 98387
- Rents YoY
- 4.2%
- Active inventory
- 388
- Price-to-rent
- 7.9×
Monthly cashflow live
- Estimated rent
- $2,811 high interval (Pro) →
- Mortgage (P&I)
- −$1,390
- Tax from tax record
- −$235 /mo · $2,817/yr
- Insurance
- −$110
- HOA
- −$0
- Vacancy / Maint / Mgmt
- −$590
- Net cashflow
- $486
Break-even live
Sensitivity live
| Price | -10% $636 | -5% $561 | +0% $486 | +5% $411 | +10% $336 |
|---|---|---|---|---|---|
| Rent | -10% $264 | -5% $375 | +0% $486 | +5% $597 | +10% $708 |
| Rate | -1.0pp $619 | -0.5pp $553 | base $486 | +0.5pp $417 | +1.0pp $347 |
UW: 25.0% down · 7.5% · 30yr · 1.5% tax · 5.0% vac · 8.0% maint · 8.0% mgmt
Financing live
Cash to close
- Down payment
- $66,250
- Closing costs
- $7,950
- Reserves months
- —
- Total cash needed
- —
Loan-product check · same deal, 3 products live
Conventional
25% down · 7.5% · 30yr
- Down + closing
- —
- Monthly P&I
- —
- Monthly cashflow
- —
- DSCR
- —
- Eligible?
- —
Personal DTI + credit; lowest rate.
DSCR
20% down · 8.5% · 30yr
- Down + closing
- —
- Monthly P&I
- —
- Monthly cashflow
- —
- DSCR
- —
- Eligible?
- —
No personal income docs; deal must DSCR.
Hard money
10% down · 12.0% · 12mo
- Down + closing
- —
- Monthly P&I
- —
- Monthly cashflow
- —
- DSCR
- —
- Eligible?
- —
Short-term bridge; refi at stabilization.
Rent comps 13 comps
| Address | Beds | Baths | Sqft | Rent | $/sqft | DOM | Units | Dist |
|---|---|---|---|---|---|---|---|---|
| 17724 17th Ave E Spanaway, WA | 3.0 | 2.5 | 1761 | $2,550 | $1.45 | 25d | 1 | 0.17mi |
| 17813 22nd Ave E Tacoma, WA | 3.0–4.0 | 2.5 | 1800 | $2,895 | $1.61 | 25d | 1 | 0.31mi |
| 2402 177th Street Ct E Tacoma, WA | 3.0 | 2.0 | 1400 | $2,450 | $1.75 | 0d | 1 | 0.36mi |
| 17517 29th Ave E Tacoma, WA | 4.0 | 3.0 | 1875 | $3,195 | $1.70 | 3d | 1 | 0.69mi |
| 18610 29th Ave E Tacoma, WA | 3.0 | 2.5 | 1384 | $2,750 | $1.99 | 19d | 1 | 0.92mi |
| 2304 190th St E Tacoma, WA | 3.0 | 2.5 | 2154 | $2,850 | $1.32 | 4d | 1 | 0.95mi |
| 19128 23rd Avenue Ct E Tacoma, WA | 3.0 | 2.5 | 1702 | $1,500 | $0.88 | 0d | 1 | 1.04mi |
| 15909 18th Avenue Ct E Tacoma, WA | 2.0 | 1.5 | 1050 | $2,050 | $1.95 | 25d | 1 | 1.07mi |
| 619 187th St E Spanaway, WA | 3.0 | 2.0 | 1430 | $2,779 | $1.94 | 25d | 1 | 1.09mi |
| 19411 21st Avenue Ct E Spanaway, WA | 4.0 | 2.5 | 1880 | $2,900 | $1.54 | 25d | 1 | 1.15mi |
| 16007 29th Avenue Ct E Unit 16007 Tacoma, WA | 3.0 | 2.5 | 1510 | $2,550 | $1.69 | 25d | 1 | 1.20mi |
| 19906 18th Avenue Ct E Spanaway, WA | 3.0 | 2.5 | 1393 | $2,800 | $2.01 | 19d | 1 | 1.44mi |
| 17412 44th Ave E Tacoma, WA | 1.0–3.0 | 1.0–2.0 | 928 | $2,346 | $2.53 | 0d | 17 | 1.46mi |
Listing history 7 events
-
2026-06-21days on market $265,000 Active 9 DOM
-
2026-06-18days on market $265,000 Active 6 DOM
-
2026-06-17days on market $265,000 Active 5 DOM
-
2026-06-16days on market $265,000 Active 4 DOM
-
2026-06-15days on market $265,000 Active 3 DOM
-
2026-06-13remarks 693-char remark
-
2026-06-13$265,000 Active 1 DOM
ⓘ Source: listings_history table (triggers on properties + properties_extension) + one-shot
backfill from property_details.listing_events for pre-trigger history.
Tax reassessment forecast WA · Resets to sale price
- Current annual tax
- $2,817 · $235/mo
- Projected year-2 tax
- $2,817 · $235/mo
- Expected delta
- $0/yr ($0/mo · 0.0%)
ⓘ Screening estimate from a state-policy table — verify with the county assessor before closing.
Climate risk First Street
- Flood 1/10 Low FEMA zone X (unshaded) · 0% chance over 30 yrs
- Wildfire 2/10 Low
- Heat 3/10 Moderate 7 d/yr ≥87°F today · 15 d/yr by 30 yrs out
- Wind 1/10 Low
- Air quality 7/10 Severe 9 unhealthy d/yr today · 10 by 30 yrs out
Nearby sold comps map
Loading sold comps map…
Walkable amenities ~0.75 mi
Loading nearby amenities…
Taxation est. · year 1
- Rental income
- $33,731
- − Mortgage interest
- −$14,844
- − Property taxes
- −$2,817
- − Insurance
- −$1,325
- − Repairs & maintenance
- −$2,698
- − Management
- −$2,698
- − Depreciation
- −$7,709
- Taxable income
- $1,639
- Est. tax owed @ 24.0%
- −$393
- After-tax cash flow
- $5,436/yr
For passive investors: Depreciation is non-cash, so a rental often shows a tax loss while cash-flowing — sheltering income. Rental losses are passive: they offset passive income freely, and up to $25,000/yr can offset ordinary (W-2) income if you actively participate and your MAGI is under $100k (phasing out to $0 by $150k); unused losses carry forward. On sale, claimed depreciation is recaptured at up to 25%, and gains may owe capital-gains tax (a 1031 exchange can defer both). Figures are a year-1 estimate at your 24.0% rate — not tax advice; consult a CPA.
Schools (NCES district)
- District
- Bethel School District
- NCES district ID
- 5300480
- Math proficiency
- 47% ▬ 0.00%
- Reading proficiency
- 59% ▲ 2.00%
- Median HH income
- $65,872
- Composite
- 48.66/100
- National rank
- #4568
- State rank
- #103 of 291 in WA
Livability — Spanaway
- Score
- 74/100
- State rank
- #184
- US rank
- #4891
Category grades
Schools grade is shown separately in the Schools card above.
Census & demographics
- Census place
- Spanaway, WA
- County
- Pierce County · 788,257 people
- City population
- 50,774
- Metro
- Seattle-Tacoma-Bellevue, WA
- Population (ZIP)
- 50,774
- Household income
- $106,872
- Rent vs Own
- Severe rent burden
- 807.0
Population outlook (Pierce County) Hauer SSP2
- Today (2025)
- 956,648 people
- By 2030
- 1,010,862 · +5.7%
- By 2040
- 1,113,170 · +16.4%
- By 2050
- 1,206,524 · +26.1%
- By 2075
- 1,436,425 · +50.2%
- By 2100
- 1,563,654 · +63.5%
Race, ethnicity, and origin ACS 2023
- Neighborhood character
- Diverse neighborhood (Simpson 0.68)
- Race & ethnicity
- White 53% Two or more races 18% Hispanic / Latino 16% Black 10% Asian 6% Pacific Islander 4%
- Hispanic origin (detail)
- Mexican 10% Puerto Rican 2%
- Common ancestry
- Portuguese 3% Italian 3% Slovak 2%
- Foreign-born
- 11% · Canada, South Korea
- Languages at home
- 82% English-only · Spanish 7% Russian/Polish/Slavic 2% Other Asian/Pacific 2%
Political lean MEDSL · Pierce
- 2024 margin
- D (+10.8) · D 53.9% · R 43.1% · Other 3.0%
- 2008→2024 swing
- -1.4pp toward R · 2008: 12.2pp · 2024: 10.8pp
- All cycles
- 2024: D+10.8 2020: D+11.2 2016: D+7.5 2012: D+11.0 2008: D+12.2
Not yet ingested
- Civics
- —
Market trends
- HPI YoY
- ▼ -208.94%
- Current HPI
- 308.0462
- Rent YoY
- ▲ 4.24%
- Metro
- Seattle-Tacoma-Bellevue, WA
- State GDP YoY
- ▲ 4.65%
- F500 in state
- 22
Industry mix (Fortune 500 HQ in WA)
| Industry | F500 HQs | Revenue |
|---|---|---|
| Retail | 2 | $269B |
|
||
| Technology / Retail | 1 | $638B |
|
||
| Technology | 1 | $245B |
|
||
| Telecommunications | 1 | $38B |
|
||
| Food / Beverage | 1 | $36B |
|
||
| Automotive / Trucks | 1 | $34B |
|
||
Price history
+194.6% since first listed15 events — show timeline
- 2026-06-12 Listed $265,000 NWMLS as Distributed by MLS Grid
- 2025-02-26 Sold (MLS) $245,000 NWMLS as Distributed by MLS Grid
- 2025-02-06 Pending — NWMLS as Distributed by MLS Grid
- 2024-10-14 Price Changed $250,000 NWMLS as Distributed by MLS Grid
- 2024-09-15 Listed $259,950 NWMLS as Distributed by MLS Grid
- 2017-07-12 Sold (MLS) $95,000 NWMLS as Distributed by MLS Grid
- 2017-06-08 Pending — NWMLS as Distributed by MLS Grid
- 2017-05-11 Relisted — NWMLS as Distributed by MLS Grid
- 2017-04-05 Pending — NWMLS as Distributed by MLS Grid
- 2017-03-10 Price Changed $99,000 NWMLS as Distributed by MLS Grid
- 2017-01-24 Price Changed $113,000 NWMLS as Distributed by MLS Grid
- 2017-01-24 Listed $11,300 NWMLS as Distributed by MLS Grid
- 2015-08-07 Sold (MLS) $85,000 NWMLS as Distributed by MLS Grid
- 2015-08-03 Pending — NWMLS as Distributed by MLS Grid
- 2015-07-21 Listed $89,950 NWMLS as Distributed by MLS Grid
Property tax history
+2.1%/yrLatest (2026): $2,817 · -3.6% YoY. Source: county tax records.
Cash-flow waterfall
monthlySold comps — $/sqft
last 12 mo · ≤1 miLoading sold comps…