 Triplex
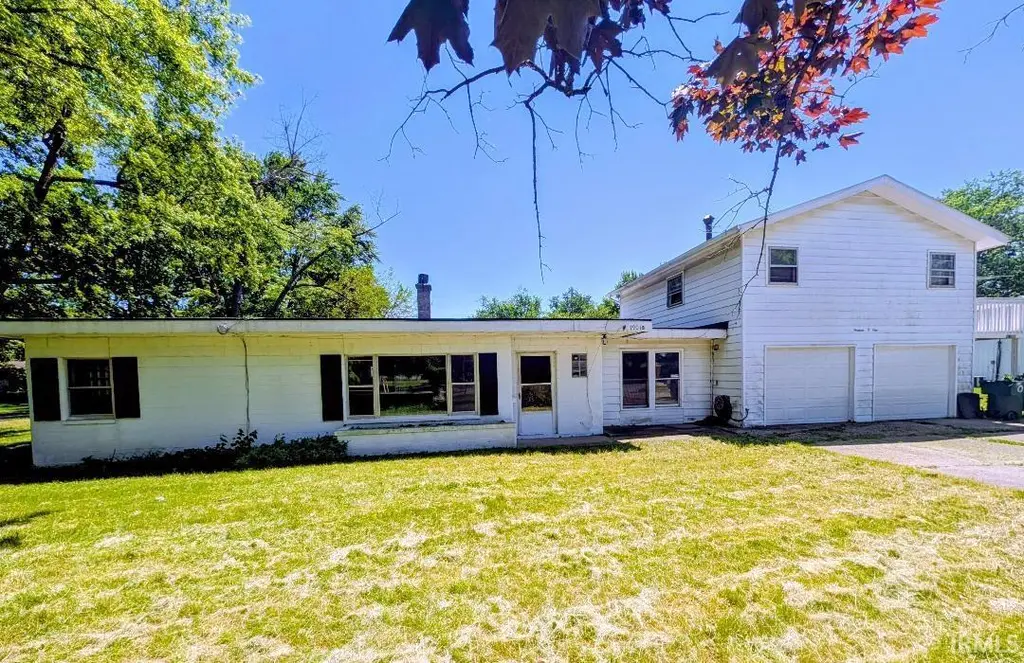
1901 W Riggin Rd · Muncie, IN
Flood risk 6/10 · Moderate
- FEMA flood zone
- AE
- Chance of flooding over 30 yrs
- 0.75%
- Est. flood insurance / yr
- $1,737 – $8,500
Fire risk 1/10 · Minimal
- Est. fire insurance / yr
- $717 – $1,331
Heat risk 3/10 · Minor
- Hot days now (above 100°F)
- 7 days/yr
- Hot days in 30 yrs
- 18 days/yr
Wind risk 2/10 · Minimal
- Chance of severe wind over 30 yrs
- 1.0%
Air-quality risk 3/10 · Minor
- Unhealthy air days now
- 2 days/yr
- Unhealthy air days in 30 yrs
- 3 days/yr
Risk factors via First Street. Map © Google.
Why this score? — see what drove the B grade
The composite is a weighted blend of 9 inputs, each scored 0–100. Each bar is that input's sub-score; the figure is the points it added to the 100-point composite (weight × sub-score).
- Cash flow +30.0/30.0
- ARV discount +10.9/15.0
- 1% rule +10.0/10.0
- DSCR +10.0/10.0
- Rent growth +4.5/5.0
- Livability +4.0/5.0
- Condition / age +2.5/5.0
- Schools +1.7/10.0
- Appreciation +0.0/10.0
$159,900
🖨 Deal sheet (PDF) 📄 Offer letter ✓ Due diligence
Multi-family units
County records classify this as Multi-Family (2-4 Unit). Listing-text estimate: 3 units. confirmed
Listing remarks
Great rental opportunity! This triplex offers a main Unit that has new Vinyl Plank Flooring, New paint, New toilet, sink and tub surround. The main unit also has 2 bedrooms, Large Living Room, Kitchen, Laundry area and walk in pantry. There is an addition room that could be a family room or you could use it as a 3rd bedroom (Closet right outside the door). This unit also has access to the 2 car attached garage and large fenced back yard. Upstairs unit #2 has a large living room/dining room space, small Kitchen, 1 bedroom and bathroom with vinyl flooring. Downstairs back unit #3 is a studio apartment with a small Kitchen and Bathroom. Each unit has their own utilities. Appliances in the unit
Key facts
- Fenced back yard
- Attached garage
- New paint
Tags
Property features AI
Finance
- Other: Pets allowed with breed restrictions
Exterior
- Parking: Garage; Off-street parking; Gravel parking; Approximately 7 open parking spaces
- Utilities: Public water; Public sewer; Cable available
- Home design: Residential income property (triplex); Single-story; Entry level: main level
- Construction: Aluminum siding and block construction; Shingle roof; Slab foundation; Built as a triplex
- Exterior features: Patio; Porch; Corner lot; Level lot
Interior
- Kitchen: Eat-in kitchen
- Flooring: Vinyl flooring
- Bathrooms: Three full bathrooms; Five main-level bathrooms
- Heating & cooling: Forced air heating; Window unit cooling
- Interior features: Eat-in kitchen
- Laundry & utility: Washer hookup
Neighborhood map
What this means for you Summary
Snapshot
- This is a 2×5bd/3.0ba + 1×1bd/1.0ba units multifamily listed at $160k.
Deal economics
- At list price, monthly cash flow is $2k ($22k/yr) — positive. Per door: $599/mo.
- The deal already cash-flows at list — no discount required.
- Meets the 1% rule at list price ($4k rent vs $160k).
- Recommended offer: $158k (1.5% below list) — sets the bar for market timing.
- Cap rate 23.0% vs local median 6.0% in Muncie — top-decile yield for the area; either an underpriced asset or a hidden risk that comps aren't pricing in. Stress-test before assuming the spread holds.
Location & tenants
- Location reads 80/100 on livability (#18 in IN, #1,654 nationally) — a professional / high-income tenant draw. Strengths: amenities A+, commute A+, cost of living A+; Watch: crime F, employment F.
- Muncie Community Schools (urban): math 18% / reading 25% proficiency, ranked #275 of 301 in IN (top 91%) — low school quality limits family demand, transient renter base, plan for 1-2y turnover; 68% free/reduced lunch — lower-income household profile, screen leases tightly.
- Zoned schools: Northside Middle School (math 17% / reading 36%, grade F, #236 of 330 statewide, top 72%, 583 students, 70% FRL) — zoned schools at 70% FRL track the district average.
- Market conditions: Rents rising fast (+8.1%/yr); 202 active listings in the ZIP; 171 units permitted in Delaware County in 2024 (57 in 5+ unit buildings).
- At $4,131/mo this rent would consume 78% of the median local household income ($63k/yr) (locally 1141% of renters already pay >50% of income on rent) — very limited rent-growth headroom before tenants either downsize or default.
Forward outlook
- Local home prices are declining (-3.0%/yr); year-one equity from $1k of loan paydown is wiped out by about $5k of value loss. Plan a longer hold.
- Delaware County population projected at -11% by 2050 — secular population decline; favor cash flow + early exit over multi-decade hold.
- At projected returns (-3.0% appreciation + 8.0% rent growth), your $45k cash investment doubles in ~3 years — after that, you're playing with house money.
Negotiation context
- It's been on market 17 days — a 2% lower offer ($158k) is reasonable based on typical stale-listing flexibility.
- 7 sale attempts since 20y ago with the ask held roughly flat each time — persistent listings suggest the price (not the market) is what's stuck; bring a comps-based counter.
Risks & watch-outs
- Watch-outs: flood insurance adds $427/mo; built in 1953 — expect roof / HVAC / electrical / plumbing capex.
- Climate carrying-cost: in FEMA flood zone AE (mandatory federal flood insurance) — expect insurance premiums to compound above CPI over the hold.
Questions for the listing agent
- Can we see the unit-by-unit rent roll, current vacancy, and any below-market leases? What's the average tenancy length?
- What capital expenditures (roof, boiler, parking lot, exteriors) have been made in the last 5 years, and what's planned in the next 2?
- Built in 1953 — when were the roof, HVAC, electrical panel, plumbing, and water heater last replaced?
- What's the actual annual flood-insurance premium (NFIP or private), and is the property in a SFHA with mandatory coverage?
- Is there a deadline driving the sale (1031 exchange, divorce, estate, relocation)? That informs how much negotiation room exists.
- Schools are D-rated, which usually means shorter tenancies and higher turnover. Who's the typical renter profile here, and what's been the actual vacancy rate?
- Crime grade is F in this area — have there been break-ins, vandalism, or insurance claims at this property in the last 3 years? What carrier currently insures it and at what premium?
- What's the average days-on-market for RENTAL listings here right now (not sales)? A rising rental-DOM trend means longer vacancies and softer asking-rent achievability than the comps imply.
- What's the recent tenant-quality profile in this submarket — average credit score on applications, eviction rate, late-payment / NSF rate, and stable-employment percentage? A property-management company in the area should have these aggregated.
- How much new apartment / multifamily construction is in the pipeline within 1–3 miles? Heavy new supply (>2% of stock underway) typically softens rents 12–24 months out; light construction supports rent growth.
Investment metrics
- 1% rule
- 2.58% ✓
- Cap rate
- 22.98%
- Cash-on-cash
- 59.60%
- DSCR
- 3.65
- GRM
- 3.2
CMA / ARV
- ARV (median comp)
- $172,896
- List price
- $159,900
- Delta
- -5.20%
- Verdict
- FAIR
- Comps
- 2 within 2.0 mi
Projected returns pro-forma
-3.0% appreciation · 8.0% rent growth · sell at horizon
- IRR
- 52.0%
- Equity multiple
- 3.47×
- Total profit
- $110,675
- Equity at exit
- $23,842
- IRR
- 59.5%
- Equity multiple
- 8.69×
- Total profit
- $344,292
- Equity at exit
- $13,825
Cash invested: $44,772 (down + closing). Projections, not guarantees.
Landlord ↔ Tenant lean methodology
- Overall (STATE)
- 90 Strongly Landlord-Friendly
- State Indiana
- 90 Strongly Landlord-Friendly · R+11
- County
- — inherits STATE
- City
- — inherits STATE
ZIP-level market 47304
- Home prices YoY
- -28.4%
- Rents YoY
- 8.1%
- Active inventory
- 202
- Price-to-rent
- 8.2×
Monthly cashflow live
- Estimated rent
- $4,131 medium interval (Pro) →
- Mortgage (P&I)
- −$839
- Tax from tax record
- −$134 /mo · $1,614/yr
- Insurance
- −$67
- Flood insurance flood zone
- −$427 /mo · $5,118/yr
- HOA
- −$0
- Vacancy / Maint / Mgmt
- −$868
- Net cashflow
- $1,797
Break-even live
Sensitivity live
| Price | -10% $1,888 | -5% $1,843 | +0% $1,797 | +5% $1,752 | +10% $1,707 |
|---|---|---|---|---|---|
| Rent | -10% $1,471 | -5% $1,634 | +0% $1,797 | +5% $1,960 | +10% $2,124 |
| Rate | -1.0pp $1,878 | -0.5pp $1,838 | base $1,797 | +0.5pp $1,756 | +1.0pp $1,714 |
3-unit breakdown (identical units grouped — click to expand)
| Units | Beds | Baths | Est. rent |
|---|---|---|---|
| 2× units | 5 | 3 | $3,264 |
| #1 | 5 | 3 | $1,632 |
| #2 | 5 | 3 | $1,632 |
| 1× unit | 1 | 1 | $867 |
| Total (3 units) | $4,131 | ||
UW: 25.0% down · 7.5% · 30yr · 1.5% tax · 5.0% vac · 8.0% maint · 8.0% mgmt
Financing live
Cash to close
- Down payment
- $39,975
- Closing costs
- $4,797
- Reserves months
- —
- Total cash needed
- —
Loan-product check · same deal, 3 products live
Conventional
25% down · 7.5% · 30yr
- Down + closing
- —
- Monthly P&I
- —
- Monthly cashflow
- —
- DSCR
- —
- Eligible?
- —
Personal DTI + credit; lowest rate.
DSCR
20% down · 8.5% · 30yr
- Down + closing
- —
- Monthly P&I
- —
- Monthly cashflow
- —
- DSCR
- —
- Eligible?
- —
No personal income docs; deal must DSCR.
Hard money
10% down · 12.0% · 12mo
- Down + closing
- —
- Monthly P&I
- —
- Monthly cashflow
- —
- DSCR
- —
- Eligible?
- —
Short-term bridge; refi at stabilization.
Listing history 23 events
-
2026-06-19days on market $159,900 Active 17 DOM
-
2026-06-18days on market $159,900 Active 16 DOM
-
2026-06-17days on market $159,900 Active 15 DOM
-
2026-06-16days on market $159,900 Active 14 DOM
-
2026-06-15days on market $159,900 Active 13 DOM
-
2026-06-14days on market $159,900 Active 11 DOM
-
2026-06-13days on market $159,900 Active 10 DOM
-
2026-06-10days on market $159,900 Active 8 DOM
-
2026-06-09days on market $159,900 Active 7 DOM
-
2026-06-08days on market $159,900 Active 6 DOM
-
2026-06-07days on market $159,900 Active 5 DOM
-
2026-06-05days on market $159,900 Active 2 DOM
-
2026-06-03remarks 699-char remark
-
2026-06-03pricestatusdays on market $159,900 Active 1 DOM
-
2026-04-01$163,900 Active
-
2025-09-24$169,900 Active
-
2021-04-28historical
-
2021-01-11$119,900
-
2021-01-11$119,900
-
2007-10-12historical
-
2007-04-12$99,900
-
2007-02-08historical
-
2006-08-08$99,900
ⓘ Source: listings_history table (triggers on properties + properties_extension) + one-shot
backfill from property_details.listing_events for pre-trigger history.
Tax reassessment forecast IN · Partial reset (capped growth)
- Current annual tax
- $1,614 · $134/mo
- Projected year-2 tax
- $1,614 · $134/mo
- Expected delta
- $0/yr ($0/mo · 0.0%)
ⓘ Screening estimate from a state-policy table — verify with the county assessor before closing.
Climate risk First Street
- Flood 6/10 Major FEMA zone AE · 75% chance over 30 yrs
- Wildfire 1/10 Low
- Heat 3/10 Moderate 7 d/yr ≥100°F today · 18 d/yr by 30 yrs out
- Wind 2/10 Low 100% chance of damaging wind over 30 yrs
- Air quality 3/10 Moderate 2 unhealthy d/yr today · 3 by 30 yrs out
Nearby sold comps map
Loading sold comps map…
Walkable amenities ~0.75 mi
Loading nearby amenities…
Taxation est. · year 1
- Rental income
- $49,572
- − Mortgage interest
- −$8,957
- − Property taxes
- −$1,614
- − Insurance
- −$5,918
- − Repairs & maintenance
- −$3,966
- − Management
- −$3,966
- − Depreciation
- −$4,652
- Taxable income
- $20,500
- Est. tax owed @ 24.0%
- −$4,920
- After-tax cash flow
- $16,648/yr
For passive investors: Depreciation is non-cash, so a rental often shows a tax loss while cash-flowing — sheltering income. Rental losses are passive: they offset passive income freely, and up to $25,000/yr can offset ordinary (W-2) income if you actively participate and your MAGI is under $100k (phasing out to $0 by $150k); unused losses carry forward. On sale, claimed depreciation is recaptured at up to 25%, and gains may owe capital-gains tax (a 1031 exchange can defer both). Figures are a year-1 estimate at your 24.0% rate — not tax advice; consult a CPA.
Schools (NCES district)
- District
- Muncie Community Schools
- NCES district ID
- 1807320
- Math proficiency
- 18% ▼ -9.00%
- Reading proficiency
- 25% ▼ -4.00%
- Median HH income
- $30,052
- Composite
- 17.22/100
- National rank
- #9099
- State rank
- #275 of 301 in IN
Livability — Muncie
- Score
- 80/100
- State rank
- #18
- US rank
- #1654
Category grades
Schools grade is shown separately in the Schools card above.
Census & demographics
- Census place
- Muncie, IN
- County
- Delaware County · 84,658 people
- City population
- 84,658
- Metro
- Muncie, IN
- Population (ZIP)
- 31,237
- Household income
- $63,215
- Rent vs Own
- Severe rent burden
- 1141.0
Population outlook (Delaware County) Hauer SSP2
- Today (2025)
- 113,036 people
- By 2030
- 111,313 · -1.5%
- By 2040
- 106,432 · -5.8%
- By 2050
- 100,747 · -10.9%
- By 2075
- 91,000 · -19.5%
- By 2100
- 80,687 · -28.6%
Race, ethnicity, and origin ACS 2023
- Neighborhood character
- Predominantly White (85%)
- Race & ethnicity
- White 85% Two or more races 5% Black 4% Asian 4% Hispanic / Latino 3%
- Common ancestry
- Lithuanian 2% Romanian 2% Slovak 1%
- Foreign-born
- 5% · Canada, Vietnam, China
- Languages at home
- 94% English-only · Spanish 2% Other Indo-European 1% Vietnamese 1%
Political lean MEDSL · Delaware
- 2024 margin
- R (+15.8) · D 41.2% · R 57.0% · Other 1.8%
- 2008→2024 swing
- -30.8pp toward R · 2008: 15.0pp · 2024: -15.8pp
- All cycles
- 2024: R+15.8 2020: R+13.2 2016: R+13.7 2012: D+3.1 2008: D+15.0
Not yet ingested
- Civics
- —
Market trends
- HPI YoY
- ▼ -78.53%
- Current HPI
- 197.5213
- Rent YoY
- ▲ 8.08%
- Metro
- Muncie, IN
- State GDP YoY
- ▲ 2.90%
- F500 in state
- 18
Industry mix (Fortune 500 HQ in IN)
| Industry | F500 HQs | Revenue |
|---|---|---|
| Industrial Machinery | 2 | $37B |
|
||
| Healthcare | 1 | $177B |
|
||
| Pharmaceuticals | 1 | $45B |
|
||
| Metals / Steel | 1 | $18B |
|
||
| Agriculture | 1 | $17B |
|
||
| Packaging | 1 | $12B |
|
||
Price history
+60.1% since first listed10 events — show timeline
- 2026-06-02 Listed $159,900 IRMLS
- 2026-04-01 Listed $163,900 IRMLS
- 2025-09-24 Listed $169,900 IRMLS
- 2021-04-28 Listing Removed — MIBOR as Distributed by MLS Grid
- 2021-01-11 Listed $119,900 MIBOR as Distributed by MLS Grid
- 2021-01-11 Listed $119,900 IRMLS
- 2007-10-12 Listing Removed — MIBOR as Distributed by MLS Grid
- 2007-04-12 Listed $99,900 MIBOR as Distributed by MLS Grid
- 2007-02-08 Listing Removed — MIBOR as Distributed by MLS Grid
- 2006-08-08 Listed $99,900 MIBOR as Distributed by MLS Grid
Property tax history
-7.1%/yrLatest (2024): $1,614 · -9.6% YoY. Source: county tax records.
Cash-flow waterfall
monthlySold comps — $/sqft
last 12 mo · ≤1 miLoading sold comps…