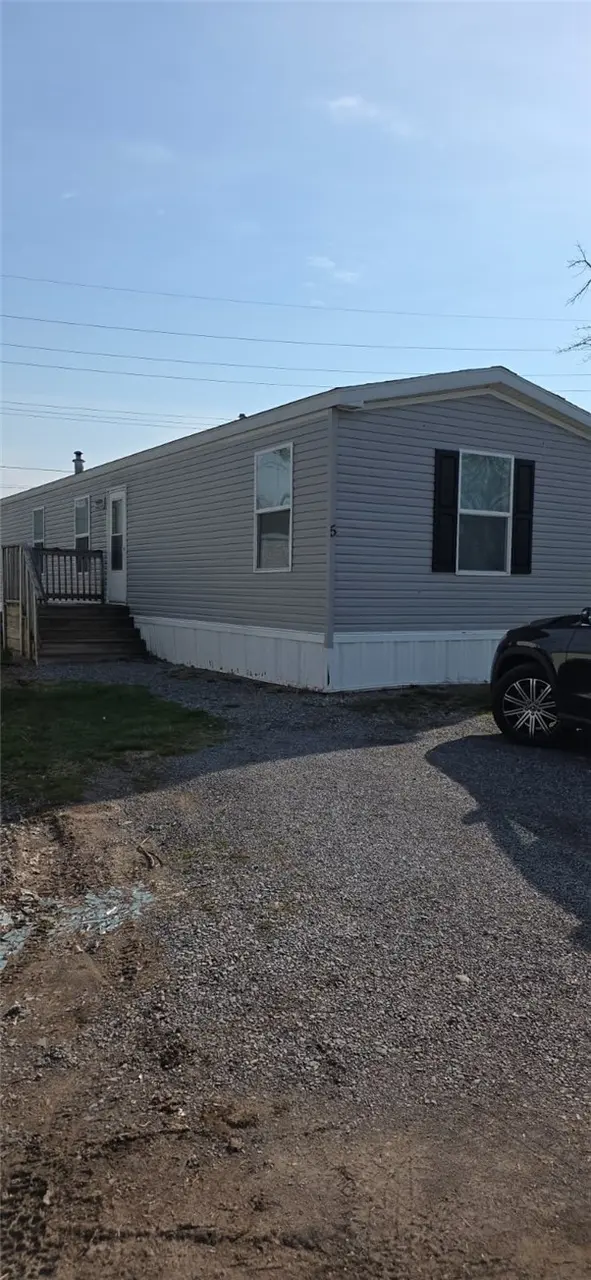
129 Saltonstall, Lot 5 St · Canandaigua, NY
Flood risk 1/10 · Minimal
- FEMA flood zone
- X
- Chance of flooding over 30 yrs
- 0.0%
- Est. flood insurance / yr
- $473 – $860
Fire risk 2/10 · Minimal
- Est. fire insurance / yr
- $691 – $1,283
Heat risk 2/10 · Minimal
- Hot days now (above 96°F)
- 7 days/yr
- Hot days in 30 yrs
- 16 days/yr
Wind risk 1/10 · Minimal
- Chance of severe wind over 30 yrs
- —
Air-quality risk 2/10 · Minimal
- Unhealthy air days now
- 0 days/yr
- Unhealthy air days in 30 yrs
- 1 days/yr
Risk factors via First Street. Map © Google.
Why this score? — see what drove the D grade
The composite is a weighted blend of 9 inputs, each scored 0–100. Each bar is that input's sub-score; the figure is the points it added to the 100-point composite (weight × sub-score).
- Cash flow +15.0/30.0
- 1% rule +5.0/10.0
- DSCR +5.0/10.0
- Schools +4.7/10.0
- Rent growth +4.6/5.0
- Livability +3.8/5.0
- ARV discount +2.7/15.0
- Condition / age +2.5/5.0
- Appreciation +0.0/10.0
$54,900
🖨 Deal sheet 📄 Offer letter ✓ Due diligence
Listing remarks MLS
Beautiful 2019 (16x66)3 bedroom, 2 bath mobile home located in beautiful Canandaigua. This is 2 feet wider than a traditional mobile home. Near walking trails, shopping, movie theater and beautiful Canandaigua Lake. Home has been freshly painted, new flooring, new fixtures, cleaned. All applicants must be park approved. Central air condition is being sold in as is condition.
Key facts
- Built 2019
- Listed 59 days
Neighborhood map
What this means for you Summary
Snapshot
- This is a 5-bed/3.5-bath land listed at $55k.
Deal economics
- At list price, monthly cash flow is $2k ($20k/yr) — positive.
- The deal already cash-flows at list — no discount required.
- Meets the 1% rule at list price ($3k rent vs $55k).
- Recommended offer: $53k (3.0% below list) — sets the bar for market timing.
- Cap rate 43.6% vs local median 3.4% in Canandaigua — top-decile yield for the area; either an underpriced asset or a hidden risk that comps aren't pricing in. Stress-test before assuming the spread holds.
Location & tenants
- Location reads 75/100 on livability (#243 in NY, #3,822 nationally) — a middle-class / working-renter tenant base. Strengths: commute A+, housing A+, schools B+; Watch: employment C-, amenities F, health & safety D-.
- Canandaigua City School District (suburban): math 50% / reading 59% proficiency, ranked #305 of 590 in NY (top 52%) — acceptable for families but not a draw, mixed tenant base, ~2y average lease.
- Market conditions: Rents rising fast (+8.5%/yr); 223 active listings in the ZIP; 3 comparable units currently listed for rent nearby; rentals at typical pace (median 15d on market — plan ~3-4 weeks tenant-placement turnaround); solid renter incomes; 284 units permitted in Ontario County in 2024 (69 in 5+ unit buildings).
- This rent runs 40% of the median local income ($80k/yr) — at the standard rent-burdened threshold; future hikes will face affordability resistance.
Forward outlook
- Local home prices are declining (-3.0%/yr); year-one equity from $380 of loan paydown is wiped out by about $2k of value loss. Plan a longer hold.
- Ontario County population projected to shrink 6% by 2050 — rents likely to lag national; underwrite the cash flow, not the appreciation.
- At projected returns (-3.0% appreciation + 8.0% rent growth), your $15k cash investment doubles in ~1 year — after that, you're playing with house money.
Negotiation context
- It's been on market 59 days — a 3% lower offer ($53k) is reasonable based on typical stale-listing flexibility.
- 12 sale attempts since 16y ago; this cycle's ask has dropped $9k (14%) from the opening price — seller is motivated, your offer sets the floor, not the list.
- Current owner paid $40k; 38% above their basis — modest negotiation headroom, anchor on the comps not their cost.
Questions for the listing agent
- It's been on market 59 days. Have you received any prior offers? Is the seller open to a 3% concession, seller financing, or rate buy-down credit?
- Is there a deadline driving the sale (1031 exchange, divorce, estate, relocation)? That informs how much negotiation room exists.
- Schools are B-rated — typically a magnet for longer-tenancy family renters. What's the average tenant stay here, and is there a school-zone premium baked into asking?
- The area grade is low — what's the realistic commute time and amenity access for the typical tenant pool here? Any planned neighborhood developments (good or bad) we should know about?
- What's the average days-on-market for RENTAL listings here right now (not sales)? A rising rental-DOM trend means longer vacancies and softer asking-rent achievability than the comps imply.
- What's the recent tenant-quality profile in this submarket — average credit score on applications, eviction rate, late-payment / NSF rate, and stable-employment percentage? A property-management company in the area should have these aggregated.
- How much new for-sale + rental construction is in the pipeline within 1–3 miles? Heavy new supply typically softens prices + rents 12–24 months out; constrained supply supports both.
Investment metrics
- 1% rule
- 4.81% ✓
- Cap rate
- 43.59%
- Cash-on-cash
- 133.22%
- DSCR
- 6.93
- GRM
- 1.7
CMA / ARV
- ARV (median comp)
- $49,625
- List price
- $54,900
- Delta
- 10.63%
- Verdict
- OVERPRICED
- Comps
- 4 within 1.0 mi
Projected returns pro-forma
-3.0% appreciation · 8.0% rent growth · sell at horizon
- IRR
- —
- Equity multiple
- 8.40×
- Total profit
- $113,786
- Equity at exit
- $8,186
- IRR
- —
- Equity multiple
- 20.69×
- Total profit
- $302,709
- Equity at exit
- $4,747
Cash invested: $15,372 (down + closing). Projections, not guarantees.
Landlord ↔ Tenant lean methodology
- Overall (STATE)
- 15 Strongly Tenant-Friendly
- State New York
- 15 Strongly Tenant-Friendly · D+10
- County
- — inherits STATE
- City
- — inherits STATE
ZIP-level market 14424
- Home prices YoY
- -21.2%
- Rents YoY
- 8.5%
- Active inventory
- 223
- Price-to-rent
- 1.7×
Monthly cashflow live
- Estimated rent
- $2,640 medium interval (Pro) →
- Mortgage (P&I)
- −$288
- Tax est. 1.5%
- −$69 /mo · $824/yr
- Insurance
- −$23
- HOA
- −$0
- Vacancy / Maint / Mgmt
- −$554
- Net cashflow
- $1,707
Break-even live
UW: 25.0% down · 7.5% · 30yr · 1.5% tax · 5.0% vac · 8.0% maint · 8.0% mgmt
Financing live
Cash to close
- Down payment
- $13,725
- Closing costs
- $1,647
- Reserves months
- —
- Total cash needed
- —
Loan-product check · same deal, 3 products live
Conventional
25% down · 7.5% · 30yr
- Down + closing
- —
- Monthly P&I
- —
- Monthly cashflow
- —
- DSCR
- —
- Eligible?
- —
Personal DTI + credit; lowest rate.
DSCR
20% down · 8.5% · 30yr
- Down + closing
- —
- Monthly P&I
- —
- Monthly cashflow
- —
- DSCR
- —
- Eligible?
- —
No personal income docs; deal must DSCR.
Hard money
10% down · 12.0% · 12mo
- Down + closing
- —
- Monthly P&I
- —
- Monthly cashflow
- —
- DSCR
- —
- Eligible?
- —
Short-term bridge; refi at stabilization.
Rent comps 3 comps
| Address | Beds | Baths | Sqft | Rent | $/sqft | DOM | Units | Dist |
|---|---|---|---|---|---|---|---|---|
| 81 Pleasant St Canandaigua, NY | 5.0 | 2.0 | 2132 | $2,800 | $1.31 | 3d | 1 | 0.46mi |
| 79 Granger St Canandaigua, NY | 4.0 | 1.5 | 1740 | $2,700 | $1.55 | 43d | 1 | 1.18mi |
| 321 N Main St Canandaigua, NY | 4.0 | 3.0 | 2420 | $2,200 | $0.91 | 14d | 1 | 1.33mi |
Listing history 50 events
-
2026-06-19status $54,900 Pending 59 DOM
-
2026-06-18days on market $54,900 Active 59 DOM
-
2026-06-17days on market $54,900 Active 58 DOM
-
2026-06-16days on market $54,900 Active 57 DOM
-
2026-06-15pricedays on market $54,900 Active 56 DOM
-
2026-06-15days on market $66,000 Active 6 DOM
-
2026-06-13days on market $66,000 Active 4 DOM
-
2026-06-13days on market $66,000 Active 3 DOM
-
2026-06-10remarks 699-char remark
-
2026-06-10pricedays on market $66,000 Active 1 DOM
-
2026-06-09days on market $54,900 Active 50 DOM
-
2026-06-09days on market $54,900 Active 49 DOM
-
2026-06-07statusdays on market $54,900 Active 48 DOM
-
2026-04-25price $54,900 377-char remark
Show marketing remark (377 chars)
Beautiful 2019 (16x66)3 bedroom, 2 bath mobile home located in beautiful Canandaigua. This is 2 feet wider than a traditional mobile home. Near walking trails, shopping, movie theater and beautiful Canandaigua Lake. Home has been freshly painted, new flooring, new fixtures, cleaned. All applicants must be park approved. Central air condition is being sold in as is condition.
-
2026-04-10$63,900 Active 377-char remark
Show marketing remark (377 chars)
Beautiful 2019 (16x66)3 bedroom, 2 bath mobile home located in beautiful Canandaigua. This is 2 feet wider than a traditional mobile home. Near walking trails, shopping, movie theater and beautiful Canandaigua Lake. Home has been freshly painted, new flooring, new fixtures, cleaned. All applicants must be park approved. Central air condition is being sold in as is condition.
-
2025-02-12soldstatus $39,900 Closed 205-char remark
Show marketing remark (205 chars)
Beautiful 16x66 Commodore 3 bedroom, 2 full bath, freshly painted, new flooring near shopping center, lake, walking paths. .. all around great place to reside. Must be park approved through Cook Properties
-
2025-01-09status Pending 205-char remark
Show marketing remark (205 chars)
Beautiful 16x66 Commodore 3 bedroom, 2 full bath, freshly painted, new flooring near shopping center, lake, walking paths. .. all around great place to reside. Must be park approved through Cook Properties
-
2024-12-23historical Active Under Contract 205-char remark
Show marketing remark (205 chars)
Beautiful 16x66 Commodore 3 bedroom, 2 full bath, freshly painted, new flooring near shopping center, lake, walking paths. .. all around great place to reside. Must be park approved through Cook Properties
-
2024-12-04$39,900 Active 205-char remark
Show marketing remark (205 chars)
Beautiful 16x66 Commodore 3 bedroom, 2 full bath, freshly painted, new flooring near shopping center, lake, walking paths. .. all around great place to reside. Must be park approved through Cook Properties
-
2024-08-21soldstatus $32,500 Closed
-
2024-08-16status Pending
-
2024-08-09status Active
-
2024-08-09price $34,900
-
2024-08-01status Pending
-
2024-07-24historical Active Under Contract
-
2024-07-11price $37,900
-
2024-07-02price $39,900
-
2024-06-23$41,500 Active
-
2020-09-21soldstatus $2,460,000
-
2019-02-01soldstatus $20,000 Closed Sale or Rented
-
2019-01-24status Pending Sale
-
2019-01-15status Under Contract- Do Not Show
-
2018-12-21soldstatus $16,000 Closed Sale or Rented
-
2018-11-05status Pending Sale
-
2018-10-17$17,000 Active
-
2018-09-26price $20,000
-
2018-09-05$23,000 Active
-
2016-02-15soldstatus $15,500 Closed Sale or Rented
-
2015-12-21status Pending Sale
-
2015-11-12price $19,900
-
2015-10-08$22,900 Active
-
2015-09-25historical
-
2015-06-22$59,000 Active
-
2015-05-09soldstatus $7,000
-
2014-11-24$8,000
-
2014-07-10$25,000
-
2011-05-12soldstatus $6,500
-
2010-11-15$7,900
-
2010-09-27soldstatus $952,735
-
2010-06-25soldstatus $10,500
ⓘ Source: listings_history table (triggers on properties + properties_extension) + one-shot
backfill from property_details.listing_events for pre-trigger history.
Climate risk First Street
- Flood 1/10 Low FEMA zone X · 0% chance over 30 yrs
- Wildfire 2/10 Low
- Heat 2/10 Low 7 d/yr ≥96°F today · 16 d/yr by 30 yrs out
- Wind 1/10 Low
- Air quality 2/10 Low 0 unhealthy d/yr today · 1 by 30 yrs out
Nearby sold comps map
Loading sold comps map…
Walkable amenities ~0.75 mi
Loading nearby amenities…
Taxation est. · year 1
- Rental income
- $31,685
- − Mortgage interest
- −$3,075
- − Property taxes
- −$824
- − Insurance
- −$274
- − Repairs & maintenance
- −$2,535
- − Management
- −$2,535
- − Depreciation
- −$1,597
- Taxable income
- $20,845
- Est. tax owed @ 24.0%
- −$5,003
- After-tax cash flow
- $15,475/yr
For passive investors: Depreciation is non-cash, so a rental often shows a tax loss while cash-flowing — sheltering income. Rental losses are passive: they offset passive income freely, and up to $25,000/yr can offset ordinary (W-2) income if you actively participate and your MAGI is under $100k (phasing out to $0 by $150k); unused losses carry forward. On sale, claimed depreciation is recaptured at up to 25%, and gains may owe capital-gains tax (a 1031 exchange can defer both). Figures are a year-1 estimate at your 24.0% rate — not tax advice; consult a CPA.
Schools (NCES district)
- District
- Canandaigua City School District
- NCES district ID
- 3606330
- Math proficiency
- 50% ▼ -10.00%
- Reading proficiency
- 59% ▲ 4.00%
- Median HH income
- $56,375
- Composite
- 47.09/100
- National rank
- #2335
- State rank
- #305 of 590 in NY
Livability — Canandaigua
- Score
- 75/100
- State rank
- #243
- US rank
- #3822
Category grades
Schools grade is shown separately in the Schools card above.
Census & demographics
- Census place
- Canandaigua, NY
- County
- Ontario County · 58,989 people
- City population
- 28,786
- Metro
- Rochester, NY
- Population (ZIP)
- 28,786
- Household income
- $79,778
- Rent vs Own
- Severe rent burden
- 737.0
Population outlook (Ontario County) Hauer SSP2
- Today (2025)
- 111,230 people
- By 2030
- 111,401 · +0.2%
- By 2040
- 109,535 · -1.5%
- By 2050
- 104,895 · -5.7%
- By 2075
- 92,999 · -16.4%
- By 2100
- 73,723 · -33.7%
Race, ethnicity, and origin ACS 2023
- Neighborhood character
- Predominantly White (90%)
- Race & ethnicity
- White 90% Hispanic / Latino 5% Two or more races 5% Black 1%
- Common ancestry
- Romanian 4% Iranian 4% Slovak 3%
- Foreign-born
- 3% · Canada
- Languages at home
- 94% English-only · Spanish 3% German/W. Germanic 1% Arabic 1%
Political lean MEDSL · Ontario
- 2024 margin
- Toss-up / Even · D 49.4% · R 50.6%
- 2008→2024 swing
- -1.0pp toward R · 2008: -0.1pp · 2024: -1.2pp
- All cycles
- 2024: R+1.2 2020: R+0.0 2016: R+8.6 2012: R+1.6 2008: R+0.1
Not yet ingested
- Civics
- —
Market trends
- HPI YoY
- ▼ -70.94%
- Current HPI
- 263.755
- Rent YoY
- ▲ 8.46%
- Metro
- Rochester, NY
- State GDP YoY
- ▲ 2.60%
- F500 in state
- 92
Industry mix (Fortune 500 HQ in NY)
| Industry | F500 HQs | Revenue |
|---|---|---|
| Financial Services | 10 | $950B |
|
||
| Consumer Goods | 9 | $162B |
|
||
| Insurance | 4 | $225B |
|
||
| Telecommunications | 2 | $144B |
|
||
| Pharmaceuticals | 2 | $112B |
|
||
| Media / Entertainment | 2 | $69B |
|
||
Price history
-97.0% since first listed40 events — show timeline
- 2026-04-25 Price Changed $54,900 UNYREIS
- 2026-04-10 Listed $63,900 UNYREIS
- 2025-02-12 Sold (MLS) $39,900 UNYREIS
- 2025-01-09 Pending — UNYREIS
- 2024-12-23 Contingent — UNYREIS
- 2024-12-04 Listed $39,900 UNYREIS
- 2024-08-21 Sold (MLS) $32,500 UNYREIS
- 2024-08-16 Pending — UNYREIS
- 2024-08-09 Relisted — UNYREIS
- 2024-08-09 Price Changed $34,900 UNYREIS
- 2024-08-01 Pending — UNYREIS
- 2024-07-24 Contingent — UNYREIS
- 2024-07-11 Price Changed $37,900 UNYREIS
- 2024-07-02 Price Changed $39,900 UNYREIS
- 2024-06-23 Listed $41,500 UNYREIS
- 2020-09-21 Sold (Public Records) $2,460,000 Public Records
- 2019-02-01 Sold (MLS) $20,000 UNYREIS
- 2019-01-24 Pending — UNYREIS
- 2019-01-15 Pending — UNYREIS
- 2018-12-21 Sold (MLS) $16,000 UNYREIS
- 2018-11-05 Pending — UNYREIS
- 2018-10-17 Listed $17,000 UNYREIS
- 2018-09-26 Price Changed $20,000 UNYREIS
- 2018-09-05 Listed $23,000 UNYREIS
- 2016-02-15 Sold (MLS) $15,500 UNYREIS
- 2015-12-21 Pending — UNYREIS
- 2015-11-12 Price Changed $19,900 UNYREIS
- 2015-10-08 Listed $22,900 UNYREIS
- 2015-09-25 Listing Removed — UNYREIS
- 2015-06-22 Listed $59,000 UNYREIS
- 2015-05-09 Sold (MLS) $7,000 UNYREIS
- 2014-11-24 Listed $8,000 UNYREIS
- 2014-07-10 Listed $25,000 UNYREIS
- 2011-05-12 Sold (MLS) $6,500 UNYREIS
- 2010-11-15 Listed $7,900 UNYREIS
- 2010-09-27 Sold (Public Records) $952,735 Public Records
- 2010-06-25 Sold (MLS) $10,500 UNYREIS
- 2010-04-27 Listed $11,000 UNYREIS
- 2008-04-09 Sold (Public Records) $1,830,261 Public Records
- 2004-05-06 Sold (Public Records) $1,820,000 Public Records
Property tax history
-0.8%/yrLatest (2025): $52,615 · -1.9% YoY. Source: county tax records.
Cash-flow waterfall
monthlySold comps — $/sqft
last 12 mo · ≤1 miLoading sold comps…