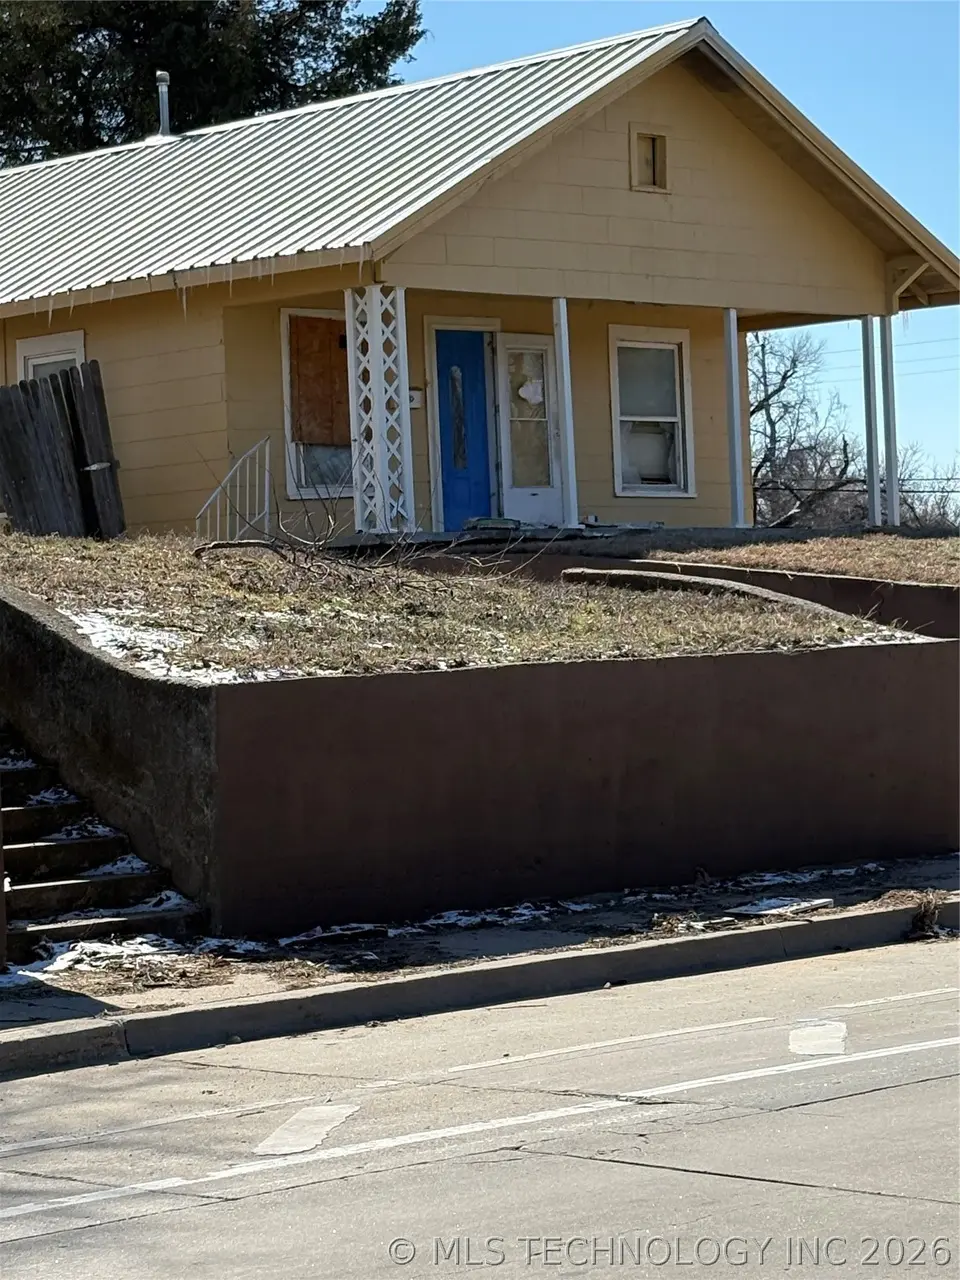
5128 Charles Page Blvd · Tulsa, OK
Flood risk 1/10 · Minimal
- FEMA flood zone
- X (shaded)
- Chance of flooding over 30 yrs
- 0.0%
- Est. flood insurance / yr
- $473 – $860
Fire risk 5/10 · Moderate
- Est. fire insurance / yr
- $2,463 – $4,575
Heat risk 6/10 · Moderate
- Hot days now (above 112°F)
- 7 days/yr
- Hot days in 30 yrs
- 18 days/yr
Wind risk 3/10 · Minor
- Chance of severe wind over 30 yrs
- 4.0%
Air-quality risk 2/10 · Minimal
- Unhealthy air days now
- 2 days/yr
- Unhealthy air days in 30 yrs
- 2 days/yr
Risk factors via First Street. Map © Google.
Why this score? — see what drove the B+ grade
The composite is a weighted blend of 9 inputs, each scored 0–100. Each bar is that input's sub-score; the figure is the points it added to the 100-point composite (weight × sub-score).
- Cash flow +30.0/30.0
- ARV discount +15.0/15.0
- 1% rule +10.0/10.0
- DSCR +10.0/10.0
- Livability +3.8/5.0
- Rent growth +3.1/5.0
- Condition / age +2.5/5.0
- Schools +0.8/10.0
- Appreciation +0.0/10.0
$91,500
🖨 Deal sheet 📄 Offer letter ✓ Due diligence
Listing remarks MLS
AS IS Fixer Upper – Perfect for Investors or DIY Enthusiasts Uncover the potential of this two-bedroom, one-bath home, ideal for investors or those ready to renovate. This property features a charming part-brick exterior, a cozy fireplace, and a large yard. Highlights: Bedrooms: Two inviting bedrooms ready for your personal touch Bathroom: One full bath awaiting a modern makeover Living Area: Includes a cozy fireplace perfect for relaxing evenings Garage: Approximate 20x20 detached garage with a shop below Outdoor Spaces: Expansive yard, a welcoming porch, and a deck perfect for outdoor gatherings Basement: Additional space for storage or potential living area expansion With its solid structure this AS IS home offers fantastic potential. Whether you're looking to invest or create your dream home, this property is a remarkable opportunity. Don’t miss out!
Key facts
- Remodeled
- Basement
- Investment property
Tags
Property features AI
Exterior
- Security: Smoke detector(s); No safety shelter
- Utilities: Electricity available; Public water; Public sewer
- Home design: Single-story; Faces north; Basement present (full basement)
- Construction: Brick and wood-frame construction; Asphalt/fiberglass roof; Basement foundation; Built (year source: public records)
- Exterior features: Patio; Porch; Storage structure
Interior
- Kitchen: Oven; Range; Disposal; Laminate and stone counters
- Flooring: Carpet; Vinyl
- Bathrooms: 1 full bathroom
- Heating & cooling: Central heating (gas); Central air conditioning
- Interior features: Vinyl and insulated windows; Laminate counters and stone counters; Electric oven and electric range connections; Disposal; Gas water heater; Carpet and vinyl flooring; Smoke detector(s)
- Laundry & utility: Electric dryer hookup
Neighborhood map
What this means for you Summary
Snapshot
- This is a 3-bed/1.0-bath single-family listed at $92k.
Deal economics
- At list price, monthly cash flow is $575 ($7k/yr) — positive.
- The deal already cash-flows at list — no discount required.
- Meets the 1% rule at list price ($1k rent vs $92k).
- Cap rate 13.8% vs local median 3.9% in Tulsa — top-decile yield for the area; either an underpriced asset or a hidden risk that comps aren't pricing in. Stress-test before assuming the spread holds.
Location & tenants
- Location reads 75/100 on livability (#13 in OK, #4,058 nationally) — a middle-class / working-renter tenant base. Strengths: amenities A+, commute A+, cost of living A+; Watch: schools F, crime F, employment D-.
- Tulsa (urban): math 7% / reading 12% proficiency, ranked #250 of 270 in OK (top 93%) — low school quality limits family demand, transient renter base, plan for 1-2y turnover; 76% free/reduced lunch — lower-income household profile, screen leases tightly.
- Market conditions: Rents rising (+2.5%/yr); 113 active listings in the ZIP; 2 comparable units currently listed for rent nearby; 2,818 units permitted in Tulsa County in 2024 (518 in 5+ unit buildings).
- This rent runs 37% of the median local income ($46k/yr) — at the standard rent-burdened threshold; future hikes will face affordability resistance.
Forward outlook
- Local home prices are declining (-3.0%/yr); year-one equity from $633 of loan paydown is wiped out by about $3k of value loss. Plan a longer hold.
- Tulsa County population projected at +30% by 2050 — long-run rental-demand tailwind backs the buy-and-hold thesis.
- At projected returns (-3.0% appreciation + 2.5% rent growth), your $26k cash investment doubles in ~5 years — after that, you're playing with house money.
Negotiation context
- Only 13 days on market — expect competitive offers; lowballing is unlikely to land.
- 10 sale attempts since 23y ago with the ask held roughly flat each time — persistent listings suggest the price (not the market) is what's stuck; bring a comps-based counter.
- Current owner paid $33k; list at $92k implies a 177% gain — meaningful room to come down on a strong offer.
Risks & watch-outs
- Watch-outs: built in 1920 — expect roof / HVAC / electrical / plumbing capex.
- Climate carrying-cost: moderate wildfire risk; extreme-heat days projected 7→18/yr by 2055 (HVAC capex compounding) — expect insurance premiums to compound above CPI over the hold.
Questions for the listing agent
- Built in 1920 — when were the roof, HVAC, electrical panel, plumbing, and water heater last replaced?
- Is there a deadline driving the sale (1031 exchange, divorce, estate, relocation)? That informs how much negotiation room exists.
- Schools are F-rated, which usually means shorter tenancies and higher turnover. Who's the typical renter profile here, and what's been the actual vacancy rate?
- Crime grade is F in this area — have there been break-ins, vandalism, or insurance claims at this property in the last 3 years? What carrier currently insures it and at what premium?
- What's the average days-on-market for RENTAL listings here right now (not sales)? A rising rental-DOM trend means longer vacancies and softer asking-rent achievability than the comps imply.
- What's the recent tenant-quality profile in this submarket — average credit score on applications, eviction rate, late-payment / NSF rate, and stable-employment percentage? A property-management company in the area should have these aggregated.
- How much new for-sale + rental construction is in the pipeline within 1–3 miles? Heavy new supply typically softens prices + rents 12–24 months out; constrained supply supports both.
Investment metrics
- 1% rule
- 1.56% ✓
- Cap rate
- 13.84%
- Cash-on-cash
- 26.94%
- DSCR
- 2.20
- GRM
- 5.4
CMA / ARV
- ARV (on-the-fly)
- $146,766
- Comps found
- 12
Show comp detail 12 sales within ~0.75 mi
| Address | Dist | Beds/Ba | Sqft | Sold | Price | $/sf | Match |
|---|---|---|---|---|---|---|---|
| 4920 Charles Page Blvd | 0.16mi | 3/1.0 | 1,092 (-9%) | 1mo | $142,400 | $130 | 77 |
| 5112 W 10th St | 0.18mi | 2/1.5 (-1) | 1,160 (-4%) | 8mo | $163,900 | $141 | 72 |
| 444 S 43rd WestAvenue | 0.60mi | 3/1.0 | 1,212 (+1%) | 0mo | $95,000 | $78 | 71 |
| 5330 W 2nd St | 0.42mi | 3/2.0 | 1,212 (+1%) | 7mo | $90,000 | $74 | 69 |
| 5340 W 11th St | 0.28mi | 4/2.0 (+1) | 1,250 (+4%) | 4mo | $148,000 | $118 | 68 |
| 4933 W 2nd St | 0.45mi | 2/1.0 (-1) | 1,224 (+2%) | 8mo | $47,500 | $39 | 65 |
| 429 S 49th WestAvenue | 0.30mi | 3/1.0 | 1,050 (-13%) | 1mo | $155,000 | $148 | 64 |
| 4716 W 8th St | 0.31mi | 4/2.0 (+1) | 1,292 (+7%) | 1mo | $158,000 | $122 | 63 |
| 4330 W Archer St | 0.73mi | 3/1.0 | 1,164 (-3%) | 6mo | $155,900 | $134 | 55 |
| 423 S 43rd Ave W | 0.64mi | 3/2.0 | 1,232 (+2%) | 9mo | $160,000 | $130 | 55 |
| 4141 W 8th St | 0.61mi | 4/2.0 (+1) | 1,245 (+4%) | 5mo | $73,800 | $59 | 53 |
| 5677 W 3rd St | 0.41mi | 2/1.0 (-1) | 1,072 (-11%) | 8mo | $95,500 | $89 | 51 |
Match score weights: distance 35% · size 25% · config 20% · recency 20%. Top-matched comps best support the ARV.
Projected returns pro-forma
-3.0% appreciation · 2.45% rent growth · sell at horizon
- IRR
- 20.3%
- Equity multiple
- 1.82×
- Total profit
- $20,997
- Equity at exit
- $13,643
- IRR
- 28.1%
- Equity multiple
- 3.43×
- Total profit
- $62,161
- Equity at exit
- $7,911
Cash invested: $25,620 (down + closing). Projections, not guarantees.
Landlord ↔ Tenant lean methodology
- Overall (STATE)
- 83 Strongly Landlord-Friendly
- State Oklahoma
- 83 Strongly Landlord-Friendly · R+20
- County
- — inherits STATE
- City
- — inherits STATE
ZIP-level market 74127
- Home prices YoY
- -20.4%
- Rents YoY
- 2.5%
- Active inventory
- 113
- Price-to-rent
- 5.4×
Monthly cashflow live
- Estimated rent
- $1,424 medium interval (Pro) →
- Mortgage (P&I)
- −$480
- Tax from tax record
- −$32 /mo · $383/yr
- Insurance
- −$38
- HOA
- −$0
- Vacancy / Maint / Mgmt
- −$299
- Net cashflow
- $575
Break-even live
UW: 25.0% down · 7.5% · 30yr · 1.5% tax · 5.0% vac · 8.0% maint · 8.0% mgmt
Financing live
Cash to close
- Down payment
- $22,875
- Closing costs
- $2,745
- Reserves months
- —
- Total cash needed
- —
Loan-product check · same deal, 3 products live
Conventional
25% down · 7.5% · 30yr
- Down + closing
- —
- Monthly P&I
- —
- Monthly cashflow
- —
- DSCR
- —
- Eligible?
- —
Personal DTI + credit; lowest rate.
DSCR
20% down · 8.5% · 30yr
- Down + closing
- —
- Monthly P&I
- —
- Monthly cashflow
- —
- DSCR
- —
- Eligible?
- —
No personal income docs; deal must DSCR.
Hard money
10% down · 12.0% · 12mo
- Down + closing
- —
- Monthly P&I
- —
- Monthly cashflow
- —
- DSCR
- —
- Eligible?
- —
Short-term bridge; refi at stabilization.
Rent comps 2 comps
| Address | Beds | Baths | Sqft | Rent | $/sqft | DOM | Units | Dist |
|---|---|---|---|---|---|---|---|---|
| 5330 W 2nd St Tulsa, OK | 4.0 | 2.0 | 1212 | $1,700 | $1.40 | 1d | 1 | 0.41mi |
| 5913 W 8th St Tulsa, OK | 2.0 | 1.0 | 820 | $1,050 | $1.28 | 21d | 1 | 0.47mi |
Listing history 10 events
-
2026-06-18days on market $91,500 Active 13 DOM
-
2026-06-17days on market $91,500 Active 12 DOM
-
2026-06-16days on market $91,500 Active 11 DOM
-
2026-06-15days on market $91,500 Active 10 DOM
-
2026-06-13days on market $91,500 Active 8 DOM
-
2026-06-10days on market $91,500 Active 5 DOM
-
2026-06-09days on market $91,500 Active 4 DOM
-
2026-06-08days on market $91,500 Active 3 DOM
-
2026-06-07remarks 216-char remark
-
2026-06-07$91,500 Active 2 DOM
ⓘ Source: listings_history table (triggers on properties + properties_extension) + one-shot
backfill from property_details.listing_events for pre-trigger history.
Tax reassessment forecast OK · Resets to sale price
- Current annual tax
- $383 · $32/mo
- Projected year-2 tax
- $823 · $69/mo
- Expected delta
- +$440/yr (+$37/mo · 115.0%)
ⓘ Screening estimate from a state-policy table — verify with the county assessor before closing.
Climate risk First Street
- Flood 1/10 Low FEMA zone X (shaded) · 0% chance over 30 yrs
- Wildfire 5/10 Major
- Heat 6/10 Major 7 d/yr ≥112°F today · 18 d/yr by 30 yrs out
- Wind 3/10 Moderate 4% chance of damaging wind over 30 yrs
- Air quality 2/10 Low 2 unhealthy d/yr today · 2 by 30 yrs out
Nearby sold comps map
Loading sold comps map…
Walkable amenities ~0.75 mi
Loading nearby amenities…
Taxation est. · year 1
- Rental income
- $17,090
- − Mortgage interest
- −$5,125
- − Property taxes
- −$383
- − Insurance
- −$458
- − Repairs & maintenance
- −$1,367
- − Management
- −$1,367
- − Depreciation
- −$2,662
- Taxable income
- $5,728
- Est. tax owed @ 24.0%
- −$1,375
- After-tax cash flow
- $5,528/yr
For passive investors: Depreciation is non-cash, so a rental often shows a tax loss while cash-flowing — sheltering income. Rental losses are passive: they offset passive income freely, and up to $25,000/yr can offset ordinary (W-2) income if you actively participate and your MAGI is under $100k (phasing out to $0 by $150k); unused losses carry forward. On sale, claimed depreciation is recaptured at up to 25%, and gains may owe capital-gains tax (a 1031 exchange can defer both). Figures are a year-1 estimate at your 24.0% rate — not tax advice; consult a CPA.
Schools (NCES district)
- District
- Tulsa
- NCES district ID
- 4030240
- Math proficiency
- 7% ▼ -9.00%
- Reading proficiency
- 12% ▼ -7.00%
- Median HH income
- $37,895
- Composite
- 8.04/100
- National rank
- #9919
- State rank
- #250 of 270 in OK
Livability — Tulsa
- Score
- 75/100
- State rank
- #13
- US rank
- #4058
Category grades
Schools grade is shown separately in the Schools card above.
Census & demographics
- Census place
- Tulsa, OK
- County
- Osage County · 26,244 people
- City population
- 389,418
- Metro
- Tulsa, OK
- Population (ZIP)
- 16,324
- Household income
- $46,373
- Rent vs Own
- Severe rent burden
- 782.0
Population outlook (Tulsa County) Hauer SSP2
- Today (2025)
- 723,846 people
- By 2030
- 766,033 · +5.8%
- By 2040
- 851,386 · +17.6%
- By 2050
- 938,389 · +29.6%
- By 2075
- 1,166,011 · +61.1%
- By 2100
- 1,350,277 · +86.5%
Race, ethnicity, and origin ACS 2023
- Neighborhood character
- Diverse neighborhood (Simpson 0.66)
- Race & ethnicity
- White 50% Black 28% Two or more races 10% Hispanic / Latino 7% Native American 7%
- Hispanic origin (detail)
- Mexican 5%
- Common ancestry
- Slovak 2% Italian 1% Iranian 1%
- Foreign-born
- 4% · Canada, Jamaica
- Languages at home
- 94% English-only · Spanish 4%
Political lean MEDSL · Tulsa
- 2024 margin
- R (+15.2) · D 41.3% · R 56.5% · Other 2.2%
- 2008→2024 swing
- +9.2pp toward D · 2008: -24.5pp · 2024: -15.2pp
- All cycles
- 2024: R+15.2 2020: R+15.6 2016: R+22.9 2012: R+27.4 2008: R+24.5
Not yet ingested
- Civics
- —
Market trends
- HPI YoY
- ▼ -59.31%
- Current HPI
- 231.5994
- Rent YoY
- ▲ 2.45%
- Metro
- Tulsa, OK
- State GDP YoY
- ▲ 1.55%
- F500 in state
- 6
Industry mix (Fortune 500 HQ in OK)
| Industry | F500 HQs | Revenue |
|---|---|---|
| Energy | 3 | $48B |
|
||
Price history
+55.3% since first listed28 events — show timeline
- 2026-06-05 Listed $91,500 MLS Technology, Inc.
- 2026-02-16 Listing Removed — MLS Technology, Inc.
- 2026-01-30 Price Changed $100,000 MLS Technology, Inc.
- 2025-10-22 Price Changed $94,900 MLS Technology, Inc.
- 2025-09-24 Listed $97,400 MLS Technology, Inc.
- 2025-02-28 Sold (Public Records) $40,000 Public Records
- 2025-02-28 Sold (Public Records) $33,000 Public Records
- 2025-01-31 Sold (MLS) $40,000 MLS Technology, Inc.
- 2024-06-25 Pending — MLS Technology, Inc.
- 2024-05-31 Listed $60,000 MLS Technology, Inc.
- 2014-08-01 Sold (MLS) $34,500 MLS Technology, Inc.
- 2014-07-31 Sold (Public Records) $34,500 Public Records
- 2014-06-02 Listing Removed — MLS Technology, Inc.
- 2014-04-07 Listed $34,500 MLS Technology, Inc.
- 2014-02-11 Listing Removed — MLS Technology, Inc.
- 2013-08-12 Listing Removed — MLS Technology, Inc.
- 2013-08-11 Listed $34,000 MLS Technology, Inc.
- 2013-02-11 Listed $34,500 MLS Technology, Inc.
- 2007-09-14 Listing Removed — MLS Technology, Inc.
- 2007-04-30 Listed $59,900 MLS Technology, Inc.
- 2005-05-18 Sold (Public Records) $46,000 Public Records
- 2005-05-16 Sold (MLS) $46,000 MLS Technology, Inc.
- 2005-03-19 Listing Removed — MLS Technology, Inc.
- 2005-03-15 Listed $52,000 MLS Technology, Inc.
- 2005-03-11 Listing Removed — MLS Technology, Inc.
- 2004-09-12 Listed $52,000 MLS Technology, Inc.
- 2003-05-06 Listing Removed — MLS Technology, Inc.
- 2003-02-21 Listed $58,900 MLS Technology, Inc.
Property tax history
-5.0%/yrLatest (2025): $383 · +8.5% YoY. Source: county tax records.
Cash-flow waterfall
monthlySold comps — $/sqft
last 12 mo · ≤1 miLoading sold comps…