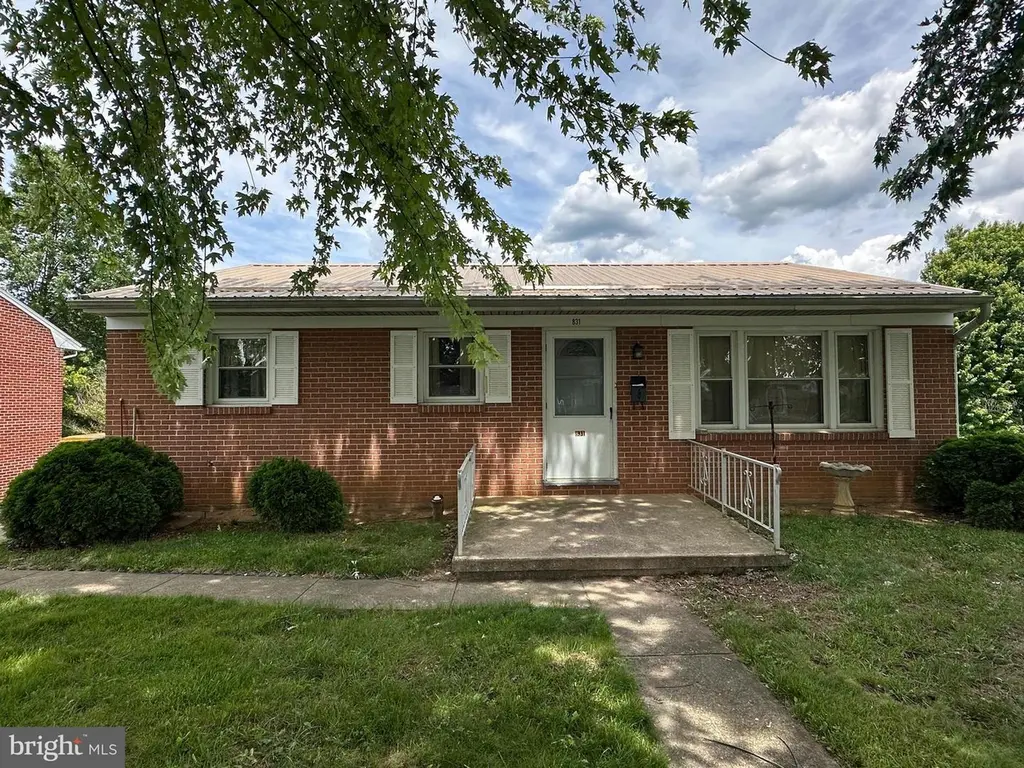
831 Fairview Ave · Waynesboro, PA
Flood risk 1/10 · Minimal
- FEMA flood zone
- X (unshaded)
- Chance of flooding over 30 yrs
- 0.0%
- Est. flood insurance / yr
- $507 – $1,088
Fire risk 1/10 · Minimal
- Est. fire insurance / yr
- $511 – $949
Heat risk 5/10 · Moderate
- Hot days now (above 100°F)
- 7 days/yr
- Hot days in 30 yrs
- 16 days/yr
Wind risk 2/10 · Minimal
- Chance of severe wind over 30 yrs
- 3.0%
Air-quality risk 2/10 · Minimal
- Unhealthy air days now
- 1 days/yr
- Unhealthy air days in 30 yrs
- 1 days/yr
Risk factors via First Street. Map © Google.
Why this score? — see what drove the D grade
The composite is a weighted blend of 9 inputs, each scored 0–100. Each bar is that input's sub-score; the figure is the points it added to the 100-point composite (weight × sub-score).
- Cash flow +12.6/30.0
- ARV discount +7.5/15.0
- 1% rule +4.1/10.0
- Livability +3.9/5.0
- Schools +3.8/10.0
- DSCR +3.7/10.0
- Rent growth +2.5/5.0
- Condition / age +2.5/5.0
- Appreciation +0.0/10.0
$189,000
🖨 Deal sheet (PDF) 📄 Offer letter ✓ Due diligence
Listing remarks
NICE BRICK RANCHER BORDERING ROTARY PARK IN WAYNESBORO! This brick rancher features 3-4 bedrooms, 1.5 bathrooms, a living room, kitchen, detached 2-car garage, and more! Hardwood floors extend through much of the home! Bordering Rotary Park, the property offers a wonderful setting to enjoy the outdoors with nearby amenities including a fitness trail, pavilion, basketball courts, and plenty of open space. Conveniently located close to schools, shopping, recreation, and everyday conveniences. The home is in need of some TLC but offers plenty of potential in an excellent location! There is a solar lease, the buyer must assume the lease. This property will be offered at auction on Monday, June
Key facts
- 0.31 acre lot
- Garage
- Built 1968
Property features AI
Exterior
- Parking: Detached garage with one garage space; Driveway; Covered parking; Garage includes additional storage area
- Utilities: Electric heating and cooling; Electric hot water; Public water and sewer
- Home design: Detached property; Above-grade and below-grade living areas; Below-grade finished area (estimated 455); Above-grade finished area (estimated 1,064); Located in Waynesboro Borough
- Construction: Brick construction; Block foundation
- Exterior features: Public water; Public sewer; No tidal water
Interior
- Kitchen: Kitchen
- Bedrooms: Three bedrooms on the main level (Bedroom 2, Bedroom 3, Bedroom 4)
- Bathrooms: One full bathroom on the main level
- Heating & cooling: Baseboard electric heat; Central air conditioning (electric)
- Interior features: Living room; Family room; Storage room; Partially finished full basement
- Laundry & utility: Laundry area; Electric hot water
Neighborhood map
What this means for you Summary
Snapshot
- This is a 3-bed/1.0-bath other listed at $189k.
Deal economics
- At list price, monthly cash flow is $-25 ($-306/yr) — negative.
- To cash-flow at today's rent, offer at most $184k (2.4% below list).
- To meet the 1% rule (rent ≥ 1% of price), the offer needs to be $171k (9.3% below list).
- Recommended offer: $171k (9.3% below list) — sets the bar for 1% rule.
- Cap rate 6.1% vs local median 3.3% in Waynesboro — top-decile yield for the area; either an underpriced asset or a hidden risk that comps aren't pricing in. Stress-test before assuming the spread holds.
Location & tenants
- Location reads 78/100 on livability (#280 in PA, #2,482 nationally) — a middle-class / working-renter tenant base. Strengths: cost of living A+, housing A+, health & safety A+; Watch: employment D, commute F.
- Waynesboro Area SD (town): math 36% / reading 52% proficiency, ranked #283 of 539 in PA (top 52%) — families likely to look elsewhere, expect single-tenant / working-renter base with shorter leases.
- Zoned schools: Fairview Avenue El Sch (math 31% / reading 52%, grade F, #927 of 1,518 statewide, top 61%, 620 students, 70% FRL); Waynesboro Area Ms (math 27% / reading 48%, grade F, #292 of 512 statewide, top 58%, 990 students, 54% FRL); Waynesboro Area Shs (math 69% / reading 24%, grade D-, #173 of 437 statewide, top 40%, 1,439 students, 47% FRL) — zoned schools average 57% FRL vs 36% district-wide (21 pts higher); higher-poverty schools than district average — tighter screening recommended.
- Market conditions: 234 active listings in the ZIP; 4 comparable units currently listed for rent nearby; rentals lingering (median 45d on market — plan ~5-8 weeks vacancy on turnover, expect pricing pressure); 75% of comp listings sitting > 30 days — soft ceiling on asking rent; 633 units permitted in Franklin County in 2024 (112 in 5+ unit buildings).
Forward outlook
- Local home prices are declining (-3.0%/yr); year-one equity from $1k of loan paydown is wiped out by about $6k of value loss. Plan a longer hold.
Negotiation context
- Only 10 days on market — expect competitive offers; lowballing is unlikely to land.
Risks & watch-outs
- Climate carrying-cost: extreme-heat days projected 7→16/yr by 2055 (HVAC capex compounding) — expect insurance premiums to compound above CPI over the hold.
Questions for the listing agent
- What do current leases actually rent for vs. the listed asking? Can we see a recent rent roll and the last 12 months of T-12 income?
- Built in 1968 — when were the roof, HVAC, electrical panel, plumbing, and water heater last replaced?
- Is there a deadline driving the sale (1031 exchange, divorce, estate, relocation)? That informs how much negotiation room exists.
- Schools are B-rated — typically a magnet for longer-tenancy family renters. What's the average tenant stay here, and is there a school-zone premium baked into asking?
- The area grade is low — what's the realistic commute time and amenity access for the typical tenant pool here? Any planned neighborhood developments (good or bad) we should know about?
- What's the average days-on-market for RENTAL listings here right now (not sales)? A rising rental-DOM trend means longer vacancies and softer asking-rent achievability than the comps imply.
- What's the recent tenant-quality profile in this submarket — average credit score on applications, eviction rate, late-payment / NSF rate, and stable-employment percentage? A property-management company in the area should have these aggregated.
- How much new for-sale + rental construction is in the pipeline within 1–3 miles? Heavy new supply typically softens prices + rents 12–24 months out; constrained supply supports both.
Investment metrics
- 1% rule
- 0.91% ✗
- Cap rate
- 6.13%
- Cash-on-cash
- -0.58%
- DSCR
- 0.97
- GRM
- 9.2
CMA / ARV
No comps found within radius.
Projected returns pro-forma
-3.0% appreciation · 3.0% rent growth · sell at horizon
- IRR
- -17.2%
- Equity multiple
- 0.39×
- Total profit
- $-32,179
- Equity at exit
- $28,181
- IRR
- -9.1%
- Equity multiple
- 0.44×
- Total profit
- $-29,822
- Equity at exit
- $16,341
Cash invested: $52,920 (down + closing). Projections, not guarantees.
Landlord ↔ Tenant lean methodology
- Overall (STATE)
- 62 Landlord-Friendly
- State Pennsylvania
- 62 Landlord-Friendly · EVEN
- County
- — inherits STATE
- City
- — inherits STATE
ZIP-level market 17268
- Active inventory
- 234
- Price-to-rent
- 9.2×
Monthly cashflow live
- Estimated rent
- $1,715 medium interval (Pro) →
- Mortgage (P&I)
- −$991
- Tax from tax record
- −$310 /mo · $3,721/yr
- Insurance
- −$79
- HOA
- −$0
- Vacancy / Maint / Mgmt
- −$360
- Net cashflow
- $-25
Break-even live
Sensitivity live
| Price | -10% $81 | -5% $28 | +0% $-25 | +5% $-79 | +10% $-132 |
|---|---|---|---|---|---|
| Rent | -10% $-161 | -5% $-93 | +0% $-25 | +5% $42 | +10% $110 |
| Rate | -1.0pp $70 | -0.5pp $23 | base $-25 | +0.5pp $-74 | +1.0pp $-124 |
UW: 25.0% down · 7.5% · 30yr · 1.5% tax · 5.0% vac · 8.0% maint · 8.0% mgmt
Financing live
Cash to close
- Down payment
- $47,250
- Closing costs
- $5,670
- Reserves months
- —
- Total cash needed
- —
Loan-product check · same deal, 3 products live
Conventional
25% down · 7.5% · 30yr
- Down + closing
- —
- Monthly P&I
- —
- Monthly cashflow
- —
- DSCR
- —
- Eligible?
- —
Personal DTI + credit; lowest rate.
DSCR
20% down · 8.5% · 30yr
- Down + closing
- —
- Monthly P&I
- —
- Monthly cashflow
- —
- DSCR
- —
- Eligible?
- —
No personal income docs; deal must DSCR.
Hard money
10% down · 12.0% · 12mo
- Down + closing
- —
- Monthly P&I
- —
- Monthly cashflow
- —
- DSCR
- —
- Eligible?
- —
Short-term bridge; refi at stabilization.
Rent comps 4 comps
| Address | Beds | Baths | Sqft | Rent | $/sqft | DOM | Units | Dist |
|---|---|---|---|---|---|---|---|---|
| 228 Ridge Ave Waynesboro, PA | 3.0 | 1.0 | 1300 | $1,500 | $1.15 | 45d | 1 | 0.68mi |
| 230 W 2nd St Unit A Waynesboro, PA | 2.0 | 2.0 | 2000 | $1,200 | $0.60 | 45d | 1 | 0.90mi |
| 23 Philadelphia Ave Waynesboro, PA | 3.0 | 3.0 | 1985 | $2,200 | $1.11 | 45d | 1 | 0.91mi |
| 457 Frick Ave Waynesboro, PA | 3.0 | 2.5 | 2193 | $2,200 | $1.00 | 22d | 1 | 1.39mi |
Listing history 14 events
-
2026-06-18status $189,000 Pending 10 DOM
-
2026-06-18days on market $189,000 Active 10 DOM
-
2026-06-17days on market $189,000 Active 9 DOM
-
2026-06-16days on market $189,000 Active 8 DOM
-
2026-06-15days on market $189,000 Active 7 DOM
-
2026-06-14days on market $189,000 Active 5 DOM
-
2026-06-13days on market $189,000 Active 4 DOM
-
2026-06-10days on market $189,000 Active 2 DOM
-
2026-06-09statusdays on market $189,000 Active 1 DOM
-
2026-06-08days on market $189,000 Coming Soon 6 DOM
-
2026-06-07days on market $189,000 Coming Soon 5 DOM
-
2026-06-05days on market $189,000 Coming Soon 2 DOM
-
2026-06-03remarks 699-char remark
-
2026-06-03$189,000 Coming Soon 1 DOM
ⓘ Source: listings_history table (triggers on properties + properties_extension) + one-shot
backfill from property_details.listing_events for pre-trigger history.
Tax reassessment forecast PA · Partial reset (capped growth)
- Current annual tax
- $3,721 · $310/mo
- Projected year-2 tax
- $3,721 · $310/mo
- Expected delta
- $0/yr ($0/mo · -0.0%)
ⓘ Screening estimate from a state-policy table — verify with the county assessor before closing.
Climate risk First Street
- Flood 1/10 Low FEMA zone X (unshaded) · 0% chance over 30 yrs
- Wildfire 1/10 Low
- Heat 5/10 Major 7 d/yr ≥100°F today · 16 d/yr by 30 yrs out
- Wind 2/10 Low 3% chance of damaging wind over 30 yrs
- Air quality 2/10 Low 1 unhealthy d/yr today · 1 by 30 yrs out
Nearby sold comps map
Loading sold comps map…
Walkable amenities ~0.75 mi
Loading nearby amenities…
Taxation est. · year 1
- Rental income
- $20,574
- − Mortgage interest
- −$10,587
- − Property taxes
- −$3,721
- − Insurance
- −$945
- − Repairs & maintenance
- −$1,646
- − Management
- −$1,646
- − Depreciation
- −$5,498
- Taxable loss
- −$3,469
- Est. tax savings @ 24.0%
- +$832
- After-tax cash flow
- $527/yr
For passive investors: Depreciation is non-cash, so a rental often shows a tax loss while cash-flowing — sheltering income. Rental losses are passive: they offset passive income freely, and up to $25,000/yr can offset ordinary (W-2) income if you actively participate and your MAGI is under $100k (phasing out to $0 by $150k); unused losses carry forward. On sale, claimed depreciation is recaptured at up to 25%, and gains may owe capital-gains tax (a 1031 exchange can defer both). Figures are a year-1 estimate at your 24.0% rate — not tax advice; consult a CPA.
Schools (NCES district)
- District
- Waynesboro Area SD
- NCES district ID
- 4225110
- Math proficiency
- 36% ▼ -15.00%
- Reading proficiency
- 52% ▼ -15.00%
- Median HH income
- $50,445
- Composite
- 37.79/100
- National rank
- #4342
- State rank
- #283 of 539 in PA
Livability — Waynesboro
- Score
- 78/100
- State rank
- #280
- US rank
- #2482
Category grades
Schools grade is shown separately in the Schools card above.
Census & demographics
- Census place
- Waynesboro, PA
- County
- Franklin County · 56,916 people
- City population
- 29,362
- Metro
- Chambersburg-Waynesboro, PA
- Population (ZIP)
- 29,362
- Household income
- $73,161
- Rent vs Own
- Severe rent burden
- 539.0
Population outlook (Franklin County) Hauer SSP2
- Today (2025)
- 157,827 people
- By 2030
- 158,933 · +0.7%
- By 2040
- 159,060 · +0.8%
- By 2050
- 155,132 · -1.7%
- By 2075
- 138,545 · -12.2%
- By 2100
- 112,321 · -28.8%
Race, ethnicity, and origin ACS 2023
- Neighborhood character
- Predominantly White (86%)
- Race & ethnicity
- White 86% Hispanic / Latino 7% Two or more races 6% Black 3%
- Hispanic origin (detail)
- Mexican 2% Puerto Rican 3%
- Common ancestry
- Lithuanian 3% Romanian 2% Slovak 2%
- Foreign-born
- 3% · Canada
- Languages at home
- 95% English-only · Spanish 4%
Political lean MEDSL · Franklin
- 2024 margin
- Solid R (+43.0) · D 28.1% · R 71.1%
- 2008→2024 swing
- -10.4pp toward R · 2008: -32.6pp · 2024: -43.0pp
- All cycles
- 2024: R+43.0 2020: R+43.1 2016: R+46.5 2012: R+38.5 2008: R+32.6
Not yet ingested
- Civics
- —
Market trends
- HPI YoY
- ▼ -113.20%
- Current HPI
- 189.6931
- Rent YoY
- —
- Metro
- Chambersburg-Waynesboro, PA
- State GDP YoY
- ▲ 1.68%
- F500 in state
- 34
Industry mix (Fortune 500 HQ in PA)
| Industry | F500 HQs | Revenue |
|---|---|---|
| Healthcare | 2 | $309B |
|
||
| Insurance | 2 | $27B |
|
||
| Telecommunications / Media | 1 | $124B |
|
||
| Industrial Distribution | 1 | $22B |
|
||
| Financial Services | 1 | $20B |
|
||
| Chemicals / Materials | 1 | $18B |
|
||
Price history
1 event — show timeline
- 2026-06-02 Coming Soon $189,000 BRIGHT MLS
Property tax history
+10.1%/yrLatest (2026): $3,721 · +0.0% YoY. Source: county tax records.
Cash-flow waterfall
monthlySold comps — $/sqft
last 12 mo · ≤1 miLoading sold comps…