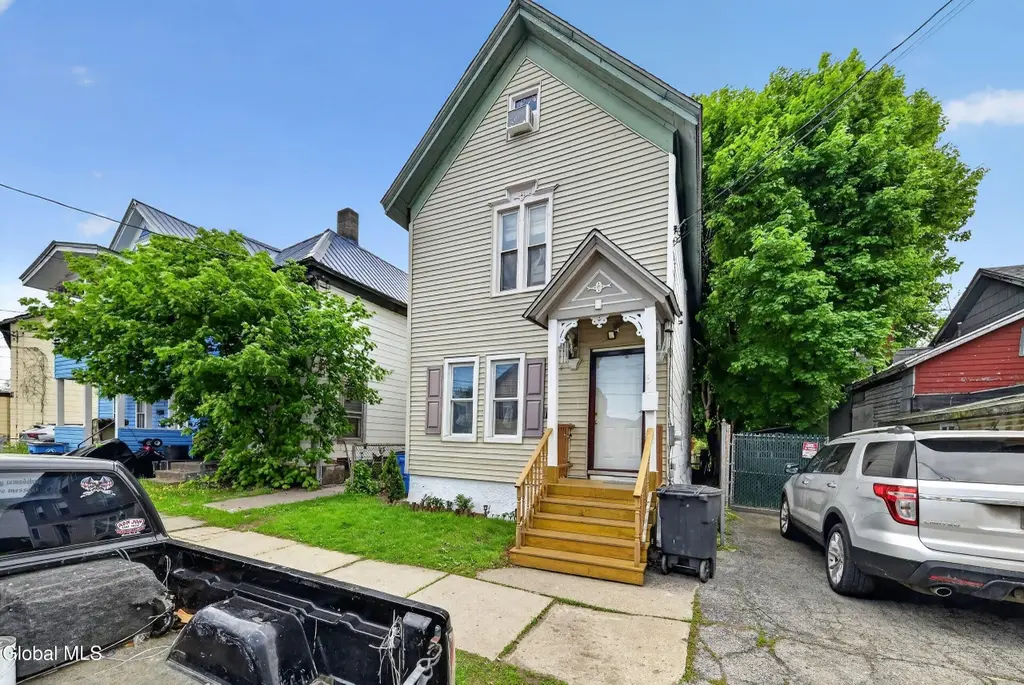
6 Water St · Johnstown, NY
Flood risk 1/10 · Minimal
- FEMA flood zone
- X
- Chance of flooding over 30 yrs
- 0.0%
- Est. flood insurance / yr
- $473 – $860
Fire risk 3/10 · Minor
- Est. fire insurance / yr
- $691 – $1,283
Heat risk 3/10 · Minor
- Hot days now (above 94°F)
- 7 days/yr
- Hot days in 30 yrs
- 17 days/yr
Wind risk 2/10 · Minimal
- Chance of severe wind over 30 yrs
- 3.0%
Air-quality risk 1/10 · Minimal
- Unhealthy air days now
- 0 days/yr
- Unhealthy air days in 30 yrs
- 0 days/yr
Risk factors via First Street. Map © Google.
Why this score? — see what drove the C grade
The composite is a weighted blend of 9 inputs, each scored 0–100. Each bar is that input's sub-score; the figure is the points it added to the 100-point composite (weight × sub-score).
- Cash flow +19.6/30.0
- Appreciation +10.0/10.0
- DSCR +6.2/10.0
- ARV discount +5.5/15.0
- 1% rule +4.6/10.0
- Livability +3.9/5.0
- Schools +3.5/10.0
- Rent growth +2.5/5.0
- Condition / age +2.5/5.0
$154,999
🖨 Deal sheet 📄 Offer letter ✓ Due diligence
Listing remarks
Beautifully updated home in the heart of Johnstown! This charming 3-bedroom, 1 full bath home offers the perfect blend of modern updates and comfort, featuring new flooring, fresh sheetrock, new kitchen countertops and a beautifully remodeled bathroom. The fully fenced backyard provides great space for entertaining, pets, or relaxing outdoors. Conveniently located close to local shops, schools, and amenities, this property also includes an additional lot on Canal Street (SBL #162.20-7-11), offering extra parking and added potential. Move-in ready and full of value, this is a wonderful opportunity to own a beautifully refreshed home in a great location!
Key facts
- Remodeled bathroom
- New flooring
- Additional lot
Tags
Property features AI
Exterior
- Parking: Off-street parking (1 space); Has garage
- Utilities: 100 Amp electric service; Public water; Public sewer
- Home design: Single family residence; Vinyl siding construction; Shingle roof
- Construction: Vinyl siding
- Exterior features: Back yard fencing; Front porch
Interior
- Kitchen: Oven; Refrigerator
- Bedrooms: Three bedrooms on the second floor
- Bathrooms: One full bathroom on the first floor; One half bathroom on the first floor
- Heating & cooling: Forced air heating; Natural gas heating
- Interior features: Seven total rooms; Front porch
- Laundry & utility: Laundry in the basement
Neighborhood map
What this means for you Summary
Snapshot
- This is a 3-bed/1.0-bath single-family listed at $155k.
Deal economics
- At list price, monthly cash flow is $178 ($2k/yr) — positive.
- The deal already cash-flows at list — no discount required.
- To meet the 1% rule (rent ≥ 1% of price), the offer needs to be $149k (3.7% below list).
- Recommended offer: $149k (3.7% below list) — sets the bar for 1% rule.
- Cap rate 7.7% vs local median 4.0% in Johnstown — top-decile yield for the area; either an underpriced asset or a hidden risk that comps aren't pricing in. Stress-test before assuming the spread holds.
Location & tenants
- Location reads 78/100 on livability (#168 in NY, #2,603 nationally) — a middle-class / working-renter tenant base. Strengths: housing A+, health & safety A+, cost of living A; Watch: crime D-, amenities D-.
- Johnstown City School District (town): math 35% / reading 47% proficiency, ranked #509 of 590 in NY (top 86%) — families likely to look elsewhere, expect single-tenant / working-renter base with shorter leases.
- Market conditions: 82 active listings in the ZIP; 112 units permitted in Fulton County in 2024 (50 in 5+ unit buildings).
Forward outlook
- In year one you build about $17k of equity ($1k loan paydown + $16k appreciation (10.0% local appreciation)).
- Fulton County population projected at -23% by 2050 — secular population decline; favor cash flow + early exit over multi-decade hold.
- At projected returns (10.0% appreciation + 3.0% rent growth), your $43k cash investment doubles in ~3 years — after that, you're playing with house money.
- By year 3, paydown + projected appreciation supports a ~$42k cash-out refi (75% LTV) — recoverable capital for the next deal without selling this one.
Negotiation context
- It's been on market 23 days — a 2% lower offer ($153k) is reasonable based on typical stale-listing flexibility.
- 2 sale attempts with the ask held roughly flat each time — persistent listings suggest the price (not the market) is what's stuck; bring a comps-based counter.
- Current owner paid $12k; list at $155k implies a 1140% gain — meaningful room to come down on a strong offer.
Risks & watch-outs
- Watch-outs: built in 1890 — expect roof / HVAC / electrical / plumbing capex.
Questions for the listing agent
- Built in 1890 — when were the roof, HVAC, electrical panel, plumbing, and water heater last replaced?
- Is there a deadline driving the sale (1031 exchange, divorce, estate, relocation)? That informs how much negotiation room exists.
- Crime grade is D in this area — have there been break-ins, vandalism, or insurance claims at this property in the last 3 years? What carrier currently insures it and at what premium?
- What's the average days-on-market for RENTAL listings here right now (not sales)? A rising rental-DOM trend means longer vacancies and softer asking-rent achievability than the comps imply.
- What's the recent tenant-quality profile in this submarket — average credit score on applications, eviction rate, late-payment / NSF rate, and stable-employment percentage? A property-management company in the area should have these aggregated.
- How much new for-sale + rental construction is in the pipeline within 1–3 miles? Heavy new supply typically softens prices + rents 12–24 months out; constrained supply supports both.
Investment metrics
- 1% rule
- 0.96% ✗
- Cap rate
- 7.67%
- Cash-on-cash
- 4.93%
- DSCR
- 1.22
- GRM
- 8.7
CMA / ARV
- ARV (on-the-fly)
- $148,308
- Comps found
- 12
Show comp detail 12 sales within ~0.75 mi
| Address | Dist | Beds/Ba | Sqft | Sold | Price | $/sf | Match |
|---|---|---|---|---|---|---|---|
| 6 Mason St | 0.18mi | 3/1.0 | 1,422 (-2%) | 2mo | $50,119 | $35 | 86 |
| 214 N Chase St | 0.41mi | 3/1.0 | 1,458 (+0%) | 3mo | $130,000 | $89 | 78 |
| 225 N Chase St | 0.36mi | 3/1.0 | 1,408 (-3%) | 2mo | $240,000 | $170 | 76 |
| 9 Grove St | 0.19mi | 3/1.5 | 1,344 (-8%) | 8mo | $256,701 | $191 | 70 |
| 44 S Perry St | 0.50mi | 3/1.5 | 1,418 (-2%) | 2mo | $68,000 | $48 | 69 |
| 19 Matthew St | 0.46mi | 3/1.0 | 1,529 (+5%) | 4mo | $65,000 | $43 | 66 |
| 23 Briggs St | 0.28mi | 3/1.0 | 1,300 (-11%) | 6mo | $152,000 | $117 | 65 |
| 2 S Chase St | 0.57mi | 3/1.5 | 1,474 (+1%) | 6mo | $149,900 | $102 | 64 |
| 519 N Market St | 0.31mi | 2/1.0 (-1) | 1,288 (-11%) | 6mo | $94,600 | $73 | 56 |
| 32 S Chase St | 0.66mi | 3/1.5 | 1,270 (-13%) | 6mo | $55,000 | $43 | 41 |
| 11 Abel Dr | 0.74mi | 3/2.0 | 1,300 (-11%) | 6mo | $245,000 | $188 | 39 |
| 19 O'neil Ave | 0.70mi | 3/1.0 | 1,248 (-14%) | 6mo | $180,000 | $144 | 39 |
Match score weights: distance 35% · size 25% · config 20% · recency 20%. Top-matched comps best support the ARV.
Projected returns pro-forma
10.0% appreciation · 3.0% rent growth · sell at horizon
- IRR
- 27.8%
- Equity multiple
- 3.21×
- Total profit
- $95,748
- Equity at exit
- $139,635
- IRR
- 24.3%
- Equity multiple
- 7.29×
- Total profit
- $272,994
- Equity at exit
- $301,129
Cash invested: $43,400 (down + closing). Projections, not guarantees.
Landlord ↔ Tenant lean methodology
- Overall (STATE)
- 15 Strongly Tenant-Friendly
- State New York
- 15 Strongly Tenant-Friendly · D+10
- County
- — inherits STATE
- City
- — inherits STATE
ZIP-level market 12095
- Home prices YoY
- 3.8%
- Active inventory
- 82
- Price-to-rent
- 8.7×
Monthly cashflow live
- Estimated rent
- $1,493 medium interval (Pro) →
- Mortgage (P&I)
- −$813
- Tax from tax record
- −$124 /mo · $1,482/yr
- Insurance
- −$65
- HOA
- −$0
- Vacancy / Maint / Mgmt
- −$313
- Net cashflow
- $178
Break-even live
UW: 25.0% down · 7.5% · 30yr · 1.5% tax · 5.0% vac · 8.0% maint · 8.0% mgmt
Financing live
Cash to close
- Down payment
- $38,750
- Closing costs
- $4,650
- Reserves months
- —
- Total cash needed
- —
Loan-product check · same deal, 3 products live
Conventional
25% down · 7.5% · 30yr
- Down + closing
- —
- Monthly P&I
- —
- Monthly cashflow
- —
- DSCR
- —
- Eligible?
- —
Personal DTI + credit; lowest rate.
DSCR
20% down · 8.5% · 30yr
- Down + closing
- —
- Monthly P&I
- —
- Monthly cashflow
- —
- DSCR
- —
- Eligible?
- —
No personal income docs; deal must DSCR.
Hard money
10% down · 12.0% · 12mo
- Down + closing
- —
- Monthly P&I
- —
- Monthly cashflow
- —
- DSCR
- —
- Eligible?
- —
Short-term bridge; refi at stabilization.
Listing history 23 events
-
2026-06-18days on market $154,999 Active 23 DOM
-
2026-06-17days on market $154,999 Active 22 DOM
-
2026-06-16days on market $154,999 Active 21 DOM
-
2026-06-15days on market $154,999 Active 20 DOM
-
2026-06-13days on market $154,999 Active 18 DOM
-
2026-06-12days on market $154,999 Active 17 DOM
-
2026-06-09days on market $154,999 Active 14 DOM
-
2026-06-08days on market $154,999 Active 13 DOM
-
2026-06-07days on market $154,999 Active 12 DOM
-
2026-06-07days on market $154,999 Active 11 DOM
-
2026-06-04days on market $154,999 Active 8 DOM
-
2026-06-02days on market $154,999 Active 7 DOM
-
2026-06-01days on market $154,999 Active 6 DOM
-
2026-05-31days on market $154,999 Active 5 DOM
-
2026-05-26$154,999 Active
-
2025-11-19historical
-
2025-10-19price $139,900
-
2025-09-23price $149,000
-
2025-08-17price $155,000
-
2025-06-25price $165,000
-
2025-05-24price $172,500
-
2025-05-12$179,500 Active
-
2014-07-29soldstatus $12,500
ⓘ Source: listings_history table (triggers on properties + properties_extension) + one-shot
backfill from property_details.listing_events for pre-trigger history.
Tax reassessment forecast NY · Partial reset (capped growth)
- Current annual tax
- $1,482 · $124/mo
- Projected year-2 tax
- $2,051 · $171/mo
- Expected delta
- +$569/yr (+$47/mo · 38.4%)
ⓘ Screening estimate from a state-policy table — verify with the county assessor before closing.
Climate risk First Street
- Flood 1/10 Low FEMA zone X · 0% chance over 30 yrs
- Wildfire 3/10 Moderate
- Heat 3/10 Moderate 7 d/yr ≥94°F today · 17 d/yr by 30 yrs out
- Wind 2/10 Low 3% chance of damaging wind over 30 yrs
- Air quality 1/10 Low 0 unhealthy d/yr today · 0 by 30 yrs out
Nearby sold comps map
Loading sold comps map…
Walkable amenities ~0.75 mi
Loading nearby amenities…
Taxation est. · year 1
- Rental income
- $17,911
- − Mortgage interest
- −$8,682
- − Property taxes
- −$1,482
- − Insurance
- −$775
- − Repairs & maintenance
- −$1,433
- − Management
- −$1,433
- − Depreciation
- −$4,509
- Taxable loss
- −$403
- Est. tax savings @ 24.0%
- +$97
- After-tax cash flow
- $2,236/yr
For passive investors: Depreciation is non-cash, so a rental often shows a tax loss while cash-flowing — sheltering income. Rental losses are passive: they offset passive income freely, and up to $25,000/yr can offset ordinary (W-2) income if you actively participate and your MAGI is under $100k (phasing out to $0 by $150k); unused losses carry forward. On sale, claimed depreciation is recaptured at up to 25%, and gains may owe capital-gains tax (a 1031 exchange can defer both). Figures are a year-1 estimate at your 24.0% rate — not tax advice; consult a CPA.
Schools (NCES district)
- District
- Johnstown City School District
- NCES district ID
- 3615980
- Math proficiency
- 35% ▼ -8.00%
- Reading proficiency
- 47% ▲ 4.00%
- Median HH income
- $45,999
- Composite
- 34.89/100
- National rank
- #5082
- State rank
- #509 of 590 in NY
Livability — Johnstown
- Score
- 78/100
- State rank
- #168
- US rank
- #2603
Category grades
Schools grade is shown separately in the Schools card above.
Census & demographics
- Census place
- Johnstown, NY
- Population (ZIP)
- 12,013
Population outlook (Fulton County) Hauer SSP2
- Today (2025)
- 51,132 people
- By 2030
- 49,114 · -3.9%
- By 2040
- 44,373 · -13.2%
- By 2050
- 39,321 · -23.1%
- By 2075
- 28,503 · -44.3%
- By 2100
- 19,268 · -62.3%
Race, ethnicity, and origin ACS 2023
- Neighborhood character
- Predominantly White (90%)
- Race & ethnicity
- White 90% Hispanic / Latino 4% Two or more races 4% Black 2%
- Common ancestry
- Iranian 6% Romanian 5% Lithuanian 4%
- Foreign-born
- 2% · Canada
- Languages at home
- 97% English-only · Spanish 2%
Political lean MEDSL · Fulton
- 2024 margin
- Solid R (+35.9) · D 32.1% · R 67.9%
- 2008→2024 swing
- -26.6pp toward R · 2008: -9.2pp · 2024: -35.9pp
- All cycles
- 2024: R+35.9 2020: R+31.4 2016: R+35.5 2012: R+10.5 2008: R+9.2
Not yet ingested
- Civics
- —
Market trends
- HPI YoY
- ▲ 10.82%
- Current HPI
- 297.365
- Rent YoY
- —
- Metro
- —
- State GDP YoY
- ▲ 2.60%
- F500 in state
- 92
Industry mix (Fortune 500 HQ in NY)
| Industry | F500 HQs | Revenue |
|---|---|---|
| Financial Services | 10 | $950B |
|
||
| Consumer Goods | 9 | $162B |
|
||
| Insurance | 4 | $225B |
|
||
| Telecommunications | 2 | $144B |
|
||
| Pharmaceuticals | 2 | $112B |
|
||
| Media / Entertainment | 2 | $69B |
|
||
Price history
+1140.0% since first listed9 events — show timeline
- 2026-05-26 Listed $154,999 Global MLS
- 2025-11-19 Listing Removed — Global MLS
- 2025-10-19 Price Changed $139,900 Global MLS
- 2025-09-23 Price Changed $149,000 Global MLS
- 2025-08-17 Price Changed $155,000 Global MLS
- 2025-06-25 Price Changed $165,000 Global MLS
- 2025-05-24 Price Changed $172,500 Global MLS
- 2025-05-12 Listed $179,500 Global MLS
- 2014-07-29 Sold (Public Records) $12,500 Public Records
Property tax history
+6.0%/yrLatest (2025): $1,482 · +55.4% YoY. Source: county tax records.
Cash-flow waterfall
monthlySold comps — $/sqft
last 12 mo · ≤1 miLoading sold comps…