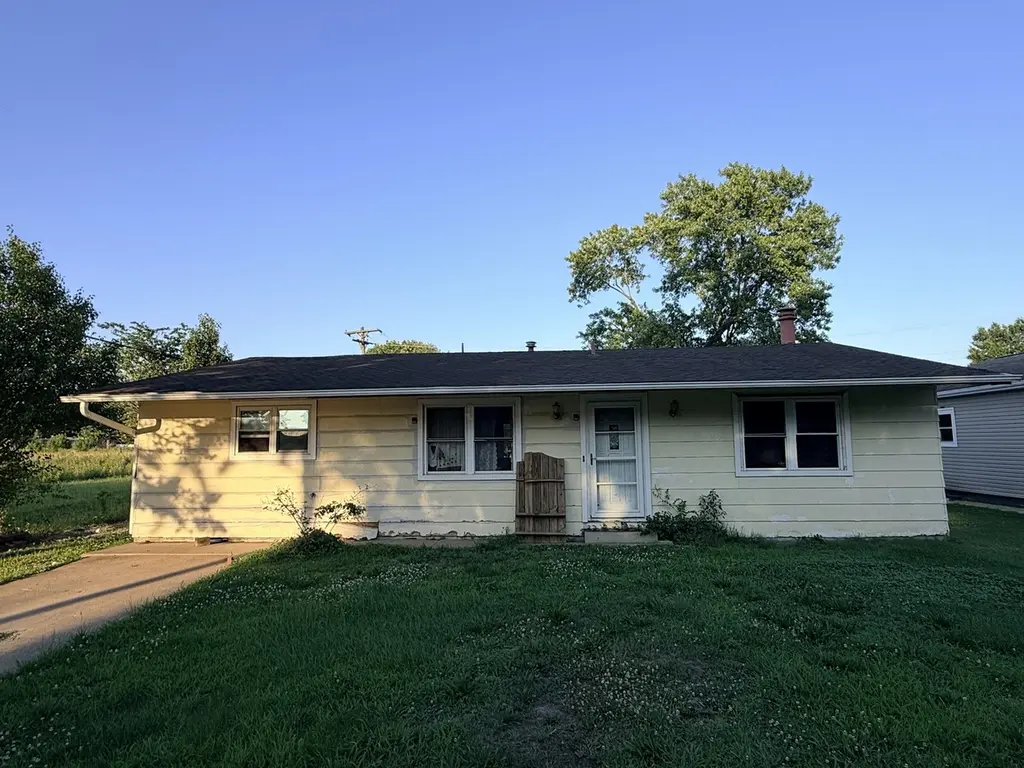
1322 N 16th St · Murphysboro, IL
Flood risk 4/10 · Minor
- FEMA flood zone
- X (shaded)
- Chance of flooding over 30 yrs
- 0.2%
- Est. flood insurance / yr
- $507 – $1,088
Fire risk 1/10 · Minimal
- Est. fire insurance / yr
- $804 – $1,492
Heat risk 5/10 · Moderate
- Hot days now (above 108°F)
- 7 days/yr
- Hot days in 30 yrs
- 21 days/yr
Wind risk 2/10 · Minimal
- Chance of severe wind over 30 yrs
- 2.0%
Air-quality risk 1/10 · Minimal
- Unhealthy air days now
- 0 days/yr
- Unhealthy air days in 30 yrs
- 0 days/yr
Risk factors via First Street. Map © Google.
Why this score? — see what drove the B- grade
The composite is a weighted blend of 9 inputs, each scored 0–100. Each bar is that input's sub-score; the figure is the points it added to the 100-point composite (weight × sub-score).
- Cash flow +30.0/30.0
- 1% rule +10.0/10.0
- DSCR +10.0/10.0
- ARV discount +7.5/15.0
- Livability +2.7/5.0
- Rent growth +2.5/5.0
- Condition / age +2.5/5.0
- Schools +0.8/10.0
- Appreciation +0.0/10.0
$29,900
🖨 Deal sheet (PDF) 📄 Offer letter ✓ Due diligence
Listing remarks
Investor opportunity! This 4-bedroom, 2.5-bath ranch-style home is located in a great area near the high school and offers endless possibilities. With a spacious layout and plenty of square footage, this property is ready for someone with vision to bring it back to life. Ideal for investors, renovators, or buyers looking for a project, this home has the potential to be transformed into something special. Being sold as-is. Don't miss your chance to unlock the value this property has to offer.
Key facts
- 9,000 sq ft lot
- Garage
- Built 1962
Property features AI
Finance
- Other: Property located in unincorporated area; Possession at closing; Earnest money is held; Directions: From Gartside St turn on N 16th St all the way, last home on the right
- HOA & community: No master association fees (not required)
Exterior
- Parking: Three total parking spaces; Garage faces side
- Utilities: Public water; Public sewer
- Home design: Detached single-family home; One-story layout; Fee simple ownership; Built before 1978 (age approximately 61–70 years)
- Construction: Constructed with other materials
- Exterior features: Lot dimensions approximately 75 x 120; Lot smaller than 0.25 acre
Interior
- Kitchen: Kitchen on the main level
- Bedrooms: Four bedrooms (all on the main level); Master bedroom on the main level with full bath
- Flooring: Hardwood flooring in two bedrooms; Laminate flooring in living room and master bedroom; Other flooring in one bedroom and kitchen
- Bathrooms: Two full bathrooms and one half bathroom
- Heating & cooling: Natural gas forced air heating; Central air conditioning
- Interior features: Six total rooms; Crawl space basement; One fireplace
- Laundry & utility: Laundry room
Neighborhood map
What this means for you Summary
Snapshot
- This is a 1-bed/2.5-bath single-family listed at $30k.
Deal economics
- At list price, monthly cash flow is $564 ($7k/yr) — positive.
- The deal already cash-flows at list — no discount required.
- Meets the 1% rule at list price ($975 rent vs $30k).
- Cap rate 28.9% vs local median 6.3% in Murphysboro — top-decile yield for the area; either an underpriced asset or a hidden risk that comps aren't pricing in. Stress-test before assuming the spread holds.
Location & tenants
- Location reads 54/100 on livability (#1,265 in IL) — a working-class tenant base; expect higher turnover. Strengths: cost of living A+, housing A-; Watch: crime D-, amenities F, commute F.
- Murphysboro CUSD 186 (town): math 9% / reading 10% proficiency, ranked #585 of 620 in IL (top 94%) — low school quality limits family demand, transient renter base, plan for 1-2y turnover; 62% free/reduced lunch — lower-income household profile, screen leases tightly.
- Zoned schools: Carruthers Elementary School (math 11% / reading 11%, grade F, #1,460 of 2,056 statewide, top 72%, 406 students, 0% FRL); Murphysboro Middle School (math 4% / reading 6%, grade F, #636 of 665 statewide, top 98%, 444 students, 0% FRL); Murphysboro High School (math 17% / reading 17%, grade F, #430 of 693 statewide, top 66%, 598 students, 0% FRL) — zoned schools average 0% FRL vs 62% district-wide (62 pts lower); this property's tenant base skews higher-income than the district average.
- Market conditions: 81 active listings in the ZIP; 5 units permitted in Jackson County in 2024 (0 in 5+ unit buildings).
Forward outlook
- Local home prices are declining (-3.0%/yr); year-one equity from $207 of loan paydown is wiped out by about $897 of value loss. Plan a longer hold.
- At projected returns (-3.0% appreciation + 3.0% rent growth), your $8k cash investment doubles in ~2 years — after that, you're playing with house money.
Negotiation context
- Only 11 days on market — expect competitive offers; lowballing is unlikely to land.
Risks & watch-outs
- Climate carrying-cost: extreme-heat days projected 7→21/yr by 2055 (HVAC capex compounding) — expect insurance premiums to compound above CPI over the hold.
Questions for the listing agent
- Built in 1962 — when were the roof, HVAC, electrical panel, plumbing, and water heater last replaced?
- Is there a deadline driving the sale (1031 exchange, divorce, estate, relocation)? That informs how much negotiation room exists.
- Schools are F-rated, which usually means shorter tenancies and higher turnover. Who's the typical renter profile here, and what's been the actual vacancy rate?
- Crime grade is D in this area — have there been break-ins, vandalism, or insurance claims at this property in the last 3 years? What carrier currently insures it and at what premium?
- What's the average days-on-market for RENTAL listings here right now (not sales)? A rising rental-DOM trend means longer vacancies and softer asking-rent achievability than the comps imply.
- What's the recent tenant-quality profile in this submarket — average credit score on applications, eviction rate, late-payment / NSF rate, and stable-employment percentage? A property-management company in the area should have these aggregated.
- How much new for-sale + rental construction is in the pipeline within 1–3 miles? Heavy new supply typically softens prices + rents 12–24 months out; constrained supply supports both.
Investment metrics
- 1% rule
- 3.26% ✓
- Cap rate
- 28.91%
- Cash-on-cash
- 80.79%
- DSCR
- 4.59
- GRM
- 2.6
CMA / ARV
- ARV (on-the-fly)
- $168,448
- Comps found
- 4
Show comp detail 4 sales within ~0.75 mi
| Address | Dist | Beds/Ba | Sqft | Sold | Price | $/sf | Match |
|---|---|---|---|---|---|---|---|
| 1006 Steven Ln | 0.44mi | 2/2.5 (+1) | 1,516 (+1%) | 12mo | $169,900 | $112 | 63 |
| 1006 Steven Ln | 0.44mi | 2/2.5 (+1) | 1,516 (+1%) | 12mo | $169,900 | $112 | 63 |
| 1106 N 11th St | 0.46mi | 2/1.0 (+1) | 1,692 (+12%) | 10mo | $85,800 | $51 | 39 |
| 1106 N 11th St | 0.46mi | 2/1.0 (+1) | 1,692 (+12%) | 10mo | $85,800 | $51 | 39 |
Match score weights: distance 35% · size 25% · config 20% · recency 20%. Top-matched comps best support the ARV.
Projected returns pro-forma
-3.0% appreciation · 3.0% rent growth · sell at horizon
- IRR
- 81.0%
- Equity multiple
- 4.71×
- Total profit
- $31,067
- Equity at exit
- $4,458
- IRR
- 84.4%
- Equity multiple
- 9.76×
- Total profit
- $73,335
- Equity at exit
- $2,585
Cash invested: $8,372 (down + closing). Projections, not guarantees.
Landlord ↔ Tenant lean methodology
- Overall (STATE)
- 43 Moderately Tenant-Leaning
- State Illinois
- 43 Moderately Tenant-Leaning · D+7
- County
- — inherits STATE
- City
- — inherits STATE
ZIP-level market 62966
- Active inventory
- 81
- Price-to-rent
- 2.6×
Monthly cashflow live
- Estimated rent
- $975 medium interval (Pro) →
- Mortgage (P&I)
- −$157
- Tax est. 1.5%
- −$37 /mo · $448/yr
- Insurance
- −$12
- HOA
- −$0
- Lot rent
- −$0
- Vacancy / Maint / Mgmt
- −$205
- Net cashflow
- $564
Break-even live
Sensitivity live
| Price | -10% $584 | -5% $574 | +0% $564 | +5% $553 | +10% $543 |
|---|---|---|---|---|---|
| Rent | -10% $487 | -5% $525 | +0% $564 | +5% $602 | +10% $641 |
| Rate | -1.0pp $579 | -0.5pp $571 | base $564 | +0.5pp $556 | +1.0pp $548 |
UW: 25.0% down · 7.5% · 30yr · 1.5% tax · 5.0% vac · 8.0% maint · 8.0% mgmt
Financing live
Cash to close
- Down payment
- $7,475
- Closing costs
- $897
- Reserves months
- —
- Total cash needed
- —
Loan-product check · same deal, 3 products live
Conventional
25% down · 7.5% · 30yr
- Down + closing
- —
- Monthly P&I
- —
- Monthly cashflow
- —
- DSCR
- —
- Eligible?
- —
Personal DTI + credit; lowest rate.
DSCR
20% down · 8.5% · 30yr
- Down + closing
- —
- Monthly P&I
- —
- Monthly cashflow
- —
- DSCR
- —
- Eligible?
- —
No personal income docs; deal must DSCR.
Hard money
10% down · 12.0% · 12mo
- Down + closing
- —
- Monthly P&I
- —
- Monthly cashflow
- —
- DSCR
- —
- Eligible?
- —
Short-term bridge; refi at stabilization.
Listing history 9 events
-
2026-06-22days on market $29,900 Active 11 DOM
-
2026-06-19days on market $29,900 Active 8 DOM
-
2026-06-18days on market $29,900 Active 7 DOM
-
2026-06-17days on market $29,900 Active 6 DOM
-
2026-06-16days on market $29,900 Active 5 DOM
-
2026-06-15days on market $29,900 Active 4 DOM
-
2026-06-14days on market $29,900 Active 2 DOM
-
2026-06-13remarks 496-char remark
-
2026-06-13$29,900 Active 1 DOM
ⓘ Source: listings_history table (triggers on properties + properties_extension) + one-shot
backfill from property_details.listing_events for pre-trigger history.
Climate risk First Street
- Flood 4/10 Moderate FEMA zone X (shaded) · 20% chance over 30 yrs
- Wildfire 1/10 Low
- Heat 5/10 Major 7 d/yr ≥108°F today · 21 d/yr by 30 yrs out
- Wind 2/10 Low 2% chance of damaging wind over 30 yrs
- Air quality 1/10 Low 0 unhealthy d/yr today · 0 by 30 yrs out
Nearby sold comps map
Loading sold comps map…
Walkable amenities ~0.75 mi
Loading nearby amenities…
Taxation est. · year 1
- Rental income
- $11,700
- − Mortgage interest
- −$1,675
- − Property taxes
- −$448
- − Insurance
- −$150
- − Repairs & maintenance
- −$936
- − Management
- −$936
- − Depreciation
- −$870
- Taxable income
- $6,685
- Est. tax owed @ 24.0%
- −$1,604
- After-tax cash flow
- $5,159/yr
For passive investors: Depreciation is non-cash, so a rental often shows a tax loss while cash-flowing — sheltering income. Rental losses are passive: they offset passive income freely, and up to $25,000/yr can offset ordinary (W-2) income if you actively participate and your MAGI is under $100k (phasing out to $0 by $150k); unused losses carry forward. On sale, claimed depreciation is recaptured at up to 25%, and gains may owe capital-gains tax (a 1031 exchange can defer both). Figures are a year-1 estimate at your 24.0% rate — not tax advice; consult a CPA.
Schools (NCES district)
- District
- Murphysboro CUSD 186
- NCES district ID
- 1727610
- Math proficiency
- 9% ▼ -9.00%
- Reading proficiency
- 10% ▼ -8.00%
- Median HH income
- $36,963
- Composite
- 7.97/100
- National rank
- #9925
- State rank
- #585 of 620 in IL
Livability — Murphysboro
- Score
- 54/100
- State rank
- #1265
- US rank
- #23786
Category grades
Schools grade is shown separately in the Schools card above.
Census & demographics
- Census place
- Murphysboro, IL
- City population
- 13,995
- Population (ZIP)
- 13,995
Population outlook (Jackson County) Hauer SSP2
- Today (2025)
- 59,093 people
- By 2030
- 59,628 · +0.9%
- By 2040
- 59,495 · +0.7%
- By 2050
- 58,811 · -0.5%
- By 2075
- 57,683 · -2.4%
- By 2100
- 55,337 · -6.4%
Race, ethnicity, and origin ACS 2023
- Neighborhood character
- Predominantly White (77%)
- Race & ethnicity
- White 77% Hispanic / Latino 8% Black 8% Two or more races 6%
- Hispanic origin (detail)
- Mexican 3% Puerto Rican 1%
- Common ancestry
- Lithuanian 5% Slovak 3% Italian 2%
- Foreign-born
- 4% · Canada, South Korea
- Languages at home
- 91% English-only · Spanish 6% Russian/Polish/Slavic 1%
Political lean MEDSL · Jackson
- 2024 margin
- Toss-up / Even · D 51.0% · R 47.5% · Other 1.4%
- 2008→2024 swing
- -18.3pp toward R · 2008: 21.8pp · 2024: 3.5pp
- All cycles
- 2024: D+3.5 2020: D+1.3 2016: D+3.0 2012: D+10.3 2008: D+21.8
Not yet ingested
- Civics
- —
Market trends
- HPI YoY
- ▼ -76.39%
- Current HPI
- 95.9393
- Rent YoY
- —
- Metro
- —
- State GDP YoY
- ▲ 1.59%
- F500 in state
- 60
Industry mix (Fortune 500 HQ in IL)
| Industry | F500 HQs | Revenue |
|---|---|---|
| Insurance | 4 | $201B |
|
||
| Consumer Goods | 4 | $87B |
|
||
| Industrial Machinery | 3 | $64B |
|
||
| Healthcare | 2 | $55B |
|
||
| Retail / Pharmacy | 1 | $148B |
|
||
| Agriculture / Food | 1 | $86B |
|
||
Price history
1 event — show timeline
- 2026-06-12 Listed $29,900 MRED as Distributed by MLS Grid
Property tax history
+8.6%/yrLatest (2024): $2,543 · +1.5% YoY. Source: county tax records.
Cash-flow waterfall
monthlySold comps — $/sqft
last 12 mo · ≤1 miLoading sold comps…