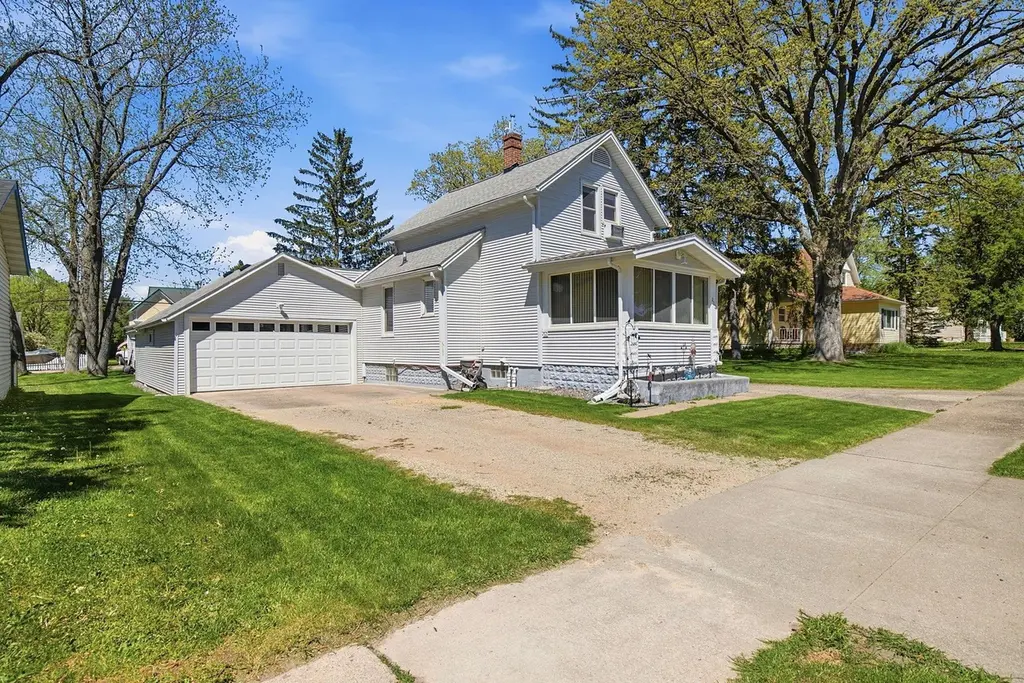
222 3rd St · Kenyon, MN
Flood risk 1/10 · Minimal
- FEMA flood zone
- X (unshaded)
- Chance of flooding over 30 yrs
- 0.0%
- Est. flood insurance / yr
- $473 – $860
Fire risk 1/10 · Minimal
- Est. fire insurance / yr
- $888 – $1,650
Heat risk 2/10 · Minimal
- Hot days now (above 100°F)
- 7 days/yr
- Hot days in 30 yrs
- 15 days/yr
Wind risk 2/10 · Minimal
- Chance of severe wind over 30 yrs
- —
Air-quality risk 2/10 · Minimal
- Unhealthy air days now
- 1 days/yr
- Unhealthy air days in 30 yrs
- 1 days/yr
Risk factors via First Street. Map © Google.
Why this score? — see what drove the D grade
The composite is a weighted blend of 9 inputs, each scored 0–100. Each bar is that input's sub-score; the figure is the points it added to the 100-point composite (weight × sub-score).
- Appreciation +10.0/10.0
- Cash flow +7.6/30.0
- ARV discount +7.5/15.0
- Livability +3.8/5.0
- Schools +3.3/10.0
- Rent growth +2.5/5.0
- Condition / age +2.5/5.0
- DSCR +1.7/10.0
- 1% rule +1.5/10.0
$249,900
🖨 Deal sheet (PDF) 📄 Offer letter ✓ Due diligence
Listing remarks
Looking for more outdoor space and a workshop? This immaculate property has a beautiful large yard, double garage with an attached workshop and an additional storage shed - great for all your storage & hobby needs! The beautiful, very well-cared for home boasts maintenance free siding, all newer windows, updated kitchen with built-in wall oven, beautiful front sun room, and 200+ amp electric with heater in garage & shop which have 220 volt hookup. Basement is professionally waterproofed, and main drain to street was resurfaced & sealed. Newer entry doors, steps, nice patio, concrete apron in front of garage, are just a few of the details you will appreciate. There are beau
Key facts
- 0.24 acre lot
- 2 garage spots
- Built 1900
Property features AI
Finance
- Other: Above-grade finished area: 1,052; Below-grade finished area: 50; Total living area reported as 1,102; Total building area: 1,436; Other structures include workshop and storage shed
Exterior
- Parking: Attached heated and insulated garage with garage door opener (2-car, 18x24); Gravel and concrete surfaces; No interior access to dwelling
- Utilities: City water (connected); City sewer (connected); 200+ amp electrical service; Natural gas
- Home design: Residential property; One and one-half levels; Sun room
- Construction: Frame construction; Asphalt roof; Other foundation; Year built: not provided
- Exterior features: Vinyl exterior; Patio; Workshop; Storage shed; Light tree coverage; City street frontage; Publicly maintained road
Interior
- Kitchen: Cooktop; Wall oven; Dishwasher; Refrigerator; Kitchen window
- Bedrooms: 2 bedrooms (both on the upper level)
- Flooring: Hardwood floors
- Bathrooms: One full bathroom (upper level); One 3/4 bathroom (basement)
- Heating & cooling: Forced air heating; Central air conditioning
- Interior features: Ceiling fan(s); Hardwood floors; Natural woodwork; Sun room; Eat-in kitchen; Water softener (rented)
- Laundry & utility: Washer and dryer (hookup); Washer; Dryer; Gas water heater
Neighborhood map
What this means for you Summary
Snapshot
- This is a 2-bed/1.5-bath single-family listed at $250k.
Deal economics
- At list price, monthly cash flow is $-298 ($-4k/yr) — negative.
- To cash-flow at today's rent, offer at most $197k (21.1% below list).
- To meet the 1% rule (rent ≥ 1% of price), the offer needs to be $163k (34.9% below list).
- Recommended offer: $163k (34.9% below list) — sets the bar for 1% rule.
Location & tenants
- Location reads 76/100 on livability (#172 in MN, #3,700 nationally) — a middle-class / working-renter tenant base. Strengths: crime A+, cost of living A+, housing A+; Watch: amenities F, commute F.
- Kenyon-Wanamingo School District (rural): math 34% / reading 41% proficiency, ranked #230 of 301 in MN (top 76%) — families likely to look elsewhere, expect single-tenant / working-renter base with shorter leases.
- Zoned schools: Kenyon-Wanamingo Elementary (math 57% / reading 47%, grade C-, #368 of 857 statewide, top 47%, 219 students, 36% FRL); Kenyon-Wanamingo Middle (math 26% / reading 37%, grade F, #190 of 258 statewide, top 74%, 208 students, 40% FRL); Kenyon-Wanamingo Senior High (math 24% / reading 44%, grade F, #306 of 471 statewide, top 70%, 227 students, 31% FRL).
- Market conditions: 36 active listings in the ZIP; 86 units permitted in Goodhue County in 2024 (0 in 5+ unit buildings).
Forward outlook
- In year one you build about $27k of equity ($2k loan paydown + $25k appreciation (10.0% local appreciation)).
- Goodhue County population projected at -11% by 2050 — secular population decline; favor cash flow + early exit over multi-decade hold.
- By year 2, paydown + projected appreciation supports a ~$43k cash-out refi (75% LTV) — recoverable capital for the next deal without selling this one.
Negotiation context
- It's been on market 19 days — a 2% lower offer ($246k) is reasonable based on typical stale-listing flexibility.
Risks & watch-outs
- Watch-outs: built in 1900 — expect roof / HVAC / electrical / plumbing capex.
Questions for the listing agent
- What do current leases actually rent for vs. the listed asking? Can we see a recent rent roll and the last 12 months of T-12 income?
- Built in 1900 — when were the roof, HVAC, electrical panel, plumbing, and water heater last replaced?
- Is there a deadline driving the sale (1031 exchange, divorce, estate, relocation)? That informs how much negotiation room exists.
- The area grade is low — what's the realistic commute time and amenity access for the typical tenant pool here? Any planned neighborhood developments (good or bad) we should know about?
- What's the average days-on-market for RENTAL listings here right now (not sales)? A rising rental-DOM trend means longer vacancies and softer asking-rent achievability than the comps imply.
- What's the recent tenant-quality profile in this submarket — average credit score on applications, eviction rate, late-payment / NSF rate, and stable-employment percentage? A property-management company in the area should have these aggregated.
- How much new for-sale + rental construction is in the pipeline within 1–3 miles? Heavy new supply typically softens prices + rents 12–24 months out; constrained supply supports both.
Investment metrics
- 1% rule
- 0.65% ✗
- Cap rate
- 4.86%
- Cash-on-cash
- -5.12%
- DSCR
- 0.77
- GRM
- 12.8
CMA / ARV
No comps found within radius.
Projected returns pro-forma
10.0% appreciation · 3.0% rent growth · sell at horizon
- IRR
- 20.6%
- Equity multiple
- 2.67×
- Total profit
- $117,028
- Equity at exit
- $225,130
- IRR
- 18.8%
- Equity multiple
- 6.14×
- Total profit
- $359,452
- Equity at exit
- $485,501
Cash invested: $69,972 (down + closing). Projections, not guarantees.
Landlord ↔ Tenant lean methodology
- Overall (STATE)
- 46 Balanced
- State Minnesota
- 46 Balanced · D+2
- County
- — inherits STATE
- City
- — inherits STATE
ZIP-level market 55946
- Home prices YoY
- 11.0%
- Active inventory
- 36
- Price-to-rent
- 12.8×
Monthly cashflow live
- Estimated rent
- $1,627 medium interval (Pro) →
- Mortgage (P&I)
- −$1,311
- Tax from tax record
- −$169 /mo · $2,032/yr
- Insurance
- −$104
- HOA
- −$0
- Vacancy / Maint / Mgmt
- −$342
- Net cashflow
- $-298
Break-even live
Sensitivity live
| Price | -10% $-157 | -5% $-228 | +0% $-298 | +5% $-369 | +10% $-440 |
|---|---|---|---|---|---|
| Rent | -10% $-427 | -5% $-363 | +0% $-298 | +5% $-234 | +10% $-170 |
| Rate | -1.0pp $-173 | -0.5pp $-235 | base $-298 | +0.5pp $-363 | +1.0pp $-429 |
UW: 25.0% down · 7.5% · 30yr · 1.5% tax · 5.0% vac · 8.0% maint · 8.0% mgmt
Financing live
Cash to close
- Down payment
- $62,475
- Closing costs
- $7,497
- Reserves months
- —
- Total cash needed
- —
Loan-product check · same deal, 3 products live
Conventional
25% down · 7.5% · 30yr
- Down + closing
- —
- Monthly P&I
- —
- Monthly cashflow
- —
- DSCR
- —
- Eligible?
- —
Personal DTI + credit; lowest rate.
DSCR
20% down · 8.5% · 30yr
- Down + closing
- —
- Monthly P&I
- —
- Monthly cashflow
- —
- DSCR
- —
- Eligible?
- —
No personal income docs; deal must DSCR.
Hard money
10% down · 12.0% · 12mo
- Down + closing
- —
- Monthly P&I
- —
- Monthly cashflow
- —
- DSCR
- —
- Eligible?
- —
Short-term bridge; refi at stabilization.
Listing history 7 events
-
2026-06-03status $249,900 Pending 19 DOM
-
2026-06-02days on market $249,900 Active 19 DOM
-
2026-06-01days on market $249,900 Active 18 DOM
-
2026-05-31days on market $249,900 Active 17 DOM
-
2026-05-30days on market $249,900 Active 16 DOM
-
2026-05-14$249,900 Active 935-char remark
-
2026-05-09historical $249,900 935-char remark
ⓘ Source: listings_history table (triggers on properties + properties_extension) + one-shot
backfill from property_details.listing_events for pre-trigger history.
Tax reassessment forecast MN · Partial reset (capped growth)
- Current annual tax
- $2,032 · $169/mo
- Projected year-2 tax
- $2,415 · $201/mo
- Expected delta
- +$383/yr (+$32/mo · 18.9%)
ⓘ Screening estimate from a state-policy table — verify with the county assessor before closing.
Climate risk First Street
- Flood 1/10 Low FEMA zone X (unshaded) · 0% chance over 30 yrs
- Wildfire 1/10 Low
- Heat 2/10 Low 7 d/yr ≥100°F today · 15 d/yr by 30 yrs out
- Wind 2/10 Low
- Air quality 2/10 Low 1 unhealthy d/yr today · 1 by 30 yrs out
Nearby sold comps map
Loading sold comps map…
Walkable amenities ~0.75 mi
Loading nearby amenities…
Taxation est. · year 1
- Rental income
- $19,526
- − Mortgage interest
- −$13,998
- − Property taxes
- −$2,032
- − Insurance
- −$1,250
- − Repairs & maintenance
- −$1,562
- − Management
- −$1,562
- − Depreciation
- −$7,270
- Taxable loss
- −$8,148
- Est. tax savings @ 24.0%
- +$1,955
- After-tax cash flow
- $-1,626/yr
For passive investors: Depreciation is non-cash, so a rental often shows a tax loss while cash-flowing — sheltering income. Rental losses are passive: they offset passive income freely, and up to $25,000/yr can offset ordinary (W-2) income if you actively participate and your MAGI is under $100k (phasing out to $0 by $150k); unused losses carry forward. On sale, claimed depreciation is recaptured at up to 25%, and gains may owe capital-gains tax (a 1031 exchange can defer both). Figures are a year-1 estimate at your 24.0% rate — not tax advice; consult a CPA.
Schools (NCES district)
- District
- Kenyon-Wanamingo School District
- NCES district ID
- 2717100
- Math proficiency
- 34% ▼ -11.00%
- Reading proficiency
- 41% ▼ -13.00%
- Median HH income
- $58,681
- Composite
- 33.23/100
- National rank
- #5522
- State rank
- #230 of 301 in MN
Livability — Kenyon
- Score
- 76/100
- State rank
- #172
- US rank
- #3700
Category grades
Schools grade is shown separately in the Schools card above.
Census & demographics
- Census place
- Kenyon, MN
- Population (ZIP)
- 3,366
Population outlook (Goodhue County) Hauer SSP2
- Today (2025)
- 46,532 people
- By 2030
- 46,185 · -0.7%
- By 2040
- 44,531 · -4.3%
- By 2050
- 41,532 · -10.7%
- By 2075
- 33,745 · -27.5%
- By 2100
- 23,716 · -49.0%
Race, ethnicity, and origin ACS 2023
- Neighborhood character
- Predominantly White (91%)
- Race & ethnicity
- White 91% Hispanic / Latino 7% Two or more races 6%
- Hispanic origin (detail)
- Mexican 6%
- Common ancestry
- Portuguese 29% Lithuanian 3% Scottish 2%
- Foreign-born
- 1% · Canada
- Languages at home
- 95% English-only · Spanish 5%
Political lean MEDSL · Goodhue
- 2024 margin
- R (+16.4) · D 40.8% · R 57.3% · Other 1.9%
- 2008→2024 swing
- -15.1pp toward R · 2008: -1.4pp · 2024: -16.4pp
- All cycles
- 2024: R+16.4 2020: R+14.8 2016: R+18.0 2012: R+3.0 2008: R+1.4
Not yet ingested
- Civics
- —
Market trends
- HPI YoY
- ▲ 32.91%
- Current HPI
- 331.1421
- Rent YoY
- —
- Metro
- —
- State GDP YoY
- ▲ 2.41%
- F500 in state
- 34
Industry mix (Fortune 500 HQ in MN)
| Industry | F500 HQs | Revenue |
|---|---|---|
| Healthcare | 2 | $407B |
|
||
| Retail | 2 | $150B |
|
||
| Consumer Goods | 2 | $32B |
|
||
| Industrial Machinery | 2 | $6B |
|
||
| Agriculture | 1 | $40B |
|
||
| Healthcare / Medical Devices | 1 | $32B |
|
||
Price history
+0.0% since first listed3 events — show timeline
- 2026-06-02 Pending — NORTHSTARMLS as Distributed by MLS Grid
- 2026-05-14 Listed $249,900 NORTHSTARMLS as Distributed by MLS Grid
- 2026-05-09 Coming Soon $249,900 NORTHSTARMLS as Distributed by MLS Grid
Property tax history
+7.6%/yrLatest (2025): $2,032 · +0.6% YoY. Source: county tax records.
Cash-flow waterfall
monthlySold comps — $/sqft
last 12 mo · ≤1 miLoading sold comps…