 Fourplex
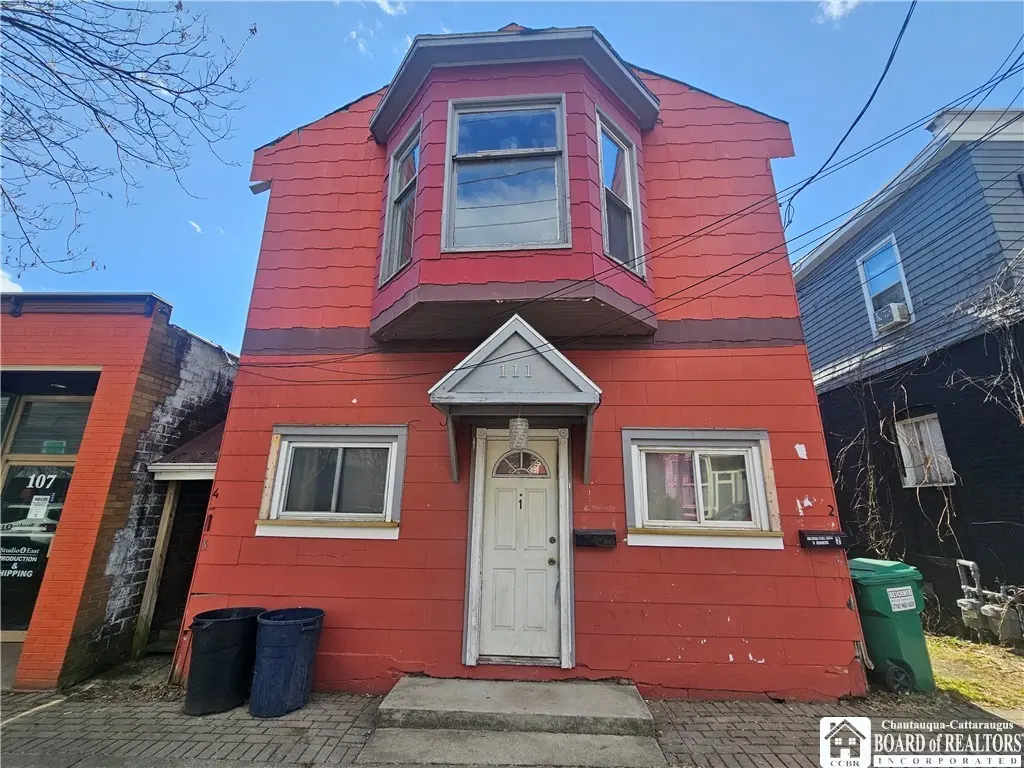
111 W Main St · Allegany, NY
Flood risk 1/10 · Minimal
- FEMA flood zone
- X
- Chance of flooding over 30 yrs
- 0.0%
- Est. flood insurance / yr
- $473 – $860
Fire risk 1/10 · Minimal
- Est. fire insurance / yr
- $691 – $1,283
Heat risk 2/10 · Minimal
- Hot days now (above 90°F)
- 8 days/yr
- Hot days in 30 yrs
- 18 days/yr
Wind risk 1/10 · Minimal
- Chance of severe wind over 30 yrs
- —
Air-quality risk 1/10 · Minimal
- Unhealthy air days now
- 0 days/yr
- Unhealthy air days in 30 yrs
- 0 days/yr
Risk factors via First Street. Map © Google.
Why this score? — see what drove the A- grade
The composite is a weighted blend of 9 inputs, each scored 0–100. Each bar is that input's sub-score; the figure is the points it added to the 100-point composite (weight × sub-score).
- Cash flow +30.0/30.0
- 1% rule +10.0/10.0
- DSCR +10.0/10.0
- Appreciation +10.0/10.0
- ARV discount +7.5/15.0
- Schools +5.2/10.0
- Livability +3.6/5.0
- Rent growth +2.5/5.0
- Condition / age +2.5/5.0
$132,900
🖨 Deal sheet (PDF) 📄 Offer letter ✓ Due diligence
Multi-family units
County records classify this as Multi-Family (5+ Unit). Listing-text estimate: 4 units. estimate disagrees with records
5+ unit building — per-unit beds/baths from public records are typically unavailable; the breakdown below (if shown) is an estimate from the listing text.
Listing remarks MLS
Excellent investment opportunity in the heart of Allegany, NY, just minutes from St. Bonaventure University! This well-located 4-unit property offers strong rental potential, ideal for student housing or long-term tenants. Each unit provides functional living space with separate entrances, making it attractive for a variety of rental strategies. Situated in a high-demand rental area, this property benefits from consistent occupancy driven by proximity to the university, local amenities, and downtown Allegany. Whether you're looking to expand your portfolio or start investing, this property offers great income potential with upside through improved rents or updates. Don’t miss your chance to own a multi-unit in a prime location!
Key facts
- Consistent occupancy
- Separate entrances
- 2,875 sq ft lot
Tags
Neighborhood map
What this means for you Summary
Snapshot
- This is a 4 × 7-bed/4.0-bath units multifamily listed at $133k.
Deal economics
- At list price, monthly cash flow is $2k ($29k/yr) — positive. Per door: $599/mo.
- The deal already cash-flows at list — no discount required.
- Meets the 1% rule at list price ($4k rent vs $133k).
- Recommended offer: $125k (6.0% below list) — sets the bar for market timing.
Location & tenants
- Location reads 71/100 on livability (#395 in NY) — a middle-class / working-renter tenant base. Strengths: cost of living A+, housing A+, crime A; Watch: health & safety C-, amenities F, commute F.
- Allegany-Limestone Central School District (rural): math 55% / reading 67% proficiency, ranked #233 of 590 in NY (top 40%) — acceptable for families but not a draw, mixed tenant base, ~2y average lease.
- Market conditions: 47 active listings in the ZIP; 128 units permitted in Cattaraugus County in 2024 (21 in 5+ unit buildings).
Forward outlook
- In year one you build about $14k of equity ($919 loan paydown + $13k appreciation (10.0% local appreciation)).
- Cattaraugus County population projected at -28% by 2050 — secular population decline; favor cash flow + early exit over multi-decade hold.
- At projected returns (10.0% appreciation + 3.0% rent growth), your $37k cash investment doubles in ~1 year — after that, you're playing with house money.
- By year 3, paydown + projected appreciation supports a ~$36k cash-out refi (75% LTV) — recoverable capital for the next deal without selling this one.
Negotiation context
- It's been on market 87 days — a 6% lower offer ($125k) is reasonable based on typical stale-listing flexibility.
- 2 sale attempts since 10y ago with the ask held roughly flat each time — persistent listings suggest the price (not the market) is what's stuck; bring a comps-based counter.
- Current owner paid $80k; list at $133k implies a 66% gain — meaningful room to come down on a strong offer.
Risks & watch-outs
- Watch-outs: built in 1950 — expect roof / HVAC / electrical / plumbing capex.
Questions for the listing agent
- It's been on market 87 days. Have you received any prior offers? Is the seller open to a 6% concession, seller financing, or rate buy-down credit?
- Can we see the unit-by-unit rent roll, current vacancy, and any below-market leases? What's the average tenancy length?
- What capital expenditures (roof, boiler, parking lot, exteriors) have been made in the last 5 years, and what's planned in the next 2?
- Built in 1950 — when were the roof, HVAC, electrical panel, plumbing, and water heater last replaced?
- Why hasn't it sold? Are there any deal-killer items the seller is aware of (foundation, flood, title, zoning, code violations)?
- Is there a deadline driving the sale (1031 exchange, divorce, estate, relocation)? That informs how much negotiation room exists.
- Schools are B-rated — typically a magnet for longer-tenancy family renters. What's the average tenant stay here, and is there a school-zone premium baked into asking?
- What's the average days-on-market for RENTAL listings here right now (not sales)? A rising rental-DOM trend means longer vacancies and softer asking-rent achievability than the comps imply.
- What's the recent tenant-quality profile in this submarket — average credit score on applications, eviction rate, late-payment / NSF rate, and stable-employment percentage? A property-management company in the area should have these aggregated.
- How much new apartment / multifamily construction is in the pipeline within 1–3 miles? Heavy new supply (>2% of stock underway) typically softens rents 12–24 months out; light construction supports rent growth.
Investment metrics
- 1% rule
- 3.20% ✓
- Cap rate
- 27.91%
- Cash-on-cash
- 77.22%
- DSCR
- 4.44
- GRM
- 2.6
CMA / ARV
- ARV (median comp)
- $60,000
- List price
- $132,900
- Delta
- 121.50%
- Verdict
- OVERPRICED
- Comps
- 1 within 2.0 mi
Projected returns pro-forma
10.0% appreciation · 3.0% rent growth · sell at horizon
- IRR
- 87.5%
- Equity multiple
- 7.05×
- Total profit
- $224,980
- Equity at exit
- $119,727
- IRR
- 82.1%
- Equity multiple
- 15.59×
- Total profit
- $542,784
- Equity at exit
- $258,195
Cash invested: $37,212 (down + closing). Projections, not guarantees.
Landlord ↔ Tenant lean methodology
- Overall (STATE)
- 15 Strongly Tenant-Friendly
- State New York
- 15 Strongly Tenant-Friendly · D+10
- County
- — inherits STATE
- City
- — inherits STATE
ZIP-level market 14706
- Home prices YoY
- 10.5%
- Active inventory
- 47
- Price-to-rent
- 10.4×
Monthly cashflow live
- Estimated rent
- $4,253 medium interval (Pro) →
- Mortgage (P&I)
- −$697
- Tax from tax record
- −$213 /mo · $2,557/yr
- Insurance
- −$55
- HOA
- −$0
- Vacancy / Maint / Mgmt
- −$893
- Net cashflow
- $2,394
Break-even live
Sensitivity live
| Price | -10% $2,470 | -5% $2,432 | +0% $2,394 | +5% $2,357 | +10% $2,319 |
|---|---|---|---|---|---|
| Rent | -10% $2,058 | -5% $2,226 | +0% $2,394 | +5% $2,562 | +10% $2,730 |
| Rate | -1.0pp $2,461 | -0.5pp $2,428 | base $2,394 | +0.5pp $2,360 | +1.0pp $2,325 |
4-unit breakdown (identical units grouped — click to expand)
| Units | Beds | Baths | Est. rent |
|---|---|---|---|
| 4× units | 7 | 4 | $4,252 |
| #1 | 7 | 4 | $1,063 |
| #2 | 7 | 4 | $1,063 |
| #3 | 7 | 4 | $1,063 |
| #4 | 7 | 4 | $1,063 |
| Total (4 units) | $4,253 | ||
UW: 25.0% down · 7.5% · 30yr · 1.5% tax · 5.0% vac · 8.0% maint · 8.0% mgmt
Financing live
Cash to close
- Down payment
- $33,225
- Closing costs
- $3,987
- Reserves months
- —
- Total cash needed
- —
Loan-product check · same deal, 3 products live
Conventional
25% down · 7.5% · 30yr
- Down + closing
- —
- Monthly P&I
- —
- Monthly cashflow
- —
- DSCR
- —
- Eligible?
- —
Personal DTI + credit; lowest rate.
DSCR
20% down · 8.5% · 30yr
- Down + closing
- —
- Monthly P&I
- —
- Monthly cashflow
- —
- DSCR
- —
- Eligible?
- —
No personal income docs; deal must DSCR.
Hard money
10% down · 12.0% · 12mo
- Down + closing
- —
- Monthly P&I
- —
- Monthly cashflow
- —
- DSCR
- —
- Eligible?
- —
Short-term bridge; refi at stabilization.
Listing history 23 events
-
2026-06-18status $132,900 Pending 87 DOM
-
2026-06-18days on market $132,900 Active 87 DOM
-
2026-06-17days on market $132,900 Active 86 DOM
-
2026-06-16days on market $132,900 Active 85 DOM
-
2026-06-15days on market $132,900 Active 84 DOM
-
2026-06-13days on market $132,900 Active 82 DOM
-
2026-06-12days on market $132,900 Active 81 DOM
-
2026-06-09days on market $132,900 Active 78 DOM
-
2026-06-08days on market $132,900 Active 77 DOM
-
2026-06-07days on market $132,900 Active 76 DOM
-
2026-06-07days on market $132,900 Active 75 DOM
-
2026-06-04days on market $132,900 Active 72 DOM
-
2026-06-02days on market $132,900 Active 71 DOM
-
2026-06-01days on market $132,900 Active 70 DOM
-
2026-05-31days on market $132,900 Active 69 DOM
-
2026-03-23$132,900 Active 743-char remark
Show marketing remark (743 chars)
Excellent investment opportunity in the heart of Allegany, NY, just minutes from St. Bonaventure University! This well-located 4-unit property offers strong rental potential, ideal for student housing or long-term tenants. Each unit provides functional living space with separate entrances, making it attractive for a variety of rental strategies. Situated in a high-demand rental area, this property benefits from consistent occupancy driven by proximity to the university, local amenities, and downtown Allegany. Whether you're looking to expand your portfolio or start investing, this property offers great income potential with upside through improved rents or updates. Don’t miss your chance to own a multi-unit in a prime location!
-
2023-07-24soldstatus $80,000
-
2017-03-24soldstatus $66,667
-
2016-10-25historical
-
2016-09-07price $84,900
-
2016-07-08$89,900 Active
-
2013-12-24soldstatus $49,000
-
2000-09-19soldstatus $38,000
ⓘ Source: listings_history table (triggers on properties + properties_extension) + one-shot
backfill from property_details.listing_events for pre-trigger history.
Tax reassessment forecast NY · Partial reset (capped growth)
- Current annual tax
- $2,557 · $213/mo
- Projected year-2 tax
- $2,557 · $213/mo
- Expected delta
- $0/yr ($0/mo · 0.0%)
ⓘ Screening estimate from a state-policy table — verify with the county assessor before closing.
Climate risk First Street
- Flood 1/10 Low FEMA zone X · 0% chance over 30 yrs
- Wildfire 1/10 Low
- Heat 2/10 Low 8 d/yr ≥90°F today · 18 d/yr by 30 yrs out
- Wind 1/10 Low
- Air quality 1/10 Low 0 unhealthy d/yr today · 0 by 30 yrs out
Nearby sold comps map
Loading sold comps map…
Walkable amenities ~0.75 mi
Loading nearby amenities…
Taxation est. · year 1
- Rental income
- $51,036
- − Mortgage interest
- −$7,444
- − Property taxes
- −$2,557
- − Insurance
- −$664
- − Repairs & maintenance
- −$4,083
- − Management
- −$4,083
- − Depreciation
- −$3,866
- Taxable income
- $28,338
- Est. tax owed @ 24.0%
- −$6,801
- After-tax cash flow
- $21,933/yr
For passive investors: Depreciation is non-cash, so a rental often shows a tax loss while cash-flowing — sheltering income. Rental losses are passive: they offset passive income freely, and up to $25,000/yr can offset ordinary (W-2) income if you actively participate and your MAGI is under $100k (phasing out to $0 by $150k); unused losses carry forward. On sale, claimed depreciation is recaptured at up to 25%, and gains may owe capital-gains tax (a 1031 exchange can defer both). Figures are a year-1 estimate at your 24.0% rate — not tax advice; consult a CPA.
Schools (NCES district)
- District
- Allegany-Limestone Central School District
- NCES district ID
- 3600015
- Math proficiency
- 55% ▼ -5.00%
- Reading proficiency
- 67% ▲ 17.00%
- Median HH income
- $47,850
- Composite
- 51.66/100
- National rank
- #1696
- State rank
- #233 of 590 in NY
Livability — Allegany
- Score
- 71/100
- State rank
- #395
- US rank
- #6843
Category grades
Schools grade is shown separately in the Schools card above.
Census & demographics
- Census place
- Allegany, NY
- Population (ZIP)
- 6,118
Population outlook (Cattaraugus County) Hauer SSP2
- Today (2025)
- 71,623 people
- By 2030
- 67,751 · -5.4%
- By 2040
- 59,488 · -16.9%
- By 2050
- 51,601 · -28.0%
- By 2075
- 35,025 · -51.1%
- By 2100
- 21,243 · -70.3%
Race, ethnicity, and origin ACS 2023
- Neighborhood character
- Predominantly White (88%)
- Race & ethnicity
- White 88% Two or more races 5% Black 3% Native American 2% Asian 2%
- Common ancestry
- Romanian 7% Slovak 3% Lithuanian 2%
- Foreign-born
- 2% · Canada
- Languages at home
- 98% English-only · Other Indo-European 1%
Political lean MEDSL · Cattaraugus
- 2024 margin
- Solid R (+32.8) · D 33.6% · R 66.4%
- 2008→2024 swing
- -22.2pp toward R · 2008: -10.6pp · 2024: -32.8pp
- All cycles
- 2024: R+32.8 2020: R+29.5 2016: R+34.4 2012: R+13.4 2008: R+10.6
Not yet ingested
- Civics
- —
Market trends
- HPI YoY
- ▲ 24.72%
- Current HPI
- 259.9141
- Rent YoY
- —
- Metro
- —
- State GDP YoY
- ▲ 2.60%
- F500 in state
- 92
Industry mix (Fortune 500 HQ in NY)
| Industry | F500 HQs | Revenue |
|---|---|---|
| Financial Services | 10 | $950B |
|
||
| Consumer Goods | 9 | $162B |
|
||
| Insurance | 4 | $225B |
|
||
| Telecommunications | 2 | $144B |
|
||
| Pharmaceuticals | 2 | $112B |
|
||
| Media / Entertainment | 2 | $69B |
|
||
Price history
+249.7% since first listed8 events — show timeline
- 2026-03-23 Listed $132,900 UNYREIS
- 2023-07-24 Sold (Public Records) $80,000 Public Records
- 2017-03-24 Sold (Public Records) $66,667 Public Records
- 2016-10-25 Listing Removed — WNYREIS
- 2016-09-07 Price Changed $84,900 WNYREIS
- 2016-07-08 Listed $89,900 WNYREIS
- 2013-12-24 Sold (Public Records) $49,000 Public Records
- 2000-09-19 Sold (Public Records) $38,000 Public Records
Property tax history
-0.7%/yrLatest (2025): $2,557 · +0.4% YoY. Source: county tax records.
Cash-flow waterfall
monthlySold comps — $/sqft
last 12 mo · ≤1 miLoading sold comps…