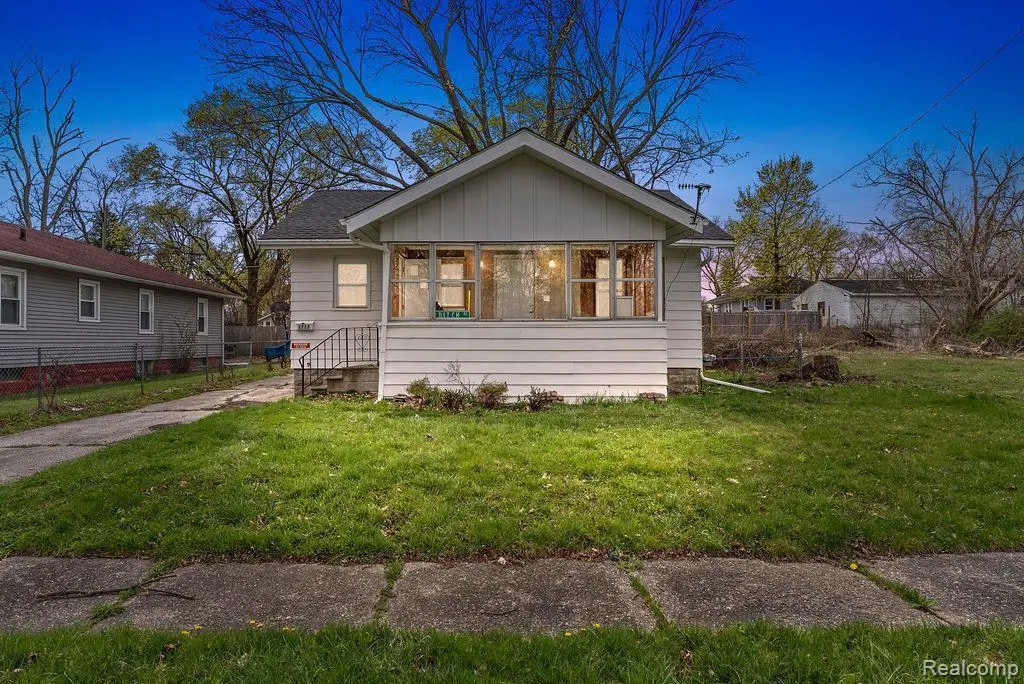
1717 Wolcott St · Flint, MI
Flood risk 6/10 · Moderate
- FEMA flood zone
- X (unshaded)
- Chance of flooding over 30 yrs
- 0.74%
- Est. flood insurance / yr
- $473 – $860
Fire risk 1/10 · Minimal
- Est. fire insurance / yr
- $784 – $1,456
Heat risk 2/10 · Minimal
- Hot days now (above 97°F)
- 7 days/yr
- Hot days in 30 yrs
- 15 days/yr
Wind risk 2/10 · Minimal
- Chance of severe wind over 30 yrs
- —
Air-quality risk 3/10 · Minor
- Unhealthy air days now
- 3 days/yr
- Unhealthy air days in 30 yrs
- 4 days/yr
Risk factors via First Street. Map © Google.
Why this score? — see what drove the B- grade
The composite is a weighted blend of 9 inputs, each scored 0–100. Each bar is that input's sub-score; the figure is the points it added to the 100-point composite (weight × sub-score).
- Cash flow +30.0/30.0
- DSCR +10.0/10.0
- 1% rule +8.4/10.0
- ARV discount +7.5/15.0
- Livability +3.7/5.0
- Rent growth +2.5/5.0
- Condition / age +2.5/5.0
- Schools +1.1/10.0
- Appreciation +0.0/10.0
$71,000
🖨 Deal sheet (PDF) 📄 Offer letter ✓ Due diligence
Listing remarks MLS
FREE tacos for the buyer at closing! Welcome to this beautifully updated 2-bed, 1 bath bungalow, ideally situated in a quiet neighborhood near Kettering University. This inviting home features an enclosed porch, a detached garage, and two vacant lots on the west side of the home that are included in the sale and can be easily combined. Recent updates completed in 2024 include a new roof (installed late 2024), fresh carpet and flooring, stylish kitchen cabinets & countertops, modern tub surround, and fresh interior paint on walls & ceilings. Whether you're looking to expand your investment portfolio or settle into your new home, this property is a fantastic opportunity. Call today to schedule a showing and see the charm for yourself!
Key facts
- Two vacant lots
- Enclosed porch
- Fresh carpet
Tags
Property features AI
Exterior
- Parking: Detached 1-car garage
- Utilities: Public water; Public sewer
- Home design: Single family residence; One level; Ground-level entry with steps
- Construction: Aluminum siding; Block foundation
- Exterior features: Paved road access; Lot approximately 50 x 100 (0.11 acre); Subdivision: MODERN HOUSING CORPORATION ADD NO 5; Cross streets near Flushing Rd and Dupont St
Interior
- Kitchen: Free‑standing electric oven; Free‑standing refrigerator; Dishwasher
- Bedrooms: Total of 3 rooms (includes all living spaces)
- Bathrooms: 1 full bathroom
- Heating & cooling: Forced air heating; Natural gas heating; No central cooling
- Interior features: Electric water heater; Full unfinished basement
- Laundry & utility: Washer; Dryer
Neighborhood map
What this means for you Summary
Snapshot
- This is a 2-bed/1.5-bath single-family listed at $71k.
Deal economics
- At list price, monthly cash flow is $272 ($3k/yr) — positive.
- The deal already cash-flows at list — no discount required.
- Meets the 1% rule at list price ($952 rent vs $71k).
- Recommended offer: $67k (6.0% below list) — sets the bar for market timing.
Location & tenants
- Location reads 74/100 on livability (#196 in MI, #4,946 nationally) — a middle-class / working-renter tenant base. Strengths: commute A+, cost of living A+, housing A+; Watch: crime F, employment F.
- Flint School District (urban): math 7% / reading 13% proficiency, ranked #714 of 760 in MI (top 94%) — low school quality limits family demand, transient renter base, plan for 1-2y turnover; 83% free/reduced lunch — lower-income household profile, screen leases tightly.
- Zoned schools: Holmes Stem Middle School Academy (math 10% / reading 30%, grade F, #420 of 493 statewide, top 86%, 324 students, 90% FRL).
- Market conditions: 132 active listings in the ZIP; 3 comparable units currently listed for rent nearby; 419 units permitted in Genesee County in 2024 (68 in 5+ unit buildings).
Forward outlook
- Local home prices are declining (-3.0%/yr); year-one equity from $491 of loan paydown is wiped out by about $2k of value loss. Plan a longer hold.
- Genesee County population projected at -27% by 2050 — secular population decline; favor cash flow + early exit over multi-decade hold.
- At projected returns (-3.0% appreciation + 3.0% rent growth), your $20k cash investment doubles in ~8 years — after that, you're playing with house money.
Negotiation context
- It's been on market 65 days — a 6% lower offer ($67k) is reasonable based on typical stale-listing flexibility.
- 17 sale attempts since 25y ago with the ask held roughly flat each time — persistent listings suggest the price (not the market) is what's stuck; bring a comps-based counter.
- Current owner paid $49k; 45% above their basis — modest negotiation headroom, anchor on the comps not their cost.
Risks & watch-outs
- Watch-outs: built in 1926 — expect roof / HVAC / electrical / plumbing capex.
- Climate carrying-cost: major flood risk — expect insurance premiums to compound above CPI over the hold.
Questions for the listing agent
- It's been on market 65 days. Have you received any prior offers? Is the seller open to a 6% concession, seller financing, or rate buy-down credit?
- Built in 1926 — when were the roof, HVAC, electrical panel, plumbing, and water heater last replaced?
- Why hasn't it sold? Are there any deal-killer items the seller is aware of (foundation, flood, title, zoning, code violations)?
- Is there a deadline driving the sale (1031 exchange, divorce, estate, relocation)? That informs how much negotiation room exists.
- Schools are F-rated, which usually means shorter tenancies and higher turnover. Who's the typical renter profile here, and what's been the actual vacancy rate?
- Crime grade is F in this area — have there been break-ins, vandalism, or insurance claims at this property in the last 3 years? What carrier currently insures it and at what premium?
- What's the average days-on-market for RENTAL listings here right now (not sales)? A rising rental-DOM trend means longer vacancies and softer asking-rent achievability than the comps imply.
- What's the recent tenant-quality profile in this submarket — average credit score on applications, eviction rate, late-payment / NSF rate, and stable-employment percentage? A property-management company in the area should have these aggregated.
- How much new for-sale + rental construction is in the pipeline within 1–3 miles? Heavy new supply typically softens prices + rents 12–24 months out; constrained supply supports both.
Investment metrics
- 1% rule
- 1.34% ✓
- Cap rate
- 10.89%
- Cash-on-cash
- 16.42%
- DSCR
- 1.73
- GRM
- 6.2
CMA / ARV
- ARV (on-the-fly)
- $34,944
- Comps found
- 12
Show comp detail 12 sales within ~0.75 mi
| Address | Dist | Beds/Ba | Sqft | Sold | Price | $/sf | Match |
|---|---|---|---|---|---|---|---|
| 1813 Stevenson St | 0.07mi | 2/1.0 | 672 (0%) | 6mo | $34,900 | $52 | 90 |
| 1901 Berkley St | 0.10mi | 2/1.0 | 720 (+7%) | 8mo | $30,500 | $42 | 75 |
| 2209 Raskob St | 0.24mi | 2/1.0 | 720 (+7%) | 5mo | $21,000 | $29 | 70 |
| 2515 Bagley St | 0.54mi | 2/1.0 | 672 (0%) | 9mo | $25,000 | $37 | 65 |
| 1802 Mackin Rd | 0.15mi | 2/1.0 | 768 (+14%) | 6mo | $8,000 | $10 | 63 |
| 2020 Cartier St | 0.64mi | 2/1.0 | 689 (+2%) | 12mo | $31,000 | $45 | 54 |
| 2425 Clement St | 0.51mi | 2/1.0 | 731 (+9%) | 7mo | $7,600 | $10 | 54 |
| 2513 Tiffin St | 0.56mi | 2/1.0 | 768 (+14%) | 0mo | $65,000 | $85 | 48 |
| 2531 Paducah St | 0.62mi | 2/1.0 | 720 (+7%) | 14mo | $61,250 | $85 | 46 |
| 616 Saint Clair Ave | 0.74mi | 2/1.0 | 720 (+7%) | 10mo | $57,500 | $80 | 44 |
| 2540 Altoona St | 0.72mi | 2/1.0 | 768 (+14%) | 3mo | $50,000 | $65 | 38 |
| 2556 Altoona St | 0.75mi | 2/1.0 | 768 (+14%) | 8mo | $60,000 | $78 | 33 |
Match score weights: distance 35% · size 25% · config 20% · recency 20%. Top-matched comps best support the ARV.
Projected returns pro-forma
-3.0% appreciation · 3.0% rent growth · sell at horizon
- IRR
- 7.5%
- Equity multiple
- 1.29×
- Total profit
- $5,826
- Equity at exit
- $10,586
- IRR
- 16.8%
- Equity multiple
- 2.38×
- Total profit
- $27,413
- Equity at exit
- $6,139
Cash invested: $19,880 (down + closing). Projections, not guarantees.
Landlord ↔ Tenant lean methodology
- Overall (STATE)
- 62 Landlord-Friendly
- State Michigan
- 62 Landlord-Friendly · EVEN
- County
- — inherits STATE
- City
- — inherits STATE
ZIP-level market 48504
- Active inventory
- 132
- Price-to-rent
- 6.2×
Monthly cashflow live
- Estimated rent
- $952 medium interval (Pro) →
- Mortgage (P&I)
- −$372
- Tax from tax record
- −$78 /mo · $941/yr
- Insurance
- −$30
- HOA
- −$0
- Vacancy / Maint / Mgmt
- −$200
- Net cashflow
- $272
Break-even live
Sensitivity live
| Price | -10% $312 | -5% $292 | +0% $272 | +5% $252 | +10% $232 |
|---|---|---|---|---|---|
| Rent | -10% $197 | -5% $234 | +0% $272 | +5% $310 | +10% $347 |
| Rate | -1.0pp $308 | -0.5pp $290 | base $272 | +0.5pp $254 | +1.0pp $235 |
UW: 25.0% down · 7.5% · 30yr · 1.5% tax · 5.0% vac · 8.0% maint · 8.0% mgmt
Financing live
Cash to close
- Down payment
- $17,750
- Closing costs
- $2,130
- Reserves months
- —
- Total cash needed
- —
Loan-product check · same deal, 3 products live
Conventional
25% down · 7.5% · 30yr
- Down + closing
- —
- Monthly P&I
- —
- Monthly cashflow
- —
- DSCR
- —
- Eligible?
- —
Personal DTI + credit; lowest rate.
DSCR
20% down · 8.5% · 30yr
- Down + closing
- —
- Monthly P&I
- —
- Monthly cashflow
- —
- DSCR
- —
- Eligible?
- —
No personal income docs; deal must DSCR.
Hard money
10% down · 12.0% · 12mo
- Down + closing
- —
- Monthly P&I
- —
- Monthly cashflow
- —
- DSCR
- —
- Eligible?
- —
Short-term bridge; refi at stabilization.
Rent comps 3 comps
| Address | Beds | Baths | Sqft | Rent | $/sqft | DOM | Units | Dist |
|---|---|---|---|---|---|---|---|---|
| 352 Bradley Ave Unit 343 Sheffield Ave-Apt C Flint, MI | 1.0 | 1.0 | 564 | $900 | $1.60 | 22d | 1 | 0.96mi |
| 343 Sheffield Apt. C Ave heuristic Flint, MI | 1.0 | 1.0 | 564 | $900 | $1.60 | 26d | 1 | 0.97mi |
| 607 E 2nd Ave Unit 803 Flint, MI | 1.0 | 1.0 | 606 | $1,025 | $1.69 | 15d | 1 | 1.03mi |
Listing history 50 events
-
2026-06-21days on market $71,000 Active 65 DOM
-
2026-06-18days on market $71,000 Active 62 DOM
-
2026-06-17days on market $71,000 Active 61 DOM
-
2026-06-16days on market $71,000 Active 60 DOM
-
2026-06-15days on market $71,000 Active 59 DOM
-
2026-06-14days on market $71,000 Active 57 DOM
-
2026-06-13days on market $71,000 Active 56 DOM
-
2026-06-10days on market $71,000 Active 54 DOM
-
2026-06-09days on market $71,000 Active 53 DOM
-
2026-06-08days on market $71,000 Active 52 DOM
-
2026-06-07days on market $71,000 Active 51 DOM
-
2026-06-05days on market $71,000 Active 48 DOM
-
2026-06-03days on market $71,000 Active 47 DOM
-
2026-06-02days on market $71,000 Active 46 DOM
-
2026-06-01days on market $71,000 Active 45 DOM
-
2026-05-31days on market $71,000 Active 44 DOM
-
2026-05-30days on market $71,000 Active 43 DOM
-
2026-05-05status Active
-
2026-05-04historical
-
2026-04-17$71,000 Active
Show marketing remark (754 chars)
FREE tacos for the buyer at closing! Welcome to this beautifully updated 2-bed, 1 bath bungalow, ideally situated in a quiet neighborhood near Kettering University. This inviting home features an enclosed porch, a detached garage, and two vacant lots on the west side of the home that are included in the sale and can be easily combined. Recent updates completed in 2024 include a new roof (installed late 2024), fresh carpet and flooring, stylish kitchen cabinets & countertops, modern tub surround, and fresh interior paint on walls & ceilings. Whether you're looking to expand your investment portfolio or settle into your new home, this property is a fantastic opportunity. Call today to schedule a showing and see the charm for yourself!
-
2026-04-17$71,000 Active 754-char remark
Show marketing remark (754 chars)
FREE tacos for the buyer at closing! Welcome to this beautifully updated 2-bed, 1 bath bungalow, ideally situated in a quiet neighborhood near Kettering University. This inviting home features an enclosed porch, a detached garage, and two vacant lots on the west side of the home that are included in the sale and can be easily combined. Recent updates completed in 2024 include a new roof (installed late 2024), fresh carpet and flooring, stylish kitchen cabinets & countertops, modern tub surround, and fresh interior paint on walls & ceilings. Whether you're looking to expand your investment portfolio or settle into your new home, this property is a fantastic opportunity. Call today to schedule a showing and see the charm for yourself!
-
2026-04-11historical
-
2026-04-11historical
-
2025-12-06price $71,000
-
2025-12-06price $71,000
-
2025-10-27price $72,000
-
2025-10-26price $72,000
-
2025-09-11price $73,000
-
2025-09-11price $73,000
-
2025-09-09historical
-
2025-09-09historical
-
2025-07-22price $74,000
-
2025-07-22price $74,000
-
2025-05-31price $74,500
-
2025-05-31price $74,500
-
2025-04-23$74,000 Active
-
2025-04-23$74,000 Active
-
2025-04-23$75,000 Active
-
2025-04-23$75,000 Active
-
2024-08-09soldstatus $49,000
-
2024-08-07soldstatus $49,000 Sold
-
2024-08-07soldstatus $49,000 Closed
-
2024-08-01status Pending
-
2024-08-01status Pending
-
2024-07-30status Active
-
2024-07-30status Back on Market
-
2024-06-11status Pending
-
2024-06-11status Pending
-
2024-05-31price $49,900
-
2024-05-31price $49,900
ⓘ Source: listings_history table (triggers on properties + properties_extension) + one-shot
backfill from property_details.listing_events for pre-trigger history.
Tax reassessment forecast MI · Partial reset (capped growth)
- Current annual tax
- $941 · $78/mo
- Projected year-2 tax
- $1,017 · $85/mo
- Expected delta
- +$76/yr (+$6/mo · 8.1%)
ⓘ Screening estimate from a state-policy table — verify with the county assessor before closing.
Climate risk First Street
- Flood 6/10 Major FEMA zone X (unshaded) · 74% chance over 30 yrs
- Wildfire 1/10 Low
- Heat 2/10 Low 7 d/yr ≥97°F today · 15 d/yr by 30 yrs out
- Wind 2/10 Low
- Air quality 3/10 Moderate 3 unhealthy d/yr today · 4 by 30 yrs out
Nearby sold comps map
Loading sold comps map…
Walkable amenities ~0.75 mi
Loading nearby amenities…
Taxation est. · year 1
- Rental income
- $11,428
- − Mortgage interest
- −$3,977
- − Property taxes
- −$941
- − Insurance
- −$355
- − Repairs & maintenance
- −$914
- − Management
- −$914
- − Depreciation
- −$2,065
- Taxable income
- $2,261
- Est. tax owed @ 24.0%
- −$543
- After-tax cash flow
- $2,721/yr
For passive investors: Depreciation is non-cash, so a rental often shows a tax loss while cash-flowing — sheltering income. Rental losses are passive: they offset passive income freely, and up to $25,000/yr can offset ordinary (W-2) income if you actively participate and your MAGI is under $100k (phasing out to $0 by $150k); unused losses carry forward. On sale, claimed depreciation is recaptured at up to 25%, and gains may owe capital-gains tax (a 1031 exchange can defer both). Figures are a year-1 estimate at your 24.0% rate — not tax advice; consult a CPA.
Schools (NCES district)
- District
- Flint School District
- NCES district ID
- 2614520
- Math proficiency
- 7% ▬ 0.00%
- Reading proficiency
- 13% ▲ 3.00%
- Median HH income
- $25,954
- Composite
- 10.97/100
- National rank
- #14642
- State rank
- #714 of 760 in MI
Livability — Flint
- Score
- 74/100
- State rank
- #196
- US rank
- #4946
Category grades
Schools grade is shown separately in the Schools card above.
Census & demographics
- Census place
- Flint, MI
- City population
- 93,814
- Population (ZIP)
- 23,873
Population outlook (Genesee County) Hauer SSP2
- Today (2025)
- 381,312 people
- By 2030
- 362,731 · -4.9%
- By 2040
- 321,550 · -15.7%
- By 2050
- 279,212 · -26.8%
- By 2075
- 193,336 · -49.3%
- By 2100
- 128,118 · -66.4%
Race, ethnicity, and origin ACS 2023
- Neighborhood character
- Predominantly Black (66%)
- Race & ethnicity
- Black 66% White 24% Two or more races 6% Hispanic / Latino 5% Asian 1%
- Common ancestry
- Romanian 2% Lithuanian 1% Italian 1%
- Foreign-born
- 3% · Canada, China
- Languages at home
- 96% English-only · Spanish 2%
Political lean MEDSL · Genesee
- 2024 margin
- Toss-up / Even · D 51.4% · R 47.2% · Other 1.4%
- 2008→2024 swing
- -28.3pp toward R · 2008: 32.5pp · 2024: 4.2pp
- All cycles
- 2024: D+4.2 2020: D+9.3 2016: D+9.5 2012: D+28.2 2008: D+32.5
Not yet ingested
- Civics
- —
Market trends
- HPI YoY
- ▼ -101.67%
- Current HPI
- 94.3111
- Rent YoY
- —
- Metro
- —
- State GDP YoY
- ▲ 1.37%
- F500 in state
- 28
Industry mix (Fortune 500 HQ in MI)
| Industry | F500 HQs | Revenue |
|---|---|---|
| Automotive Parts | 3 | $48B |
|
||
| Automotive | 2 | $372B |
|
||
| Chemicals | 1 | $45B |
|
||
| Automotive Retail | 1 | $29B |
|
||
| Healthcare / Medical Devices | 1 | $23B |
|
||
| Automotive Technology | 1 | $20B |
|
||
Price history
+69.5% since first listed51 events — show timeline
- 2026-05-05 Relisted — REALCOMP
- 2026-05-04 Listing Removed — REALCOMP
- 2026-04-17 Listed $71,000 MiRealSource-MiMLS
- 2026-04-17 Listed $71,000 REALCOMP
- 2026-04-11 Listing Removed — MiRealSource-MiMLS
- 2026-04-11 Listing Removed — REALCOMP
- 2025-12-06 Price Changed $71,000 MiRealSource-MiMLS
- 2025-12-06 Price Changed $71,000 REALCOMP
- 2025-10-27 Price Changed $72,000 MiRealSource-MiMLS
- 2025-10-26 Price Changed $72,000 REALCOMP
- 2025-09-11 Price Changed $73,000 MiRealSource-MiMLS
- 2025-09-11 Price Changed $73,000 REALCOMP
- 2025-09-09 Listing Removed — MiRealSource-MiMLS
- 2025-09-09 Listing Removed — REALCOMP
- 2025-07-22 Price Changed $74,000 MiRealSource-MiMLS
- 2025-07-22 Price Changed $74,000 REALCOMP
- 2025-05-31 Price Changed $74,500 MiRealSource-MiMLS
- 2025-05-31 Price Changed $74,500 REALCOMP
- 2025-04-23 Listed $75,000 MiRealSource-MiMLS
- 2025-04-23 Listed $75,000 REALCOMP
- 2025-04-23 Listed $74,000 MiRealSource-MiMLS
- 2025-04-23 Listed $74,000 REALCOMP
- 2024-08-09 Sold (Public Records) $49,000 Public Records
- 2024-08-07 Sold (MLS) $49,000 MiRealSource-MiMLS
- 2024-08-07 Sold (MLS) $49,000 REALCOMP
- 2024-08-01 Pending — REALCOMP
- 2024-08-01 Pending — MiRealSource-MiMLS
- 2024-07-30 Relisted — REALCOMP
- 2024-07-30 Relisted — MiRealSource-MiMLS
- 2024-06-11 Pending — REALCOMP
- 2024-06-11 Pending — MiRealSource-MiMLS
- 2024-05-31 Price Changed $49,900 MiRealSource-MiMLS
- 2024-05-31 Price Changed $49,900 REALCOMP
- 2024-05-23 Listed $54,900 MiRealSource-MiMLS
- 2024-05-23 Listed $54,900 REALCOMP
- 2022-05-06 Sold (MLS) $22,000 MiRealSource-MiMLS
- 2022-05-06 Sold (MLS) $22,000 REALCOMP
- 2022-04-24 Pending — MiRealSource-MiMLS
- 2022-04-24 Pending — REALCOMP
- 2022-04-15 Listed $25,000 MiRealSource-MiMLS
- 2022-04-15 Listed $25,000 REALCOMP
- 2014-10-06 Sold (MLS) $2,160 MiRealSource-MiMLS
- 2014-10-06 Sold (MLS) $2,160 REALCOMP
- 2014-09-19 Listing Removed — MiRealSource-MiMLS
- 2014-09-13 Listed $3,000 MiRealSource-MiMLS
- 2014-09-13 Listed $3,000 REALCOMP
- 2002-02-01 Sold (MLS) $38,000 REALCOMP
- 2002-02-01 Sold (MLS) $38,000 MiRealSource-MiMLS
- 2002-01-01 Listing Removed — MiRealSource-MiMLS
- 2001-10-19 Listed $41,900 REALCOMP
- 2001-10-19 Listed $41,900 MiRealSource-MiMLS
Property tax history
+3.2%/yrLatest (2025): $941 · +6.9% YoY. Source: county tax records.
Cash-flow waterfall
monthlySold comps — $/sqft
last 12 mo · ≤1 miLoading sold comps…