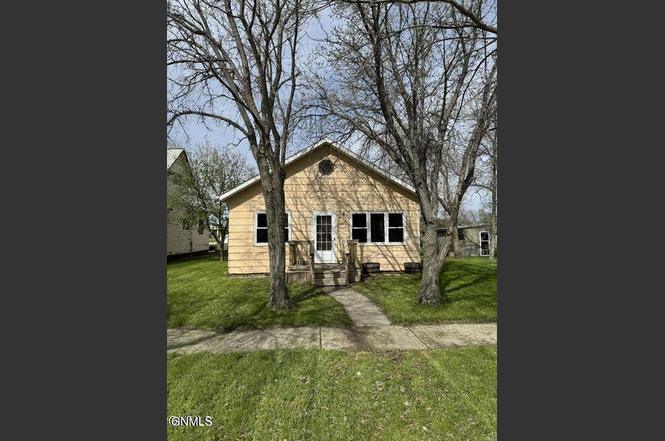
403 2nd St NE · Crosby, ND
Flood risk 1/10 · Minimal
- FEMA flood zone
- —
- Chance of flooding over 30 yrs
- 0.0%
- Est. flood insurance / yr
- —
Fire risk 3/10 · Minor
- Est. fire insurance / yr
- $1,289 – $2,393
Heat risk 1/10 · Minimal
- Hot days now (above 94°F)
- 7 days/yr
- Hot days in 30 yrs
- 13 days/yr
Wind risk 1/10 · Minimal
- Chance of severe wind over 30 yrs
- —
Air-quality risk 5/10 · Moderate
- Unhealthy air days now
- 8 days/yr
- Unhealthy air days in 30 yrs
- 8 days/yr
Risk factors via First Street. Map © Google.
Why this score? — see what drove the C- grade
The composite is a weighted blend of 9 inputs, each scored 0–100. Each bar is that input's sub-score; the figure is the points it added to the 100-point composite (weight × sub-score).
- Cash flow +16.4/30.0
- ARV discount +7.5/15.0
- DSCR +5.1/10.0
- Appreciation +5.0/10.0
- 1% rule +4.5/10.0
- Livability +3.6/5.0
- Schools +3.4/10.0
- Rent growth +2.5/5.0
- Condition / age +2.5/5.0
$118,000
🖨 Deal sheet (PDF) 📄 Offer letter ✓ Due diligence
Key facts
- Open floor plan
- Fresh paint
- New flooring
Tags
Property features AI
Exterior
- Parking: 2-car garage
- Utilities: Public water; Public sewer
- Home design: Single family residence; Residential property
- Construction: Built with other/unspecified construction materials; Crawl space foundation
- Exterior features: No notable exterior features listed
Interior
- Kitchen: Microwave; Range; Refrigerator
- Bathrooms: 1 full bathroom
- Heating & cooling: Electric heating; Propane heating; No central cooling
- Interior features: Microwave; Range; Refrigerator
- Laundry & utility: Washer; Dryer
Neighborhood map
What this means for you Summary
Snapshot
- This is a 2-bed/1.0-bath other listed at $118k.
Deal economics
- At list price, monthly cash flow is $66 ($795/yr) — positive.
- The deal already cash-flows at list — no discount required.
- To meet the 1% rule (rent ≥ 1% of price), the offer needs to be $112k (5.4% below list).
- Recommended offer: $107k (9.0% below list) — sets the bar for market timing.
Location & tenants
- Location reads 71/100 on livability (#63 in ND) — a middle-class / working-renter tenant base. Strengths: crime A+, cost of living A+, housing A+; Watch: health & safety D, amenities F, commute F.
- Divide County 1 (rural): math 30% / reading 43% proficiency, ranked #121 of 169 in ND (top 72%) — families likely to look elsewhere, expect single-tenant / working-renter base with shorter leases.
- Zoned schools: Divide County Elementary School (math 42% / reading 37%, grade F, #137 of 236 statewide, top 63%, 222 students, 26% FRL); Divide County High School (math 22% / reading 47%, grade F, #77 of 144 statewide, top 57%, 161 students, 22% FRL) — zoned schools at 24% FRL track the district average.
- Market conditions: 19 active listings in the ZIP.
Forward outlook
- In year one you build about $4k of equity ($816 loan paydown + $4k appreciation (3.0% local appreciation)).
- Divide County population projected at +85% by 2050 — long-run rental-demand tailwind backs the buy-and-hold thesis.
- At projected returns (3.0% appreciation + 3.0% rent growth), your $33k cash investment doubles in ~6 years — after that, you're playing with house money.
- By year 8, paydown + projected appreciation supports a ~$32k cash-out refi (75% LTV) — recoverable capital for the next deal without selling this one.
Negotiation context
- It's been on market 109 days — a 9% lower offer ($107k) is reasonable based on typical stale-listing flexibility.
Risks & watch-outs
- Watch-outs: built in 1940 — expect roof / HVAC / electrical / plumbing capex.
Questions for the listing agent
- It's been on market 109 days. Have you received any prior offers? Is the seller open to a 9% concession, seller financing, or rate buy-down credit?
- Built in 1940 — when were the roof, HVAC, electrical panel, plumbing, and water heater last replaced?
- Why hasn't it sold? Are there any deal-killer items the seller is aware of (foundation, flood, title, zoning, code violations)?
- Is there a deadline driving the sale (1031 exchange, divorce, estate, relocation)? That informs how much negotiation room exists.
- Schools are D-rated, which usually means shorter tenancies and higher turnover. Who's the typical renter profile here, and what's been the actual vacancy rate?
- What's the average days-on-market for RENTAL listings here right now (not sales)? A rising rental-DOM trend means longer vacancies and softer asking-rent achievability than the comps imply.
- What's the recent tenant-quality profile in this submarket — average credit score on applications, eviction rate, late-payment / NSF rate, and stable-employment percentage? A property-management company in the area should have these aggregated.
- How much new for-sale + rental construction is in the pipeline within 1–3 miles? Heavy new supply typically softens prices + rents 12–24 months out; constrained supply supports both.
Investment metrics
- 1% rule
- 0.95% ✗
- Cap rate
- 6.97%
- Cash-on-cash
- 2.41%
- DSCR
- 1.11
- GRM
- 8.8
CMA / ARV
No comps found within radius.
Projected returns pro-forma
3.0% appreciation · 3.0% rent growth · sell at horizon
- IRR
- 9.8%
- Equity multiple
- 1.56×
- Total profit
- $18,452
- Equity at exit
- $53,058
- IRR
- 12.1%
- Equity multiple
- 2.81×
- Total profit
- $59,814
- Equity at exit
- $81,769
Cash invested: $33,040 (down + closing). Projections, not guarantees.
Landlord ↔ Tenant lean methodology
- Overall (STATE)
- 82 Strongly Landlord-Friendly
- State North Dakota
- 82 Strongly Landlord-Friendly · R+20
- County
- — inherits STATE
- City
- — inherits STATE
ZIP-level market 58730
- Active inventory
- 19
- Price-to-rent
- 8.8×
Monthly cashflow live
- Estimated rent
- $1,116 medium interval (Pro) →
- Mortgage (P&I)
- −$619
- Tax est. 1.5%
- −$148 /mo · $1,770/yr
- Insurance
- −$49
- HOA
- −$0
- Vacancy / Maint / Mgmt
- −$234
- Net cashflow
- $66
Break-even live
Sensitivity live
| Price | -10% $148 | -5% $107 | +0% $66 | +5% $25 | +10% $-15 |
|---|---|---|---|---|---|
| Rent | -10% $-22 | -5% $22 | +0% $66 | +5% $110 | +10% $154 |
| Rate | -1.0pp $126 | -0.5pp $96 | base $66 | +0.5pp $36 | +1.0pp $5 |
UW: 25.0% down · 7.5% · 30yr · 1.5% tax · 5.0% vac · 8.0% maint · 8.0% mgmt
Financing live
Cash to close
- Down payment
- $29,500
- Closing costs
- $3,540
- Reserves months
- —
- Total cash needed
- —
Loan-product check · same deal, 3 products live
Conventional
25% down · 7.5% · 30yr
- Down + closing
- —
- Monthly P&I
- —
- Monthly cashflow
- —
- DSCR
- —
- Eligible?
- —
Personal DTI + credit; lowest rate.
DSCR
20% down · 8.5% · 30yr
- Down + closing
- —
- Monthly P&I
- —
- Monthly cashflow
- —
- DSCR
- —
- Eligible?
- —
No personal income docs; deal must DSCR.
Hard money
10% down · 12.0% · 12mo
- Down + closing
- —
- Monthly P&I
- —
- Monthly cashflow
- —
- DSCR
- —
- Eligible?
- —
Short-term bridge; refi at stabilization.
Listing history 18 events
-
2026-06-21days on market $118,000 Active 109 DOM
-
2026-06-21days on market $118,000 Active 108 DOM
-
2026-06-18days on market $118,000 Active 106 DOM
-
2026-06-17days on market $118,000 Active 105 DOM
-
2026-06-16days on market $118,000 Active 104 DOM
-
2026-06-15days on market $118,000 Active 103 DOM
-
2026-06-13days on market $118,000 Active 101 DOM
-
2026-06-12days on market $118,000 Active 100 DOM
-
2026-06-09days on market $118,000 Active 97 DOM
-
2026-06-08days on market $118,000 Active 96 DOM
-
2026-06-07days on market $118,000 Active 95 DOM
-
2026-06-05days on market $118,000 Active 93 DOM
-
2026-06-04days on market $118,000 Active 91 DOM
-
2026-06-02days on market $118,000 Active 90 DOM
-
2026-06-01days on market $118,000 Active 89 DOM
-
2026-05-31days on market $118,000 Active 88 DOM
-
2026-03-04$118,000 Active
-
2025-06-26price $118,000
ⓘ Source: listings_history table (triggers on properties + properties_extension) + one-shot
backfill from property_details.listing_events for pre-trigger history.
Climate risk First Street
- Flood 1/10 Low 0% chance over 30 yrs
- Wildfire 3/10 Moderate
- Heat 1/10 Low 7 d/yr ≥94°F today · 13 d/yr by 30 yrs out
- Wind 1/10 Low
- Air quality 5/10 Major 8 unhealthy d/yr today · 8 by 30 yrs out
Nearby sold comps map
Loading sold comps map…
Walkable amenities ~0.75 mi
Loading nearby amenities…
Taxation est. · year 1
- Rental income
- $13,393
- − Mortgage interest
- −$6,610
- − Property taxes
- −$1,770
- − Insurance
- −$590
- − Repairs & maintenance
- −$1,071
- − Management
- −$1,071
- − Depreciation
- −$3,433
- Taxable loss
- −$1,152
- Est. tax savings @ 24.0%
- +$276
- After-tax cash flow
- $1,072/yr
For passive investors: Depreciation is non-cash, so a rental often shows a tax loss while cash-flowing — sheltering income. Rental losses are passive: they offset passive income freely, and up to $25,000/yr can offset ordinary (W-2) income if you actively participate and your MAGI is under $100k (phasing out to $0 by $150k); unused losses carry forward. On sale, claimed depreciation is recaptured at up to 25%, and gains may owe capital-gains tax (a 1031 exchange can defer both). Figures are a year-1 estimate at your 24.0% rate — not tax advice; consult a CPA.
Schools (NCES district)
- District
- Divide County 1
- NCES district ID
- 3805160
- Math proficiency
- 30% ▼ -4.00%
- Reading proficiency
- 43% ▼ -4.00%
- Median HH income
- $52,720
- Composite
- 34.4/100
- National rank
- #10182
- State rank
- #121 of 169 in ND
Livability — Crosby
- Score
- 71/100
- State rank
- #63
- US rank
- #7199
Category grades
Schools grade is shown separately in the Schools card above.
Census & demographics
- Census place
- Crosby, ND
- Population (ZIP)
- 1,369
Population outlook (Divide County) Hauer SSP2
- Today (2025)
- 3,235 people
- By 2030
- 3,697 · +14.3%
- By 2040
- 4,763 · +47.2%
- By 2050
- 5,975 · +84.7%
- By 2075
- 9,534 · +194.7%
- By 2100
- 12,784 · +295.2%
Race, ethnicity, and origin ACS 2023
- Neighborhood character
- Predominantly White (81%)
- Race & ethnicity
- White 81% Hispanic / Latino 9% Two or more races 7% Black 5%
- Hispanic origin (detail)
- Mexican 6%
- Common ancestry
- Portuguese 36% Slovak 6% Scotch-Irish 2%
- Foreign-born
- 0%
Political lean MEDSL · Divide
- 2024 margin
- Solid R (+55.4) · D 21.2% · R 76.5% · Other 2.3%
- 2008→2024 swing
- -40.7pp toward R · 2008: -14.7pp · 2024: -55.4pp
- All cycles
- 2024: R+55.4 2020: R+53.2 2016: R+52.0 2012: R+30.3 2008: R+14.7
Not yet ingested
- Civics
- —
Market trends
- HPI YoY
- —
- Current HPI
- —
- Rent YoY
- —
- Metro
- —
- State GDP YoY
- ▲ 2.09%
- F500 in state
- 2
Industry mix (Fortune 500 HQ in ND)
| Industry | F500 HQs | Revenue |
|---|---|---|
| Utilities / Construction | 1 | $6B |
|
||
Price history
+0.0% since first listed2 events — show timeline
- 2026-03-04 Listed $118,000 GNMLS
- 2025-06-26 Price Changed $118,000 GNMLS
Property tax history
-7.7%/yrLatest (2024): $184 · -72.2% YoY. Source: county tax records.
Cash-flow waterfall
monthlySold comps — $/sqft
last 12 mo · ≤1 miLoading sold comps…