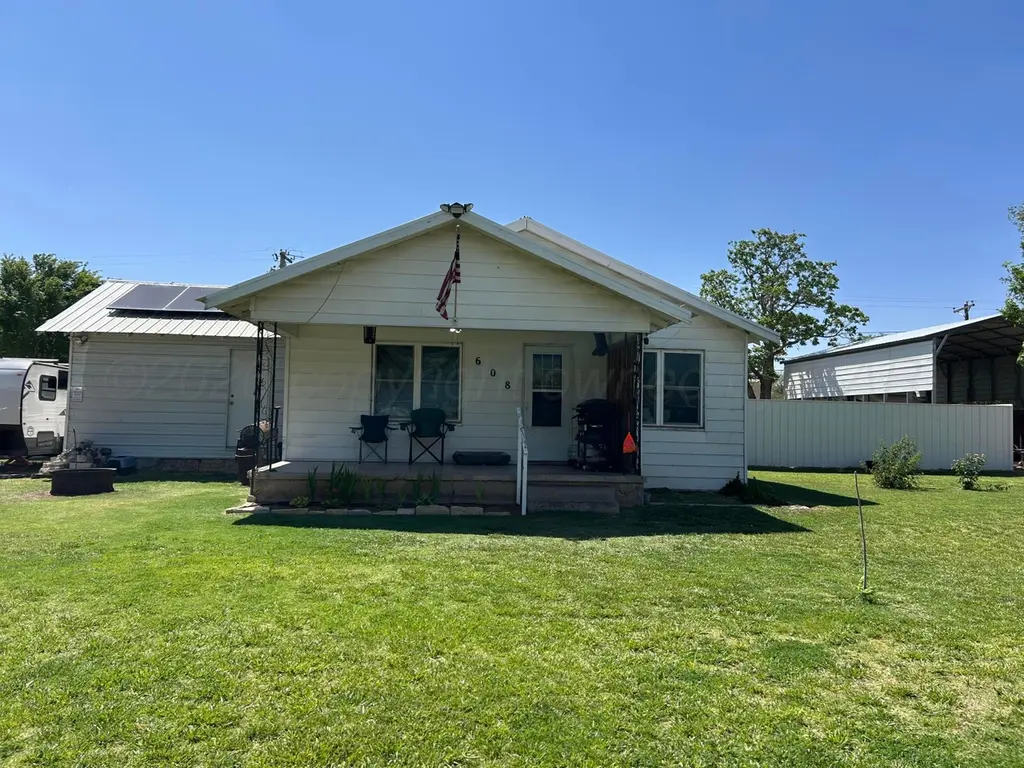
608 Richardson Ave · Gruver, TX
Flood risk 1/10 · Minimal
- FEMA flood zone
- —
- Chance of flooding over 30 yrs
- 0.0%
- Est. flood insurance / yr
- —
Fire risk 8/10 · Major
- Est. fire insurance / yr
- $1,222 – $2,270
Heat risk 5/10 · Moderate
- Hot days now (above 100°F)
- 7 days/yr
- Hot days in 30 yrs
- 19 days/yr
Wind risk 2/10 · Minimal
- Chance of severe wind over 30 yrs
- —
Air-quality risk 2/10 · Minimal
- Unhealthy air days now
- 1 days/yr
- Unhealthy air days in 30 yrs
- 1 days/yr
Risk factors via First Street. Map © Google.
Why this score? — see what drove the D grade
The composite is a weighted blend of 9 inputs, each scored 0–100. Each bar is that input's sub-score; the figure is the points it added to the 100-point composite (weight × sub-score).
- Appreciation +8.0/10.0
- Cash flow +7.6/30.0
- ARV discount +7.5/15.0
- Schools +6.2/10.0
- Livability +3.2/5.0
- Rent growth +2.5/5.0
- Condition / age +2.5/5.0
- 1% rule +2.3/10.0
- DSCR +1.7/10.0
$160,000
🖨 Deal sheet (PDF) 📄 Offer letter ✓ Due diligence
Listing remarks
Don't miss out on this updated 3 bedroom with plus room (currently used for storage), 2 recently remodeled bathrooms. Per owner many updates have been completed, kitchen, laundry room, wiring throughout the house, plumbing, new HVAC and ducts installed in 2022 and metal roof in 2019. There are still some items that will be done before closing, such as interior painting, trims and exterior trim around windows. New windows were installed in 2024. Did I mention the large lot, big back yard and metal fence. Call to schedule a showing.
Key facts
- Metal roof
- New hvac
- Big back yard
Tags
Property features AI
Exterior
- Parking: Additional parking
- Utilities: Public water; Public sewer
- Home design: Single-family residence; One story; East-facing
- Construction: Frame construction; Metal roof; Pillar/post/pier foundation; Built as residential single family
- Exterior features: Dog run; Outdoor storage
Interior
- Kitchen: Range; Dishwasher; Microwave
- Bathrooms: 1 full bathroom; 1 three-quarter bathroom
- Heating & cooling: Central heating; Central air conditioning
- Interior features: Ceiling fans; Range, Dishwasher, Microwave
Neighborhood map
What this means for you Summary
Snapshot
- This is a 3-bed/2.0-bath single-family listed at $160k.
Deal economics
- At list price, monthly cash flow is $-189 ($-2k/yr) — negative.
- To cash-flow at today's rent, offer at most $127k (20.9% below list).
- To meet the 1% rule (rent ≥ 1% of price), the offer needs to be $116k (27.4% below list).
- Recommended offer: $116k (27.4% below list) — sets the bar for 1% rule.
Location & tenants
- Location reads 65/100 on livability (#723 in TX) — a middle-class / working-renter tenant base. Strengths: cost of living A+, housing A+, crime A; Watch: amenities F, commute F, employment F.
- Gruver ISD (rural): math 83% / reading 64% proficiency, ranked #10 of 826 in TX (top 1%) — strong family-tenant draw, lease renewals of 3-5y typical.
- Zoned schools: Gruver El (math 64% / reading 54%, grade B-, #409 of 4,322 statewide, top 10%, 159 students, 55% FRL); Gruver J H (math 87% / reading 62%, grade A, #35 of 1,662 statewide, top 2%, 129 students, 42% FRL); Gruver H S (math 84% / reading 74%, grade A-, #40 of 1,632 statewide, top 3%, 153 students, 40% FRL).
- Market conditions: 5 active listings in the ZIP.
Forward outlook
- In year one you build about $11k of equity ($1k loan paydown + $10k appreciation (6.0% local appreciation)).
- Hansford County population projected at +4% by 2050 — modest demand growth; plan on rents tracking national, not racing it.
- By year 4, paydown + projected appreciation supports a ~$36k cash-out refi (75% LTV) — recoverable capital for the next deal without selling this one.
Negotiation context
- It's been on market 34 days — a 3% lower offer ($155k) is reasonable based on typical stale-listing flexibility.
Risks & watch-outs
- Watch-outs: built in 1957 — expect roof / HVAC / electrical / plumbing capex.
- Climate carrying-cost: severe wildfire risk; extreme-heat days projected 7→19/yr by 2055 (HVAC capex compounding) — expect insurance premiums to compound above CPI over the hold.
Questions for the listing agent
- What do current leases actually rent for vs. the listed asking? Can we see a recent rent roll and the last 12 months of T-12 income?
- It's been on market 34 days. Have you received any prior offers? Is the seller open to a 27% concession, seller financing, or rate buy-down credit?
- Built in 1957 — when were the roof, HVAC, electrical panel, plumbing, and water heater last replaced?
- Is there a deadline driving the sale (1031 exchange, divorce, estate, relocation)? That informs how much negotiation room exists.
- The area grade is low — what's the realistic commute time and amenity access for the typical tenant pool here? Any planned neighborhood developments (good or bad) we should know about?
- What's the average days-on-market for RENTAL listings here right now (not sales)? A rising rental-DOM trend means longer vacancies and softer asking-rent achievability than the comps imply.
- What's the recent tenant-quality profile in this submarket — average credit score on applications, eviction rate, late-payment / NSF rate, and stable-employment percentage? A property-management company in the area should have these aggregated.
- How much new for-sale + rental construction is in the pipeline within 1–3 miles? Heavy new supply typically softens prices + rents 12–24 months out; constrained supply supports both.
Investment metrics
- 1% rule
- 0.73% ✗
- Cap rate
- 4.87%
- Cash-on-cash
- -5.07%
- DSCR
- 0.77
- GRM
- 11.5
CMA / ARV
No comps found within radius.
Projected returns pro-forma
5.96% appreciation · 3.0% rent growth · sell at horizon
- IRR
- 11.2%
- Equity multiple
- 1.75×
- Total profit
- $33,815
- Equity at exit
- $100,210
- IRR
- 12.2%
- Equity multiple
- 3.43×
- Total profit
- $109,025
- Equity at exit
- $181,405
Cash invested: $44,800 (down + closing). Projections, not guarantees.
Landlord ↔ Tenant lean methodology
- Overall (STATE)
- 87 Strongly Landlord-Friendly
- State Texas
- 87 Strongly Landlord-Friendly · R+5
- County
- — inherits STATE
- City
- — inherits STATE
ZIP-level market 79040
- Home prices YoY
- 5.3%
- Active inventory
- 5
- Price-to-rent
- 11.5×
Monthly cashflow live
- Estimated rent
- $1,162 medium interval (Pro) →
- Mortgage (P&I)
- −$839
- Tax from tax record
- −$201 /mo · $2,415/yr
- Insurance
- −$67
- HOA
- −$0
- Vacancy / Maint / Mgmt
- −$244
- Net cashflow
- $-189
Break-even live
Sensitivity live
| Price | -10% $-99 | -5% $-144 | +0% $-189 | +5% $-234 | +10% $-280 |
|---|---|---|---|---|---|
| Rent | -10% $-281 | -5% $-235 | +0% $-189 | +5% $-143 | +10% $-97 |
| Rate | -1.0pp $-109 | -0.5pp $-148 | base $-189 | +0.5pp $-231 | +1.0pp $-273 |
UW: 25.0% down · 7.5% · 30yr · 1.5% tax · 5.0% vac · 8.0% maint · 8.0% mgmt
Financing live
Cash to close
- Down payment
- $40,000
- Closing costs
- $4,800
- Reserves months
- —
- Total cash needed
- —
Loan-product check · same deal, 3 products live
Conventional
25% down · 7.5% · 30yr
- Down + closing
- —
- Monthly P&I
- —
- Monthly cashflow
- —
- DSCR
- —
- Eligible?
- —
Personal DTI + credit; lowest rate.
DSCR
20% down · 8.5% · 30yr
- Down + closing
- —
- Monthly P&I
- —
- Monthly cashflow
- —
- DSCR
- —
- Eligible?
- —
No personal income docs; deal must DSCR.
Hard money
10% down · 12.0% · 12mo
- Down + closing
- —
- Monthly P&I
- —
- Monthly cashflow
- —
- DSCR
- —
- Eligible?
- —
Short-term bridge; refi at stabilization.
Listing history 19 events
-
2026-06-21days on market $160,000 Active 34 DOM
-
2026-06-21days on market $160,000 Active 33 DOM
-
2026-06-18price $160,000 Active 31 DOM
-
2026-06-18days on market $162,500 Active 31 DOM
-
2026-06-17days on market $162,500 Active 30 DOM
-
2026-06-16days on market $162,500 Active 29 DOM
-
2026-06-15days on market $162,500 Active 28 DOM
-
2026-06-13days on market $162,500 Active 26 DOM
-
2026-06-12days on market $162,500 Active 25 DOM
-
2026-06-09days on market $162,500 Active 22 DOM
-
2026-06-08days on market $162,500 Active 21 DOM
-
2026-06-08pricedays on market $162,500 Active 20 DOM
-
2026-06-05days on market $165,000 Active 18 DOM
-
2026-06-03days on market $165,000 Active 16 DOM
-
2026-06-02days on market $165,000 Active 15 DOM
-
2026-06-01days on market $165,000 Active 14 DOM
-
2026-05-31days on market $165,000 Active 13 DOM
-
2026-05-18$165,000 Active
-
1999-01-19soldstatus
ⓘ Source: listings_history table (triggers on properties + properties_extension) + one-shot
backfill from property_details.listing_events for pre-trigger history.
Tax reassessment forecast TX · Resets to sale price
- Current annual tax
- $2,415 · $201/mo
- Projected year-2 tax
- $2,928 · $244/mo
- Expected delta
- +$513/yr (+$43/mo · 21.3%)
ⓘ Screening estimate from a state-policy table — verify with the county assessor before closing.
Climate risk First Street
- Flood 1/10 Low 0% chance over 30 yrs
- Wildfire 8/10 Severe
- Heat 5/10 Major 7 d/yr ≥100°F today · 19 d/yr by 30 yrs out
- Wind 2/10 Low
- Air quality 2/10 Low 1 unhealthy d/yr today · 1 by 30 yrs out
Nearby sold comps map
Loading sold comps map…
Walkable amenities ~0.75 mi
Loading nearby amenities…
Taxation est. · year 1
- Rental income
- $13,941
- − Mortgage interest
- −$8,962
- − Property taxes
- −$2,415
- − Insurance
- −$800
- − Repairs & maintenance
- −$1,115
- − Management
- −$1,115
- − Depreciation
- −$4,655
- Taxable loss
- −$5,121
- Est. tax savings @ 24.0%
- +$1,229
- After-tax cash flow
- $-1,041/yr
For passive investors: Depreciation is non-cash, so a rental often shows a tax loss while cash-flowing — sheltering income. Rental losses are passive: they offset passive income freely, and up to $25,000/yr can offset ordinary (W-2) income if you actively participate and your MAGI is under $100k (phasing out to $0 by $150k); unused losses carry forward. On sale, claimed depreciation is recaptured at up to 25%, and gains may owe capital-gains tax (a 1031 exchange can defer both). Figures are a year-1 estimate at your 24.0% rate — not tax advice; consult a CPA.
Schools (NCES district)
- District
- Gruver ISD
- NCES district ID
- 4821930
- Math proficiency
- 83% ▲ 6.00%
- Reading proficiency
- 64% ▲ 7.00%
- Median HH income
- $48,687
- Composite
- 62.23/100
- National rank
- #702
- State rank
- #10 of 826 in TX
Livability — Gruver
- Score
- 65/100
- State rank
- #723
- US rank
- #13464
Category grades
Schools grade is shown separately in the Schools card above.
Census & demographics
- Census place
- Gruver, TX
- Population (ZIP)
- 2,076
Population outlook (Hansford County) Hauer SSP2
- Today (2025)
- 5,722 people
- By 2030
- 5,762 · +0.7%
- By 2040
- 5,866 · +2.5%
- By 2050
- 5,931 · +3.7%
- By 2075
- 6,002 · +4.9%
- By 2100
- 5,509 · -3.7%
Race, ethnicity, and origin ACS 2023
- Neighborhood character
- Majority Hispanic (53%)
- Race & ethnicity
- Hispanic / Latino 53% White 42% Two or more races 24% Native American 1%
- Hispanic origin (detail)
- Mexican 52%
- Common ancestry
- Serbian 2% Russian 1% Portuguese 1%
- Foreign-born
- 20% · Canada
- Languages at home
- 53% English-only · Spanish 47%
Political lean MEDSL · Hansford
- 2024 margin
- Solid R (+84.8) · D 7.3% · R 92.2%
- 2008→2024 swing
- -8.4pp toward R · 2008: -76.5pp · 2024: -84.8pp
- All cycles
- 2024: R+84.8 2020: R+82.2 2016: R+80.1 2012: R+83.1 2008: R+76.5
Not yet ingested
- Civics
- —
Market trends
- HPI YoY
- ▲ 5.96%
- Current HPI
- 118.1608
- Rent YoY
- —
- Metro
- —
- State GDP YoY
- ▲ 3.95%
- F500 in state
- 110
Industry mix (Fortune 500 HQ in TX)
| Industry | F500 HQs | Revenue |
|---|---|---|
| Energy | 16 | $1,198B |
|
||
| Technology | 5 | $198B |
|
||
| Engineering / Construction | 4 | $72B |
|
||
| Energy Services | 3 | $60B |
|
||
| Utilities | 3 | $41B |
|
||
| Healthcare | 2 | $330B |
|
||
Price history
2 events — show timeline
- 2026-05-18 Listed $165,000 AARMLS
- 1999-01-19 Sold (Public Records) — Public Records
Property tax history
+9.1%/yrLatest (2025): $2,415 · +47.1% YoY. Source: county tax records.
Cash-flow waterfall
monthlySold comps — $/sqft
last 12 mo · ≤1 miLoading sold comps…