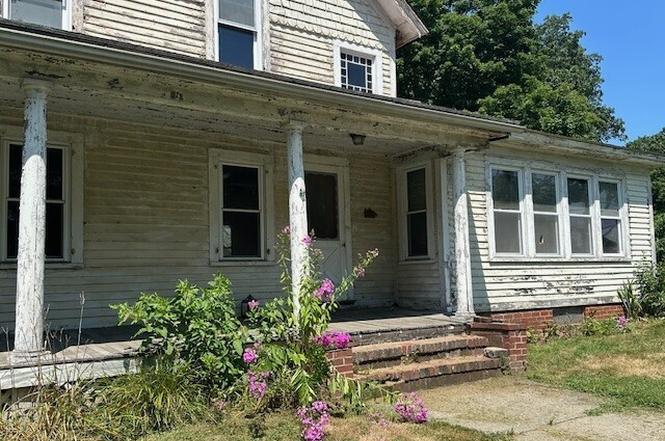
104 Route 2A · Norwich, CT
Flood risk 1/10 · Minimal
- FEMA flood zone
- X (unshaded)
- Chance of flooding over 30 yrs
- 0.0%
- Est. flood insurance / yr
- $473 – $860
Fire risk 3/10 · Minor
- Est. fire insurance / yr
- $829 – $1,539
Heat risk 5/10 · Moderate
- Hot days now (above 96°F)
- 7 days/yr
- Hot days in 30 yrs
- 17 days/yr
Wind risk 6/10 · Moderate
- Chance of severe wind over 30 yrs
- 69.0%
Air-quality risk 3/10 · Minor
- Unhealthy air days now
- 2 days/yr
- Unhealthy air days in 30 yrs
- 3 days/yr
Risk factors via First Street. Map © Google.
Why this score? — see what drove the B- grade
The composite is a weighted blend of 9 inputs, each scored 0–100. Each bar is that input's sub-score; the figure is the points it added to the 100-point composite (weight × sub-score).
- Cash flow +24.6/30.0
- ARV discount +15.0/15.0
- DSCR +8.0/10.0
- 1% rule +6.1/10.0
- Schools +4.1/10.0
- Livability +4.0/5.0
- Rent growth +2.5/5.0
- Condition / age +2.5/5.0
- Appreciation +0.0/10.0
$250,000
🖨 Deal sheet (PDF) 📄 Offer letter ✓ Due diligence
Listing remarks MLS
Older colonial....Outbuilding..Garage.. Nice rear grounds..Wrap-around porch.. Needs "your" talents...
Key facts
- Hardwood flooring
- Eat in kitchen
- French doorways
Tags
Neighborhood map
What this means for you Summary
Snapshot
- This is a 3-bed/1.0-bath single-family listed at $250k.
Deal economics
- At list price, monthly cash flow is $518 ($6k/yr) — positive.
- The deal already cash-flows at list — no discount required.
- Meets the 1% rule at list price ($3k rent vs $250k).
- Recommended offer: $220k (12.0% below list) — sets the bar for market timing.
- Cap rate 8.8% vs local median 4.1% in Norwich — top-decile yield for the area; either an underpriced asset or a hidden risk that comps aren't pricing in. Stress-test before assuming the spread holds.
Location & tenants
- Location reads 81/100 on livability (#18 in CT, #1,391 nationally) — a professional / high-income tenant draw. Strengths: housing A+, health & safety A+, commute A-.
- Preston School District (rural): math 42% / reading 49% proficiency, ranked #88 of 153 in CT (top 58%) — families likely to look elsewhere, expect single-tenant / working-renter base with shorter leases; only 14% free/reduced lunch — higher-income household profile.
- Zoned schools: Preston Veterans' Memorial School (math 47% / reading 57%, grade C-, #213 of 553 statewide, top 41%, 311 students, 21% FRL); Preston Plains School (math 37% / reading 42%, grade F, #107 of 175 statewide, top 61%, 125 students, 30% FRL).
- Market conditions: 23 active listings in the ZIP; 487 units permitted in Southeastern Connecticut Planning Region in 2024 (244 in 5+ unit buildings).
Forward outlook
- Local home prices are declining (-3.0%/yr); year-one equity from $2k of loan paydown is wiped out by about $8k of value loss. Plan a longer hold.
Negotiation context
- It's been on market 178 days — a 12% lower offer ($220k) is reasonable based on typical stale-listing flexibility.
- 5 sale attempts since 28y ago; this cycle's ask has dropped $25k (9%) from the opening price — seller is motivated, your offer sets the floor, not the list.
- Current owner paid $81k; list at $250k implies a 209% gain — meaningful room to come down on a strong offer.
Risks & watch-outs
- Watch-outs: built in 1770 — expect roof / HVAC / electrical / plumbing capex.
- Climate carrying-cost: major wind risk, 69% chance of damaging wind over 30y; extreme-heat days projected 7→17/yr by 2055 (HVAC capex compounding) — expect insurance premiums to compound above CPI over the hold.
Questions for the listing agent
- It's been on market 178 days. Have you received any prior offers? Is the seller open to a 12% concession, seller financing, or rate buy-down credit?
- Built in 1770 — when were the roof, HVAC, electrical panel, plumbing, and water heater last replaced?
- Why hasn't it sold? Are there any deal-killer items the seller is aware of (foundation, flood, title, zoning, code violations)?
- Is there a deadline driving the sale (1031 exchange, divorce, estate, relocation)? That informs how much negotiation room exists.
- Schools are D-rated, which usually means shorter tenancies and higher turnover. Who's the typical renter profile here, and what's been the actual vacancy rate?
- What's the average days-on-market for RENTAL listings here right now (not sales)? A rising rental-DOM trend means longer vacancies and softer asking-rent achievability than the comps imply.
- What's the recent tenant-quality profile in this submarket — average credit score on applications, eviction rate, late-payment / NSF rate, and stable-employment percentage? A property-management company in the area should have these aggregated.
- How much new for-sale + rental construction is in the pipeline within 1–3 miles? Heavy new supply typically softens prices + rents 12–24 months out; constrained supply supports both.
Investment metrics
- 1% rule
- 1.11% ✓
- Cap rate
- 8.78%
- Cash-on-cash
- 8.89%
- DSCR
- 1.40
- GRM
- 7.5
CMA / ARV
- ARV (on-the-fly)
- $375,180
- Comps found
- 11
Show comp detail 11 sales within ~0.75 mi
| Address | Dist | Beds/Ba | Sqft | Sold | Price | $/sf | Match |
|---|---|---|---|---|---|---|---|
| 104 Route 2A | 0.00mi | 3/1.0 | 1,690 (0%) | 0mo | $150,000 | $89 | 100 |
| 13 Shingle Point Rd | 0.15mi | 3/1.5 | 1,658 (-2%) | 21mo | $330,000 | $199 | 70 |
| 6 Route 117 | 0.13mi | 3/1.0 | 1,459 (-14%) | 4mo | $300,000 | $206 | 68 |
| 236 Avery Hill Rd | 0.43mi | 3/2.0 | 1,814 (+7%) | 0mo | $440,000 | $243 | 64 |
| 5 Schoolhouse Rd | 0.16mi | 3/1.5 | 1,464 (-13%) | 7mo | $389,000 | $266 | 63 |
| 6 Arrowhead Dr | 0.27mi | 3/1.0 | 1,488 (-12%) | 7mo | $425,000 | $286 | 62 |
| 9 Sunset Ave | 0.60mi | 3/2.0 | 1,696 (+0%) | 8mo | $415,000 | $245 | 61 |
| 3 Johnnie Ct | 0.55mi | 3/1.0 | 1,616 (-4%) | 8mo | $260,000 | $161 | 61 |
| 11 Willow Ln | 0.67mi | 3/1.5 | 1,620 (-4%) | 3mo | $360,000 | $222 | 58 |
| 7 Halls Mill Rd | 0.63mi | 3/2.5 | 1,826 (+8%) | 1mo | $525,000 | $288 | 50 |
| 5 Royal Oaks Dr | 0.71mi | 3/1.5 | 1,901 (+12%) | 13mo | $395,000 | $208 | 33 |
Match score weights: distance 35% · size 25% · config 20% · recency 20%. Top-matched comps best support the ARV.
Projected returns pro-forma
-3.0% appreciation · 3.0% rent growth · sell at horizon
- IRR
- -2.8%
- Equity multiple
- 0.89×
- Total profit
- $-7,492
- Equity at exit
- $37,276
- IRR
- 6.9%
- Equity multiple
- 1.51×
- Total profit
- $36,001
- Equity at exit
- $21,615
Cash invested: $70,000 (down + closing). Projections, not guarantees.
Landlord ↔ Tenant lean methodology
- Overall (STATE)
- 27 Tenant-Leaning
- State Connecticut
- 27 Tenant-Leaning · D+7
- County
- — inherits STATE
- City
- — inherits STATE
ZIP-level market 06365
- Home prices YoY
- -14.0%
- Active inventory
- 23
- Price-to-rent
- 7.5×
Monthly cashflow live
- Estimated rent
- $2,763 medium interval (Pro) →
- Mortgage (P&I)
- −$1,311
- Tax from tax record
- −$249 /mo · $2,991/yr
- Insurance
- −$104
- HOA
- −$0
- Lot rent
- −$0
- Vacancy / Maint / Mgmt
- −$580
- Net cashflow
- $518
Break-even live
Sensitivity live
| Price | -10% $660 | -5% $589 | +0% $518 | +5% $448 | +10% $377 |
|---|---|---|---|---|---|
| Rent | -10% $300 | -5% $409 | +0% $518 | +5% $628 | +10% $737 |
| Rate | -1.0pp $644 | -0.5pp $582 | base $518 | +0.5pp $454 | +1.0pp $388 |
UW: 25.0% down · 7.5% · 30yr · 1.5% tax · 5.0% vac · 8.0% maint · 8.0% mgmt
Financing live
Cash to close
- Down payment
- $62,500
- Closing costs
- $7,500
- Reserves months
- —
- Total cash needed
- —
Loan-product check · same deal, 3 products live
Conventional
25% down · 7.5% · 30yr
- Down + closing
- —
- Monthly P&I
- —
- Monthly cashflow
- —
- DSCR
- —
- Eligible?
- —
Personal DTI + credit; lowest rate.
DSCR
20% down · 8.5% · 30yr
- Down + closing
- —
- Monthly P&I
- —
- Monthly cashflow
- —
- DSCR
- —
- Eligible?
- —
No personal income docs; deal must DSCR.
Hard money
10% down · 12.0% · 12mo
- Down + closing
- —
- Monthly P&I
- —
- Monthly cashflow
- —
- DSCR
- —
- Eligible?
- —
Short-term bridge; refi at stabilization.
Listing history 11 events
-
2026-04-27status Under Contract
-
2026-04-13status Active
-
2026-03-30historical Under Contract - Continue to Show
-
2025-12-15status Active
-
2025-11-21status Under Contract
-
2025-11-09status Active
-
2025-09-08status Under Contract
-
2025-08-28price $250,000
-
2025-08-06$275,000 Active
-
1999-04-08soldstatus $81,000 112-char remark
Show marketing remark (112 chars)
Older colonial....Outbuilding..Garage.. Nice rear grounds..Wrap-around porch.. Needs "your" talents...
-
1998-09-14$86,500 112-char remark
Show marketing remark (112 chars)
Older colonial....Outbuilding..Garage.. Nice rear grounds..Wrap-around porch.. Needs "your" talents...
ⓘ Source: listings_history table (triggers on properties + properties_extension) + one-shot
backfill from property_details.listing_events for pre-trigger history.
Tax reassessment forecast CT · Partial reset (capped growth)
- Current annual tax
- $2,991 · $249/mo
- Projected year-2 tax
- $4,170 · $348/mo
- Expected delta
- +$1,180/yr (+$98/mo · 39.4%)
ⓘ Screening estimate from a state-policy table — verify with the county assessor before closing.
Climate risk First Street
- Flood 1/10 Low FEMA zone X (unshaded) · 0% chance over 30 yrs
- Wildfire 3/10 Moderate
- Heat 5/10 Major 7 d/yr ≥96°F today · 17 d/yr by 30 yrs out
- Wind 6/10 Major 69% chance of damaging wind over 30 yrs
- Air quality 3/10 Moderate 2 unhealthy d/yr today · 3 by 30 yrs out
Nearby sold comps map
Loading sold comps map…
Walkable amenities ~0.75 mi
Loading nearby amenities…
Taxation est. · year 1
- Rental income
- $33,157
- − Mortgage interest
- −$14,004
- − Property taxes
- −$2,991
- − Insurance
- −$1,250
- − Repairs & maintenance
- −$2,653
- − Management
- −$2,653
- − Depreciation
- −$7,273
- Taxable income
- $2,334
- Est. tax owed @ 24.0%
- −$560
- After-tax cash flow
- $5,660/yr
For passive investors: Depreciation is non-cash, so a rental often shows a tax loss while cash-flowing — sheltering income. Rental losses are passive: they offset passive income freely, and up to $25,000/yr can offset ordinary (W-2) income if you actively participate and your MAGI is under $100k (phasing out to $0 by $150k); unused losses carry forward. On sale, claimed depreciation is recaptured at up to 25%, and gains may owe capital-gains tax (a 1031 exchange can defer both). Figures are a year-1 estimate at your 24.0% rate — not tax advice; consult a CPA.
Schools (NCES district)
- District
- Preston School District
- NCES district ID
- 0903420
- Math proficiency
- 42% ▼ -9.00%
- Reading proficiency
- 49% ▼ -13.00%
- Median HH income
- $71,322
- Composite
- 41.07/100
- National rank
- #3575
- State rank
- #88 of 153 in CT
Livability — Norwich
- Score
- 81/100
- State rank
- #18
- US rank
- #1391
Category grades
Schools grade is shown separately in the Schools card above.
Census & demographics
- City population
- 37,216
- Population (ZIP)
- 4,781
Population outlook (Southeastern Connecticut County) Hauer SSP2
- By 2040
- 293,442
Race, ethnicity, and origin ACS 2023
- Neighborhood character
- Predominantly White (93%)
- Race & ethnicity
- White 93% Hispanic / Latino 3% Two or more races 2% Asian 1% Black 1%
- Common ancestry
- Lithuanian 14% Romanian 14% Slovak 2%
- Foreign-born
- 3% · Canada, Dominican Republic
- Languages at home
- 96% English-only · Spanish 2% Tagalog/Filipino 1%
Political lean MEDSL · Southeastern Connecticut
- 2024 margin
- D (+13.0) · D 55.6% · R 42.6% · Other 1.8%
- All cycles
- 2024: D+13.0
Not yet ingested
- Civics
- —
Market trends
- HPI YoY
- ▼ -31.95%
- Current HPI
- 195.6282
- Rent YoY
- —
- Metro
- —
- State GDP YoY
- ▲ 1.06%
- F500 in state
- 38
Industry mix (Fortune 500 HQ in CT)
| Industry | F500 HQs | Revenue |
|---|---|---|
| Industrial Machinery | 4 | $38B |
|
||
| Insurance | 3 | $71B |
|
||
| Financial Services | 2 | $25B |
|
||
| Transportation / Logistics | 2 | $18B |
|
||
| Healthcare | 1 | $247B |
|
||
| Telecommunications | 1 | $55B |
|
||
Price history
+189.0% since first listed11 events — show timeline
- 2026-04-27 Pending — Smart MLS
- 2026-04-13 Relisted — Smart MLS
- 2026-03-30 Contingent — Smart MLS
- 2025-12-15 Relisted — Smart MLS
- 2025-11-21 Pending — Smart MLS
- 2025-11-09 Relisted — Smart MLS
- 2025-09-08 Pending — Smart MLS
- 2025-08-28 Price Changed $250,000 Smart MLS
- 2025-08-06 Listed $275,000 Smart MLS
- 1999-04-08 Sold (MLS) $81,000 Smart MLS
- 1998-09-14 Listed $86,500 Smart MLS
Property tax history
+0.5%/yrLatest (2023): $2,991 · +0.1% YoY. Source: county tax records.
Cash-flow waterfall
monthlySold comps — $/sqft
last 12 mo · ≤1 miLoading sold comps…