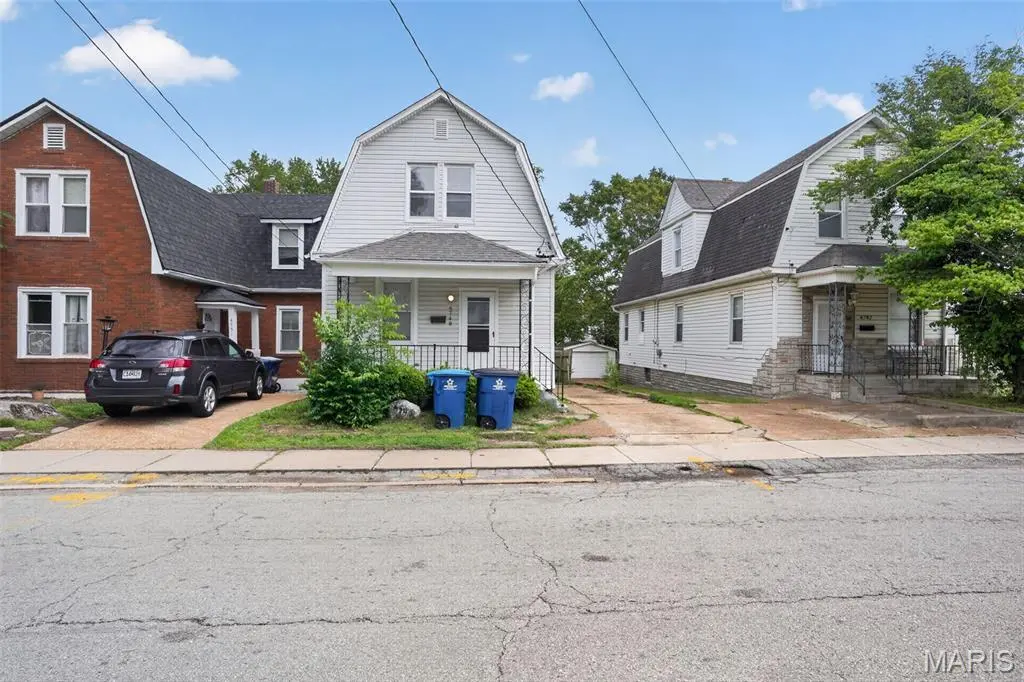
4749 Oldenburg Ave · St. Louis, MO
Flood risk 1/10 · Minimal
- FEMA flood zone
- X (unshaded)
- Chance of flooding over 30 yrs
- 0.0%
- Est. flood insurance / yr
- $473 – $860
Fire risk 1/10 · Minimal
- Est. fire insurance / yr
- $1,054 – $1,958
Heat risk 5/10 · Moderate
- Hot days now (above 108°F)
- 7 days/yr
- Hot days in 30 yrs
- 21 days/yr
Wind risk 2/10 · Minimal
- Chance of severe wind over 30 yrs
- 1.0%
Air-quality risk 3/10 · Minor
- Unhealthy air days now
- 3 days/yr
- Unhealthy air days in 30 yrs
- 4 days/yr
Risk factors via First Street. Map © Google.
Why this score? — see what drove the D grade
The composite is a weighted blend of 9 inputs, each scored 0–100. Each bar is that input's sub-score; the figure is the points it added to the 100-point composite (weight × sub-score).
- Cash flow +16.0/30.0
- ARV discount +7.0/15.0
- DSCR +4.9/10.0
- 1% rule +3.9/10.0
- Rent growth +3.3/5.0
- Schools +3.0/10.0
- Livability +2.5/5.0
- Condition / age +2.5/5.0
- Appreciation +0.0/10.0
$204,900
🖨 Deal sheet (PDF) 📄 Offer letter ✓ Due diligence
Listing remarks MLS
Home is perfect for a handy buyer looking for a fixer upper and equity OR an Investor's next flip or rental property. Home to be sold AS-IS. Seller to make no repairs nor perform any inspections. Please submit all offers on special sales contract with proof of funds / pre approval and allow 48 hour minimum response time.
Key facts
- Near dining
- Near shopping
- Near parks
Tags
Property features AI
Finance
- Other: Living area reported as 1,620 (source: public records); Lot dimensions approximately 30 x 120 on a 0.0826-acre parcel; Road frontage on a city street with asphalt surface
- Financial info: Lease not considered
- HOA & community: No HOA information provided
Exterior
- Parking: No carport spaces indicated
- Security: No security features listed
- Utilities: Public water; Public sewer; Electric service: Other
- Home design: Single family residence; Residential property; Two levels; Private ownership; Entry facing direction not specified
- Construction: Vinyl siding; Composition roof; Slab foundation; Built year not specified
- Exterior features: Level lot; No patio or porch; No pool
Interior
- Kitchen: Appliances: Other
- Bedrooms: Three bedrooms (all on the upper level)
- Flooring: Laminate flooring; Vinyl flooring
- Bathrooms: One full bathroom (upper level); One half bathroom (main level)
- Heating & cooling: Central air conditioning; Heating: Other
- Interior features: Partial basement; No fireplace; Other heating; Central air; Other appliances
- Laundry & utility: Washer/dryer details not provided
Neighborhood map
What this means for you Summary
Snapshot
- This is a 3-bed/1.5-bath single-family listed at $205k.
Deal economics
- At list price, monthly cash flow is $102 ($1k/yr) — positive.
- The deal already cash-flows at list — no discount required.
- To meet the 1% rule (rent ≥ 1% of price), the offer needs to be $182k (11.2% below list).
- Recommended offer: $182k (11.2% below list) — sets the bar for 1% rule.
- Cap rate 6.9% vs local median 5.0% in St. Louis — top-decile yield for the area; either an underpriced asset or a hidden risk that comps aren't pricing in. Stress-test before assuming the spread holds.
Location & tenants
- Location reads: area grade D — affects rentability + tenant quality, not the cash-flow math above.
- Bayless (suburban): math 28% / reading 42% proficiency, ranked #206 of 324 in MO (top 64%) — families likely to look elsewhere, expect single-tenant / working-renter base with shorter leases.
- Zoned schools: Bayless Elementary (math 31% / reading 38%, grade F, #676 of 1,115 statewide, top 66%, 814 students, 48% FRL); Bayless Junior High (math 31% / reading 45%, grade F, #211 of 391 statewide, top 55%, 418 students, 54% FRL); Bayless Senior High (math 8% / reading 42%, grade F, #436 of 521 statewide, top 85%, 566 students, 48% FRL) — zoned schools at 50% FRL track the district average.
- Market conditions: Rents rising (+3.0%/yr); 191 active listings in the ZIP; 19 comparable units currently listed for rent nearby; rentals leasing fast (median 12d on market — plan ~1-2 weeks tenant-placement turnaround); solid renter incomes; 920 units permitted in St. Louis County in 2024 (250 in 5+ unit buildings).
Forward outlook
- Local home prices are declining (-3.0%/yr); year-one equity from $1k of loan paydown is wiped out by about $6k of value loss. Plan a longer hold.
Negotiation context
- It's been on market 51 days — a 3% lower offer ($199k) is reasonable based on typical stale-listing flexibility.
- 2 sale attempts since 4y ago with the ask held roughly flat each time — persistent listings suggest the price (not the market) is what's stuck; bring a comps-based counter.
- Current owner paid $140k; 47% above their basis — modest negotiation headroom, anchor on the comps not their cost.
Risks & watch-outs
- Watch-outs: built in 1912 — expect roof / HVAC / electrical / plumbing capex.
- Climate carrying-cost: extreme-heat days projected 7→21/yr by 2055 (HVAC capex compounding) — expect insurance premiums to compound above CPI over the hold.
Questions for the listing agent
- It's been on market 51 days. Have you received any prior offers? Is the seller open to a 11% concession, seller financing, or rate buy-down credit?
- Built in 1912 — when were the roof, HVAC, electrical panel, plumbing, and water heater last replaced?
- Is there a deadline driving the sale (1031 exchange, divorce, estate, relocation)? That informs how much negotiation room exists.
- The area grade is low — what's the realistic commute time and amenity access for the typical tenant pool here? Any planned neighborhood developments (good or bad) we should know about?
- What's the average days-on-market for RENTAL listings here right now (not sales)? A rising rental-DOM trend means longer vacancies and softer asking-rent achievability than the comps imply.
- What's the recent tenant-quality profile in this submarket — average credit score on applications, eviction rate, late-payment / NSF rate, and stable-employment percentage? A property-management company in the area should have these aggregated.
- How much new for-sale + rental construction is in the pipeline within 1–3 miles? Heavy new supply typically softens prices + rents 12–24 months out; constrained supply supports both.
Investment metrics
- 1% rule
- 0.89% ✗
- Cap rate
- 6.89%
- Cash-on-cash
- 2.13%
- DSCR
- 1.09
- GRM
- 9.4
CMA / ARV
- ARV (median comp)
- $202,643
- List price
- $204,900
- Delta
- 1.11%
- Verdict
- FAIR
- Comps
- 20 within 1.0 mi
Show comp detail 12 sales within ~0.75 mi
| Address | Dist | Beds/Ba | Sqft | Sold | Price | $/sf | Match |
|---|---|---|---|---|---|---|---|
| 8108 Parkridge Dr | 0.35mi | 2/1.5 (-1) | 1,619 (-0%) | 8mo | $180,000 | $111 | 72 |
| 4837 Hannover Ave | 0.08mi | 2/1.5 (-1) | 1,836 (+13%) | 4mo | $145,000 | $79 | 65 |
| 4909 Arbors At Stonegate Ct | 0.43mi | 3/2.5 | 1,728 (+7%) | 3mo | $425,000 | $246 | 62 |
| 8370 Weber Trail Dr | 0.50mi | 3/2.0 | 1,752 (+8%) | 10mo | $395,000 | $225 | 53 |
| 8419 Weber Trail Dr | 0.59mi | 3/2.0 | 1,725 (+6%) | 9mo | $335,000 | $194 | 52 |
| 4719 Heege Rd | 0.34mi | 2/2.0 (-1) | 1,800 (+11%) | 9mo | $275,000 | $153 | 51 |
| 4101 Healy Ct | 0.73mi | 2/2.0 (-1) | 1,600 (-1%) | 9mo | $236,900 | $148 | 50 |
| 8120 Parkridge Dr | 0.32mi | 4/2.0 (+1) | 1,400 (-14%) | 8mo | $299,990 | $214 | 49 |
| 8015 Carlsbad Dr | 0.42mi | 3/1.0 | 1,393 (-14%) | 8mo | $214,900 | $154 | 49 |
| 5212 Vine Ave | 0.72mi | 2/2.0 (-1) | 1,650 (+2%) | 9mo | $310,000 | $188 | 49 |
| 227 Hernan Dr | 0.74mi | 2/1.0 (-1) | 1,500 (-7%) | 2mo | $224,900 | $150 | 45 |
| 5245 Robert Ave | 0.74mi | 2/2.0 (-1) | 1,536 (-5%) | 10mo | $279,500 | $182 | 42 |
Match score weights: distance 35% · size 25% · config 20% · recency 20%. Top-matched comps best support the ARV.
Projected returns pro-forma
-3.0% appreciation · 3.01% rent growth · sell at horizon
- IRR
- -12.9%
- Equity multiple
- 0.53×
- Total profit
- $-26,717
- Equity at exit
- $30,551
- IRR
- -3.9%
- Equity multiple
- 0.74×
- Total profit
- $-14,922
- Equity at exit
- $17,716
Cash invested: $57,372 (down + closing). Projections, not guarantees.
Landlord ↔ Tenant lean methodology
- Overall (STATE)
- 81 Strongly Landlord-Friendly
- State Missouri
- 81 Strongly Landlord-Friendly · R+10
- County
- — inherits STATE
- City
- — inherits STATE
ZIP-level market 63123
- Rents YoY
- 3.0%
- Active inventory
- 191
- Price-to-rent
- 9.4×
Monthly cashflow live
- Estimated rent
- $1,820 high interval (Pro) →
- Mortgage (P&I)
- −$1,075
- Tax from tax record
- −$176 /mo · $2,112/yr
- Insurance
- −$85
- HOA
- −$0
- Vacancy / Maint / Mgmt
- −$382
- Net cashflow
- $102
Break-even live
Sensitivity live
| Price | -10% $218 | -5% $160 | +0% $102 | +5% $44 | +10% $-14 |
|---|---|---|---|---|---|
| Rent | -10% $-42 | -5% $30 | +0% $102 | +5% $174 | +10% $246 |
| Rate | -1.0pp $205 | -0.5pp $154 | base $102 | +0.5pp $49 | +1.0pp $-5 |
UW: 25.0% down · 7.5% · 30yr · 1.5% tax · 5.0% vac · 8.0% maint · 8.0% mgmt
Financing live
Cash to close
- Down payment
- $51,225
- Closing costs
- $6,147
- Reserves months
- —
- Total cash needed
- —
Loan-product check · same deal, 3 products live
Conventional
25% down · 7.5% · 30yr
- Down + closing
- —
- Monthly P&I
- —
- Monthly cashflow
- —
- DSCR
- —
- Eligible?
- —
Personal DTI + credit; lowest rate.
DSCR
20% down · 8.5% · 30yr
- Down + closing
- —
- Monthly P&I
- —
- Monthly cashflow
- —
- DSCR
- —
- Eligible?
- —
No personal income docs; deal must DSCR.
Hard money
10% down · 12.0% · 12mo
- Down + closing
- —
- Monthly P&I
- —
- Monthly cashflow
- —
- DSCR
- —
- Eligible?
- —
Short-term bridge; refi at stabilization.
Rent comps 19 comps
| Address | Beds | Baths | Sqft | Rent | $/sqft | DOM | Units | Dist |
|---|---|---|---|---|---|---|---|---|
| 4610 Heege Rd Saint Louis, MO | 3.0 | 1.5 | 1205 | $1,485 | $1.23 | 18d | 1 | 0.53mi |
| 5452 Nagel Ave Saint Louis, MO | 2.0 | 1.0 | 1196 | $1,695 | $1.42 | 25d | 1 | 0.84mi |
| 5318 Quincy St Saint Louis, MO | 3.0 | 1.0 | 1100 | $1,650 | $1.50 | 25d | 1 | 0.86mi |
| 3945 Crosby Dr Saint Louis, MO | 2.0 | 1.0 | 1100 | $2,083 | $1.89 | 0d | 1 | 0.96mi |
| 7602 Elton St Saint Louis, MO | 3.0 | 1.0 | 1108 | $2,200 | $1.99 | 45d | 1 | 1.02mi |
| 6406 Woodbine Ct Saint Louis, MO | 2.0 | 2.0 | 1085 | $1,800 | $1.66 | 17d | 1 | 1.04mi |
| 5448 Lisette Ave Saint Louis, MO | 2.0 | 2.0 | 1059 | $2,100 | $1.98 | 0d | 1 | 1.11mi |
| 9204 Kit Dr Saint Louis, MO | 3.0 | 2.0 | 1820 | $1,680 | $0.92 | 0d | 1 | 1.12mi |
| 7529 Fleta St St. Louis, MO | 2.0 | 1.0–1.5 | 1173 | $1,612 | $1.37 | 12d | 10 | 1.13mi |
| 89 Willmore Rd Unit 89 Willmore Rd, 2N St. Louis, MO | 2.0 | 1.0 | 1103 | $1,350 | $1.22 | 25d | 1 | 1.16mi |
| 4114 Alma Ave Saint Louis, MO | 3.0 | 1.5 | 1269 | $2,065 | $1.63 | 3d | 1 | 1.25mi |
| 4114 Alma Ave Saint Louis, MO | 3.0 | 1.5 | 1269 | $2,065 | $1.63 | 0d | 1 | 1.25mi |
| 3857 Boulevard Heights Ct Saint Louis, MO | 3.0 | 2.5 | 1697 | $2,250 | $1.33 | 3d | 1 | 1.31mi |
| 5512 Milentz Ave Unit 1F St. Louis, MO | 2.0 | 1.0 | 1138 | $1,225 | $1.08 | 4d | 1 | 1.37mi |
| 5907 Jamieson Ave Saint Louis, MO | 2.0 | 1.0 | 1100 | $1,425 | $1.30 | 0d | 1 | 1.39mi |
| 5833 Jamieson Ave Saint Louis, MO | 2.0 | 1.0 | 1242 | $1,620 | $1.30 | 45d | 1 | 1.42mi |
| 5185 Goethe Ave Fl 1 St. Louis, MO | 3.0 | 2.0 | 1858 | $2,240 | $1.21 | 45d | 1 | 1.48mi |
| 5185 Goethe Ave Fl 2 St. Louis, MO | 2.0 | 1.0 | 1578 | $1,695 | $1.07 | 45d | 1 | 1.48mi |
| 5616 S Kingshighway Blvd Saint Louis, MO | 3.0 | 2.0 | 1400 | $1,830 | $1.31 | 0d | 1 | 1.49mi |
Listing history 27 events
-
2026-06-21days on market $204,900 Active 51 DOM
-
2026-06-18days on market $204,900 Active 48 DOM
-
2026-06-17days on market $204,900 Active 47 DOM
-
2026-06-16days on market $204,900 Active 46 DOM
-
2026-06-15days on market $204,900 Active 45 DOM
-
2026-06-13pricedays on market $204,900 Active 43 DOM
-
2026-06-09days on market $214,900 Active 39 DOM
-
2026-06-08days on market $214,900 Active 38 DOM
-
2026-06-07days on market $214,900 Active 37 DOM
-
2026-06-03days on market $214,900 Active 33 DOM
-
2026-06-02days on market $214,900 Active 32 DOM
-
2026-06-01days on market $214,900 Active 31 DOM
-
2026-05-31days on market $214,900 Active 30 DOM
-
2026-05-01$214,900 Active 1024-char remark
-
2022-08-08soldstatus $139,500
-
2022-08-04soldstatus Closed 322-char remark
Show marketing remark (322 chars)
Home is perfect for a handy buyer looking for a fixer upper and equity OR an Investor's next flip or rental property. Home to be sold AS-IS. Seller to make no repairs nor perform any inspections. Please submit all offers on special sales contract with proof of funds / pre approval and allow 48 hour minimum response time.
-
2022-07-20status Pending 322-char remark
Show marketing remark (322 chars)
Home is perfect for a handy buyer looking for a fixer upper and equity OR an Investor's next flip or rental property. Home to be sold AS-IS. Seller to make no repairs nor perform any inspections. Please submit all offers on special sales contract with proof of funds / pre approval and allow 48 hour minimum response time.
-
2022-07-18price $146,900 322-char remark
Show marketing remark (322 chars)
Home is perfect for a handy buyer looking for a fixer upper and equity OR an Investor's next flip or rental property. Home to be sold AS-IS. Seller to make no repairs nor perform any inspections. Please submit all offers on special sales contract with proof of funds / pre approval and allow 48 hour minimum response time.
-
2022-07-08price $154,900 322-char remark
Show marketing remark (322 chars)
Home is perfect for a handy buyer looking for a fixer upper and equity OR an Investor's next flip or rental property. Home to be sold AS-IS. Seller to make no repairs nor perform any inspections. Please submit all offers on special sales contract with proof of funds / pre approval and allow 48 hour minimum response time.
-
2022-07-08price $145,900 322-char remark
Show marketing remark (322 chars)
Home is perfect for a handy buyer looking for a fixer upper and equity OR an Investor's next flip or rental property. Home to be sold AS-IS. Seller to make no repairs nor perform any inspections. Please submit all offers on special sales contract with proof of funds / pre approval and allow 48 hour minimum response time.
-
2022-07-01$154,999 Active 322-char remark
Show marketing remark (322 chars)
Home is perfect for a handy buyer looking for a fixer upper and equity OR an Investor's next flip or rental property. Home to be sold AS-IS. Seller to make no repairs nor perform any inspections. Please submit all offers on special sales contract with proof of funds / pre approval and allow 48 hour minimum response time.
-
2009-10-01soldstatus $132,000
-
2009-07-02soldstatus
-
2009-06-30soldstatus $57,000
-
2001-11-08soldstatus $83,500
-
1992-09-29soldstatus $47,500
-
1985-11-01soldstatus
ⓘ Source: listings_history table (triggers on properties + properties_extension) + one-shot
backfill from property_details.listing_events for pre-trigger history.
Tax reassessment forecast MO · Resets to sale price
- Current annual tax
- $2,112 · $176/mo
- Projected year-2 tax
- $2,112 · $176/mo
- Expected delta
- $0/yr ($0/mo · 0.0%)
ⓘ Screening estimate from a state-policy table — verify with the county assessor before closing.
Climate risk First Street
- Flood 1/10 Low FEMA zone X (unshaded) · 0% chance over 30 yrs
- Wildfire 1/10 Low
- Heat 5/10 Major 7 d/yr ≥108°F today · 21 d/yr by 30 yrs out
- Wind 2/10 Low 100% chance of damaging wind over 30 yrs
- Air quality 3/10 Moderate 3 unhealthy d/yr today · 4 by 30 yrs out
Nearby sold comps map
Loading sold comps map…
Walkable amenities ~0.75 mi
Loading nearby amenities…
Taxation est. · year 1
- Rental income
- $21,839
- − Mortgage interest
- −$11,478
- − Property taxes
- −$2,112
- − Insurance
- −$1,024
- − Repairs & maintenance
- −$1,747
- − Management
- −$1,747
- − Depreciation
- −$5,961
- Taxable loss
- −$2,230
- Est. tax savings @ 24.0%
- +$535
- After-tax cash flow
- $1,758/yr
For passive investors: Depreciation is non-cash, so a rental often shows a tax loss while cash-flowing — sheltering income. Rental losses are passive: they offset passive income freely, and up to $25,000/yr can offset ordinary (W-2) income if you actively participate and your MAGI is under $100k (phasing out to $0 by $150k); unused losses carry forward. On sale, claimed depreciation is recaptured at up to 25%, and gains may owe capital-gains tax (a 1031 exchange can defer both). Figures are a year-1 estimate at your 24.0% rate — not tax advice; consult a CPA.
Schools (NCES district)
- District
- Bayless
- NCES district ID
- 2904500
- Math proficiency
- 28% ▼ -15.00%
- Reading proficiency
- 42% ▼ -8.00%
- Median HH income
- $49,378
- Composite
- 30.24/100
- National rank
- #6293
- State rank
- #206 of 324 in MO
Livability — St. Louis
No livability data for this city. (Only ~50 U.S. cities are tracked.)
Census & demographics
- County
- Saint Louis County · 888,823 people
- City population
- 283,259
- Metro
- St. Louis, MO-IL
- Population (ZIP)
- 49,077
- Household income
- $77,055
- Rent vs Own
- Severe rent burden
- 753.0
Population outlook (St. Louis County) Hauer SSP2
- Today (2025)
- 1,025,227 people
- By 2030
- 1,028,023 · +0.3%
- By 2040
- 1,020,940 · -0.4%
- By 2050
- 1,007,280 · -1.8%
- By 2075
- 987,277 · -3.7%
- By 2100
- 921,984 · -10.1%
Race, ethnicity, and origin ACS 2023
- Neighborhood character
- Predominantly White (82%)
- Race & ethnicity
- White 82% Two or more races 7% Asian 5% Hispanic / Latino 5% Black 3%
- Common ancestry
- American 5% Lithuanian 3% Romanian 2%
- Foreign-born
- 13% · Vietnam, Canada
- Languages at home
- 83% English-only · Russian/Polish/Slavic 6% Spanish 3% Other Indo-European 3%
Political lean MEDSL · St. Louis
- 2024 margin
- Strong D (+23.4) · D 60.8% · R 37.4% · Other 1.7%
- 2008→2024 swing
- +3.5pp toward D · 2008: 19.9pp · 2024: 23.4pp
- All cycles
- 2024: D+23.4 2020: D+24.0 2016: D+16.2 2012: D+13.7 2008: D+19.9
Not yet ingested
- Civics
- —
Market trends
- HPI YoY
- ▼ -229.90%
- Current HPI
- 220.258
- Rent YoY
- ▲ 3.01%
- Metro
- St. Louis, MO-IL
- State GDP YoY
- ▲ 1.84%
- F500 in state
- 20
Industry mix (Fortune 500 HQ in MO)
| Industry | F500 HQs | Revenue |
|---|---|---|
| Healthcare | 1 | $163B |
|
||
| Insurance | 1 | $21B |
|
||
| Industrial Technology | 1 | $17B |
|
||
| Retail | 1 | $16B |
|
||
| Industrial Distribution | 1 | $10B |
|
||
| Utilities | 1 | $9B |
|
||
Price history
+331.4% since first listed15 events — show timeline
- 2026-06-11 Price Changed $204,900 MARIS as Distributed by MLS Grid
- 2026-05-01 Listed $214,900 MARIS as Distributed by MLS Grid
- 2022-08-08 Sold (Public Records) $139,500 Public Records
- 2022-08-04 Sold (MLS) — MARIS as Distributed by MLS Grid
- 2022-07-20 Pending — MARIS as Distributed by MLS Grid
- 2022-07-18 Price Changed $146,900 MARIS as Distributed by MLS Grid
- 2022-07-08 Price Changed $154,900 MARIS as Distributed by MLS Grid
- 2022-07-08 Price Changed $145,900 MARIS as Distributed by MLS Grid
- 2022-07-01 Listed $154,999 MARIS as Distributed by MLS Grid
- 2009-10-01 Sold (Public Records) $132,000 Public Records
- 2009-07-02 Sold (Public Records) — Public Records
- 2009-06-30 Sold (Public Records) $57,000 Public Records
- 2001-11-08 Sold (Public Records) $83,500 Public Records
- 1992-09-29 Sold (Public Records) $47,500 Public Records
- 1985-11-01 Sold (Public Records) — Public Records
Property tax history
+5.5%/yrLatest (2022): $2,112 · +2.6% YoY. Source: county tax records.
Cash-flow waterfall
monthlySold comps — $/sqft
last 12 mo · ≤1 miLoading sold comps…