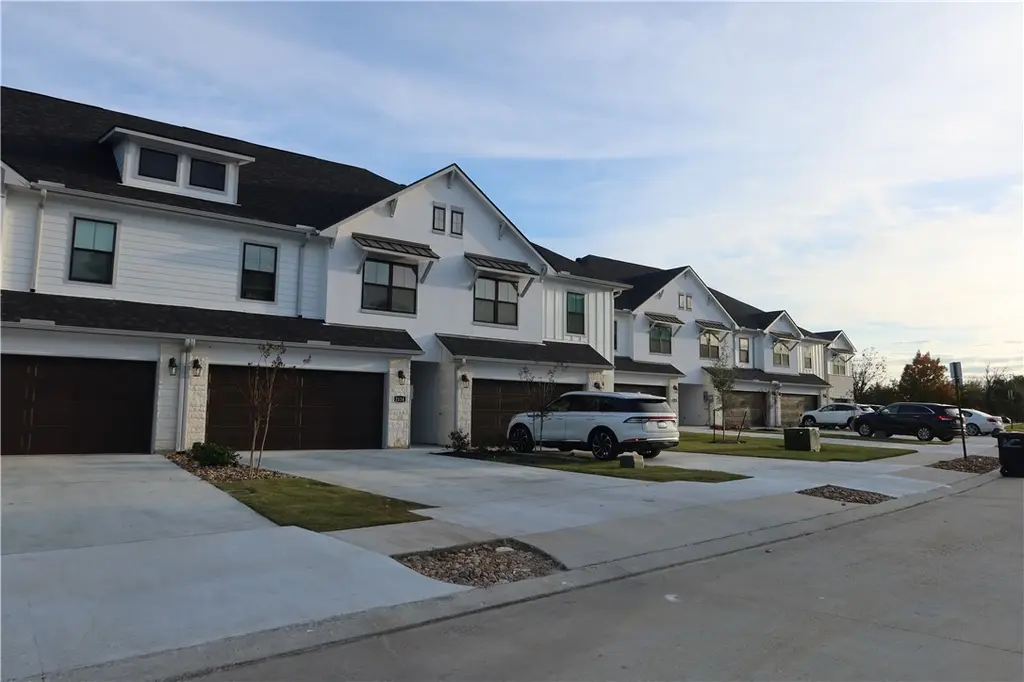
1454 Ailin Dr · College Station, TX
Flood risk 1/10 · Minimal
- FEMA flood zone
- X (unshaded)
- Chance of flooding over 30 yrs
- 0.0%
- Est. flood insurance / yr
- $507 – $1,088
Fire risk 5/10 · Moderate
- Est. fire insurance / yr
- $1,222 – $2,270
Heat risk 8/10 · Major
- Hot days now (above 110°F)
- 7 days/yr
- Hot days in 30 yrs
- 24 days/yr
Wind risk 8/10 · Major
- Chance of severe wind over 30 yrs
- 80.0%
Air-quality risk 1/10 · Minimal
- Unhealthy air days now
- 0 days/yr
- Unhealthy air days in 30 yrs
- 0 days/yr
Risk factors via First Street. Map © Google.
Why this score? — see what drove the D+ grade
The composite is a weighted blend of 9 inputs, each scored 0–100. Each bar is that input's sub-score; the figure is the points it added to the 100-point composite (weight × sub-score).
- Cash flow +22.1/30.0
- DSCR +7.1/10.0
- 1% rule +6.5/10.0
- Livability +4.2/5.0
- Rent growth +3.3/5.0
- Schools +2.6/10.0
- Condition / age +2.5/5.0
- ARV discount +0.0/15.0
- Appreciation +0.0/10.0
$387,900
🖨 Deal sheet 📄 Offer letter ✓ Due diligence
Listing remarks
Investor Opportunity – Turnkey Income-Producing Property in ACE Townhomes! Beautiful 4-bedroom, 4.5-bath townhome featuring an extra-large 2-car garage and a highly desirable open-concept floor plan. The interior showcases elegant light fixtures, high ceilings with extensive crown molding, and durable luxury vinyl plank flooring throughout including the stairways. The spacious kitchen is designed for both functionality and style, offering granite countertops, a large center island, stainless steel appliances, ample cabinetry, and a convenient corner pantry. Each bedroom includes its own private en-suite bathroom and walk-in closet, providing excellent privacy and strong rental appeal.
Key facts
- Large center island
- Walk-in closet
- Granite countertops
Tags
Property features AI
Finance
- Other: Green/energy efficient features: HVAC, insulation, thermostat, windows
- HOA & community: Homeowners association with monthly fee of $120; HOA includes grounds maintenance
Exterior
- Parking: Attached 2-car garage with garage door opener; 2 covered parking spaces
- Security: Smoke detector(s)
- Utilities: Public water; Public sewer; Electricity available; Water available; Sewer available
- Home design: Residential townhouse; Two levels
- Construction: Built with other construction materials; Slab foundation
- Exterior features: Wood fencing; Composition shingle roof; Maintenance-covered grounds (HOA)
Interior
- Kitchen: Electric oven; Built-in electric oven; Electric range; Dishwasher; Microwave; Refrigerator
- Flooring: Other
- Bathrooms: 4 full bathrooms; 1 half bathroom
- Heating & cooling: Central heating (electric); Central air (electric); Ceiling fans
- Interior features: Granite counters; High ceilings; Ceiling fans; Kitchen island; Low emissivity windows; Window treatments; Smoke detectors
- Laundry & utility: Washer; Dryer; Electric water heater
Neighborhood map
What this means for you Summary
Snapshot
- This is a 4-bed/4.5-bath townhouse listed at $388k.
Deal economics
- At list price, monthly cash flow is $625 ($7k/yr) — positive.
- The deal already cash-flows at list — no discount required.
- Meets the 1% rule at list price ($4k rent vs $388k).
- Recommended offer: $376k (3.0% below list) — sets the bar for market timing.
- Cap rate 8.2% vs local median 3.3% in College Station — top-decile yield for the area; either an underpriced asset or a hidden risk that comps aren't pricing in. Stress-test before assuming the spread holds.
Location & tenants
- Location reads 83/100 on livability (#11 in TX, #994 nationally) — a professional / high-income tenant draw. Strengths: amenities A+, commute A+, crime A-; Watch: employment C-.
- Bryan ISD (urban): math 30% / reading 32% proficiency, ranked #608 of 826 in TX (top 74%) — families likely to look elsewhere, expect single-tenant / working-renter base with shorter leases; 68% free/reduced lunch — lower-income household profile, screen leases tightly.
- Market conditions: Rents rising (+3.1%/yr); 1168 active listings in the ZIP; 8 comparable units currently listed for rent nearby; rentals at typical pace (median 21d on market — plan ~3-4 weeks tenant-placement turnaround); solid renter incomes; 2,211 units permitted in Brazos County in 2024 (768 in 5+ unit buildings).
- At $4,458/mo this rent would consume 60% of the median local household income ($89k/yr) (locally 3329% of renters already pay >50% of income on rent) — very limited rent-growth headroom before tenants either downsize or default.
Forward outlook
- Local home prices are declining (-3.0%/yr); year-one equity from $3k of loan paydown is wiped out by about $12k of value loss. Plan a longer hold.
- Brazos County population projected at +55% by 2050 — long-run rental-demand tailwind backs the buy-and-hold thesis.
Negotiation context
- It's been on market 33 days — a 3% lower offer ($376k) is reasonable based on typical stale-listing flexibility.
- 3 sale attempts since 3y ago with the ask held roughly flat each time — persistent listings suggest the price (not the market) is what's stuck; bring a comps-based counter.
Risks & watch-outs
- Climate carrying-cost: severe wind risk, 80% chance of damaging wind over 30y; moderate wildfire risk; extreme-heat days projected 7→24/yr by 2055 (HVAC capex compounding) — expect insurance premiums to compound above CPI over the hold.
Questions for the listing agent
- It's been on market 33 days. Have you received any prior offers? Is the seller open to a 3% concession, seller financing, or rate buy-down credit?
- What does the HOA fee cover, when was the last increase, and are there any pending special assessments or reserve-fund shortfalls?
- Is there a deadline driving the sale (1031 exchange, divorce, estate, relocation)? That informs how much negotiation room exists.
- Schools are B-rated — typically a magnet for longer-tenancy family renters. What's the average tenant stay here, and is there a school-zone premium baked into asking?
- The area grade is low — what's the realistic commute time and amenity access for the typical tenant pool here? Any planned neighborhood developments (good or bad) we should know about?
- What's the average days-on-market for RENTAL listings here right now (not sales)? A rising rental-DOM trend means longer vacancies and softer asking-rent achievability than the comps imply.
- What's the recent tenant-quality profile in this submarket — average credit score on applications, eviction rate, late-payment / NSF rate, and stable-employment percentage? A property-management company in the area should have these aggregated.
- How much new for-sale + rental construction is in the pipeline within 1–3 miles? Heavy new supply typically softens prices + rents 12–24 months out; constrained supply supports both.
Investment metrics
- 1% rule
- 1.15% ✓
- Cap rate
- 8.23%
- Cash-on-cash
- 6.90%
- DSCR
- 1.31
- GRM
- 7.3
CMA / ARV
- ARV (median comp)
- $300,667
- List price
- $387,900
- Delta
- 29.01%
- Verdict
- OVERPRICED
- Comps
- 15 within 1.0 mi
Show comp detail 5 sales within ~0.75 mi
| Address | Dist | Beds/Ba | Sqft | Sold | Price | $/sf | Match |
|---|---|---|---|---|---|---|---|
| 3804 Silverthorne Ln | 0.29mi | 4/3.5 | 1,858 (+1%) | 20mo | $333,000 | $179 | 65 |
| 3825 Blackhawk Ln | 0.35mi | 3/3.5 (-1) | 1,818 (-1%) | 11mo | $324,900 | $179 | 63 |
| 1758 Lonetree Dr | 0.39mi | 3/3.0 (-1) | 1,610 (-13%) | 7mo | $334,000 | $207 | 44 |
| 1617 Buena Vis | 0.46mi | 3/2.5 (-1) | 1,598 (-13%) | 8mo | $339,999 | $213 | 36 |
| 1756 Dakota Ln | 0.50mi | 3/2.0 (-1) | 1,605 (-13%) | 16mo | $349,000 | $217 | 26 |
Match score weights: distance 35% · size 25% · config 20% · recency 20%. Top-matched comps best support the ARV.
Projected returns pro-forma
-3.0% appreciation · 3.13% rent growth · sell at horizon
- IRR
- -5.5%
- Equity multiple
- 0.79×
- Total profit
- $-22,276
- Equity at exit
- $57,837
- IRR
- 4.4%
- Equity multiple
- 1.32×
- Total profit
- $35,063
- Equity at exit
- $33,539
Cash invested: $108,612 (down + closing). Projections, not guarantees.
Landlord ↔ Tenant lean methodology
- Overall (STATE)
- 87 Strongly Landlord-Friendly
- State Texas
- 87 Strongly Landlord-Friendly · R+5
- County
- — inherits STATE
- City
- — inherits STATE
ZIP-level market 77845
- Rents YoY
- 3.1%
- Active inventory
- 1168
- Price-to-rent
- 7.3×
Monthly cashflow live
- Estimated rent
- $4,458 high interval (Pro) →
- Mortgage (P&I)
- −$2,034
- Tax from tax record
- −$581 /mo · $6,977/yr
- Insurance
- −$162
- HOA
- −$120
- Vacancy / Maint / Mgmt
- −$936
- Net cashflow
- $625
Break-even live
UW: 25.0% down · 7.5% · 30yr · 1.5% tax · 5.0% vac · 8.0% maint · 8.0% mgmt
Financing live
Cash to close
- Down payment
- $96,975
- Closing costs
- $11,637
- Reserves months
- —
- Total cash needed
- —
Loan-product check · same deal, 3 products live
Conventional
25% down · 7.5% · 30yr
- Down + closing
- —
- Monthly P&I
- —
- Monthly cashflow
- —
- DSCR
- —
- Eligible?
- —
Personal DTI + credit; lowest rate.
DSCR
20% down · 8.5% · 30yr
- Down + closing
- —
- Monthly P&I
- —
- Monthly cashflow
- —
- DSCR
- —
- Eligible?
- —
No personal income docs; deal must DSCR.
Hard money
10% down · 12.0% · 12mo
- Down + closing
- —
- Monthly P&I
- —
- Monthly cashflow
- —
- DSCR
- —
- Eligible?
- —
Short-term bridge; refi at stabilization.
Rent comps 8 comps
| Address | Beds | Baths | Sqft | Rent | $/sqft | DOM | Units | Dist |
|---|---|---|---|---|---|---|---|---|
| 2126 Crescent Pointe Pkwy College Station, TX | 4.0 | 4.5 | 1864 | $650 | $0.35 | 44d | 1 | 0.11mi |
| 1416 Crescent Ridge Dr Unit 1328076P College Station, TX | 4.0 | 3.0 | 1980 | $7,187 | $3.63 | 21d | 1 | 0.12mi |
| 1761 Dakota Ln College Station, TX | 3.0 | 2.5 | 1598 | $2,250 | $1.41 | 21d | 1 | 0.49mi |
| 1762 Dakota Ln Unit 1328094P College Station, TX | 3.0 | 3.0 | 1506 | $2,852 | $1.89 | 21d | 1 | 0.52mi |
| 1720 Summit Crossing Ln College Station, TX | 1.0–3.0 | 1.0–2.0 | 983 | $2,205 | $2.24 | 13d | 46 | 0.66mi |
| 4150 Pendleton Dr Bryan, TX | 1.0–3.0 | 1.0–3.0 | 1061 | $1,955 | $1.84 | 13d | 28 | 0.89mi |
| 5040 Mooney Falls Dr Unit 1328058P Bryan, TX | 3.0 | 2.0 | 1840 | $5,551 | $3.02 | 13d | 1 | 1.24mi |
| 5041 Mooney Falls Dr Bryan, TX | 3.0 | 2.0 | 1814 | $2,400 | $1.32 | 44d | 1 | 1.27mi |
HOA detail
- Monthly dues
- $120 · $1,440/yr
Listing history 7 events
-
2026-05-30days on market $387,900 Active 33 DOM
-
2026-04-27$387,900 Active 1059-char remark
-
2025-01-25historical $2,660
-
2025-01-16$2,660
-
2024-01-30historical $2,500
-
2024-01-06price $2,500
-
2023-12-13$2,475
ⓘ Source: listings_history table (triggers on properties + properties_extension) + one-shot
backfill from property_details.listing_events for pre-trigger history.
Tax reassessment forecast TX · Resets to sale price
- Current annual tax
- $6,977 · $581/mo
- Projected year-2 tax
- $7,099 · $592/mo
- Expected delta
- +$122/yr (+$10/mo · 1.7%)
ⓘ Screening estimate from a state-policy table — verify with the county assessor before closing.
Climate risk First Street
- Flood 1/10 Low FEMA zone X (unshaded) · 0% chance over 30 yrs
- Wildfire 5/10 Major
- Heat 8/10 Severe 7 d/yr ≥110°F today · 24 d/yr by 30 yrs out
- Wind 8/10 Severe 80% chance of damaging wind over 30 yrs
- Air quality 1/10 Low 0 unhealthy d/yr today · 0 by 30 yrs out
Nearby sold comps map
Loading sold comps map…
Walkable amenities ~0.75 mi
Loading nearby amenities…
Taxation est. · year 1
- Rental income
- $53,500
- − Mortgage interest
- −$21,728
- − Property taxes
- −$6,977
- − Insurance
- −$1,940
- − Repairs & maintenance
- −$4,280
- − Management
- −$4,280
- − HOA
- −$1,440
- − Depreciation
- −$11,284
- Taxable income
- $1,571
- Est. tax owed @ 24.0%
- −$377
- After-tax cash flow
- $7,121/yr
For passive investors: Depreciation is non-cash, so a rental often shows a tax loss while cash-flowing — sheltering income. Rental losses are passive: they offset passive income freely, and up to $25,000/yr can offset ordinary (W-2) income if you actively participate and your MAGI is under $100k (phasing out to $0 by $150k); unused losses carry forward. On sale, claimed depreciation is recaptured at up to 25%, and gains may owe capital-gains tax (a 1031 exchange can defer both). Figures are a year-1 estimate at your 24.0% rate — not tax advice; consult a CPA.
Schools (NCES district)
- District
- Bryan ISD
- NCES district ID
- 4811790
- Math proficiency
- 30% ▼ -8.00%
- Reading proficiency
- 32% ▼ -3.00%
- Median HH income
- $41,895
- Composite
- 26.26/100
- National rank
- #7253
- State rank
- #608 of 826 in TX
Livability — College Station
- Score
- 83/100
- State rank
- #11
- US rank
- #994
Category grades
Schools grade is shown separately in the Schools card above.
Census & demographics
- Census place
- College Station, TX
- County
- Brazos County · 233,400 people
- City population
- 131,628
- Metro
- College Station-Bryan, TX
- Population (ZIP)
- 76,764
- Household income
- $88,851
- Rent vs Own
- Severe rent burden
- 3329.0
Population outlook (Brazos County) Hauer SSP2
- Today (2025)
- 267,942 people
- By 2030
- 296,630 · +10.7%
- By 2040
- 354,560 · +32.3%
- By 2050
- 414,616 · +54.7%
- By 2075
- 562,158 · +109.8%
- By 2100
- 678,828 · +153.3%
Race, ethnicity, and origin ACS 2023
- Neighborhood character
- Predominantly White (69%)
- Race & ethnicity
- White 69% Hispanic / Latino 16% Two or more races 9% Asian 8% Black 5%
- Hispanic origin (detail)
- Mexican 12%
- Common ancestry
- Lithuanian 2% Romanian 2% Italian 2%
- Foreign-born
- 11% · Canada, China, South Korea
- Languages at home
- 83% English-only · Spanish 8% Other Indo-European 3% Chinese 2%
Political lean MEDSL · Brazos
- 2024 margin
- Strong R (+24.9) · D 36.9% · R 61.7% · Other 1.4%
- 2008→2024 swing
- +4.1pp toward D · 2008: -28.9pp · 2024: -24.9pp
- All cycles
- 2024: R+24.9 2020: R+14.3 2016: R+23.7 2012: R+35.3 2008: R+28.9
Not yet ingested
- Civics
- —
Market trends
- HPI YoY
- ▼ -133.31%
- Current HPI
- 175.9669
- Rent YoY
- ▲ 3.13%
- Metro
- College Station-Bryan, TX
- State GDP YoY
- ▲ 3.95%
- F500 in state
- 110
Industry mix (Fortune 500 HQ in TX)
| Industry | F500 HQs | Revenue |
|---|---|---|
| Energy | 16 | $1,198B |
|
||
| Technology | 5 | $198B |
|
||
| Engineering / Construction | 4 | $72B |
|
||
| Energy Services | 3 | $60B |
|
||
| Utilities | 3 | $41B |
|
||
| Healthcare | 2 | $330B |
|
||
Price history
+15572.7% since first listed6 events — show timeline
- 2026-04-27 Listed $387,900 BCSRMLS
- 2025-01-25 Rental Removed $2,660 BCSRMLS
- 2025-01-16 Listed for Rent $2,660 BCSRMLS
- 2024-01-30 Rental Removed $2,500 BCSRMLS
- 2024-01-06 Price Changed $2,500 BCSRMLS
- 2023-12-13 Listed for Rent $2,475 BCSRMLS
Property tax history
+60.1%/yrLatest (2025): $6,977 · +1.1% YoY. Source: county tax records.
Cash-flow waterfall
monthlySold comps — $/sqft
last 12 mo · ≤1 miLoading sold comps…