15013 Reyes Rd · Fort Worth, TX
Flood risk 1/10 · Minimal
- FEMA flood zone
- X (unshaded)
- Chance of flooding over 30 yrs
- 0.0%
- Est. flood insurance / yr
- —
Fire risk 7/10 · Major
- Est. fire insurance / yr
- $1,222 – $2,270
Heat risk 7/10 · Major
- Hot days now (above 109°F)
- 7 days/yr
- Hot days in 30 yrs
- 22 days/yr
Wind risk 6/10 · Moderate
- Chance of severe wind over 30 yrs
- 22.0%
Air-quality risk No data
- Unhealthy air days now
- —
- Unhealthy air days in 30 yrs
- —
Risk factors via First Street. Map © Google.
Why this score? — see what drove the D grade
The composite is a weighted blend of 9 inputs, each scored 0–100. Each bar is that input's sub-score; the figure is the points it added to the 100-point composite (weight × sub-score).
- Cash flow +11.0/30.0
- ARV discount +10.7/15.0
- Schools +4.6/10.0
- Livability +4.0/5.0
- 1% rule +3.4/10.0
- DSCR +3.2/10.0
- Rent growth +2.8/5.0
- Condition / age +1.0/5.0
- Appreciation +0.0/10.0
$272,999
🖨 Deal sheet 📄 Offer letter ✓ Due diligence
Listing remarks
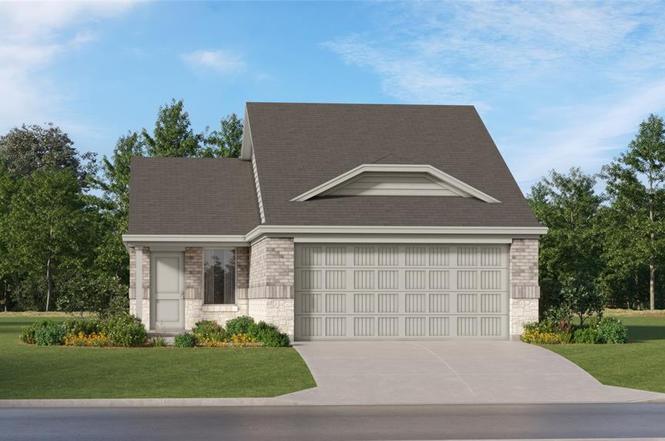
This single-level home showcases a spacious open floorplan shared between the kitchen, dining area and family room for easy entertaining, along with access to an outdoor space. An owner’s suite enjoys a private location in a rear corner of the home, complemented by an en-suite bathroom and walk-in closet. There are two secondary bedrooms at the front of the home, ideal for household members and overnight guests. Prices and features may vary and are subject to change. Photos are for illustrative purposes only.
Key facts
- Walk-in closet
- Open floorplan
- Outdoor space
Tags
Neighborhood map
What this means for you Summary
Snapshot
- This is a 3-bed/2.0-bath single-family listed at $273k. Condition is rated poor.
Deal economics
- At list price, monthly cash flow is $-113 ($-1k/yr) — negative.
- To cash-flow at today's rent, offer at most $257k (6.0% below list).
- To meet the 1% rule (rent ≥ 1% of price), the offer needs to be $230k (15.9% below list).
- Recommended offer: $230k (15.9% below list) — sets the bar for 1% rule.
- Cap rate 5.8% vs local median 3.9% in Fort Worth — top-decile yield for the area; either an underpriced asset or a hidden risk that comps aren't pricing in. Stress-test before assuming the spread holds.
Location & tenants
- Location reads 80/100 on livability (#49 in TX, #1,954 nationally) — a professional / high-income tenant draw. Strengths: amenities A+, cost of living A+, housing A+; Watch: crime F.
- Northwest ISD (rural): math 48% / reading 52% proficiency, ranked #120 of 826 in TX (top 14%) — acceptable for families but not a draw, mixed tenant base, ~2y average lease.
- Zoned schools: Lance Thompson El (math 56% / reading 60%, grade C+, #480 of 4,322 statewide, top 11%, 825 students, 7% FRL) — zoned schools average 7% FRL vs 22% district-wide (15 pts lower); this property's tenant base skews higher-income than the district average.
- Market conditions: Rents rising (+1.1%/yr); 1083 active listings in the ZIP; 40 comparable units currently listed for rent nearby; rentals at typical pace (median 19d on market — plan ~3-4 weeks tenant-placement turnaround); high-income renter base; 10,531 units permitted in Denton County in 2024 (2,713 in 5+ unit buildings).
Forward outlook
- Local home prices are declining (-3.0%/yr); year-one equity from $2k of loan paydown is wiped out by about $8k of value loss. Plan a longer hold.
- Denton County population projected at +66% by 2050 — long-run rental-demand tailwind backs the buy-and-hold thesis.
Negotiation context
- It's been on market 43 days — a 3% lower offer ($265k) is reasonable based on typical stale-listing flexibility.
Risks & watch-outs
- Climate carrying-cost: major wind risk, 22% chance of damaging wind over 30y; major wildfire risk; extreme-heat days projected 7→22/yr by 2055 (HVAC capex compounding) — expect insurance premiums to compound above CPI over the hold.
Questions for the listing agent
- What do current leases actually rent for vs. the listed asking? Can we see a recent rent roll and the last 12 months of T-12 income?
- It's been on market 43 days. Have you received any prior offers? Is the seller open to a 16% concession, seller financing, or rate buy-down credit?
- Have any recent inspections been done? Can we get a copy of the seller's disclosures and any deferred-maintenance estimates?
- What does the HOA fee cover, when was the last increase, and are there any pending special assessments or reserve-fund shortfalls?
- Is there a deadline driving the sale (1031 exchange, divorce, estate, relocation)? That informs how much negotiation room exists.
- Schools are D-rated, which usually means shorter tenancies and higher turnover. Who's the typical renter profile here, and what's been the actual vacancy rate?
- Crime grade is F in this area — have there been break-ins, vandalism, or insurance claims at this property in the last 3 years? What carrier currently insures it and at what premium?
- The area grade is low — what's the realistic commute time and amenity access for the typical tenant pool here? Any planned neighborhood developments (good or bad) we should know about?
- What's the average days-on-market for RENTAL listings here right now (not sales)? A rising rental-DOM trend means longer vacancies and softer asking-rent achievability than the comps imply.
- What's the recent tenant-quality profile in this submarket — average credit score on applications, eviction rate, late-payment / NSF rate, and stable-employment percentage? A property-management company in the area should have these aggregated.
- How much new for-sale + rental construction is in the pipeline within 1–3 miles? Heavy new supply typically softens prices + rents 12–24 months out; constrained supply supports both.
Investment metrics
- 1% rule
- 0.84% ✗
- Cap rate
- 5.80%
- Cash-on-cash
- -1.77%
- DSCR
- 0.92
- GRM
- 9.9
CMA / ARV
- ARV (on-the-fly)
- $293,661
- Comps found
- 12
Show comp detail 12 sales within ~0.75 mi
| Address | Dist | Beds/Ba | Sqft | Sold | Price | $/sf | Match |
|---|---|---|---|---|---|---|---|
| 1305 Blazin Bronco Trl | 0.15mi | 3/2.0 | 1,451 (-1%) | 1mo | $264,999 | $183 | 91 |
| 15024 Reyes Rd | 0.00mi | 3/2.0 | 1,311 (-10%) | 0mo | $279,999 | $214 | 83 |
| 14928 Reyes Rd | 0.00mi | 3/2.0 | 1,311 (-10%) | 1mo | $263,999 | $201 | 82 |
| 1353 Blazin Bronco Trl | 0.13mi | 3/2.0 | 1,311 (-10%) | 2mo | $293,184 | $224 | 75 |
| 15200 Mariachi Rd | 0.36mi | 3/2.0 | 1,522 (+4%) | 1mo | $278,999 | $183 | 75 |
| 1337 Blazin Bronco Trl | 0.13mi | 3/2.0 | 1,311 (-10%) | 3mo | $246,999 | $188 | 74 |
| 1348 Blazin Bronco Trl | 0.25mi | 3/2.0 | 1,302 (-11%) | 1mo | $267,999 | $206 | 69 |
| 1373 Blazin Bronco Trl | 0.31mi | 3/2.0 | 1,302 (-11%) | 1mo | $279,999 | $215 | 66 |
| 15017 Santoscoy St | 0.38mi | 3/2.0 | 1,628 (+11%) | 1mo | $310,990 | $191 | 63 |
| 15033 Santoscoy St | 0.39mi | 3/2.0 | 1,628 (+11%) | 1mo | $309,990 | $190 | 62 |
| 15048 Santoscoy St | 0.43mi | 3/2.0 | 1,628 (+11%) | 2mo | $312,990 | $192 | 59 |
| 800 Amberwood Ct | 0.64mi | 3/2.0 | 1,354 (-7%) | 2mo | $290,000 | $214 | 56 |
Match score weights: distance 35% · size 25% · config 20% · recency 20%. Top-matched comps best support the ARV.
Projected returns pro-forma
-3.0% appreciation · 1.08% rent growth · sell at horizon
- IRR
- -21.4%
- Equity multiple
- 0.27×
- Total profit
- $-55,710
- Equity at exit
- $40,705
- IRR
- -20.4%
- Equity multiple
- 0.02×
- Total profit
- $-74,700
- Equity at exit
- $23,604
Cash invested: $76,440 (down + closing). Projections, not guarantees.
Landlord ↔ Tenant lean methodology
- Overall (STATE)
- 87 Strongly Landlord-Friendly
- State Texas
- 87 Strongly Landlord-Friendly · R+5
- County
- — inherits STATE
- City
- — inherits STATE
ZIP-level market 76052
- Home prices YoY
- -25.0%
- Rents YoY
- 1.1%
- Active inventory
- 1083
- Price-to-rent
- 9.9×
Monthly cashflow live
- Estimated rent
- $2,296 high interval (Pro) →
- Mortgage (P&I)
- −$1,432
- Tax est. 1.5%
- −$341 /mo · $4,095/yr
- Insurance
- −$114
- HOA
- −$40
- Vacancy / Maint / Mgmt
- −$482
- Net cashflow
- $-113
Break-even live
UW: 25.0% down · 7.5% · 30yr · 1.5% tax · 5.0% vac · 8.0% maint · 8.0% mgmt
Financing live
Cash to close
- Down payment
- $68,250
- Closing costs
- $8,190
- Reserves months
- —
- Total cash needed
- —
Loan-product check · same deal, 3 products live
Conventional
25% down · 7.5% · 30yr
- Down + closing
- —
- Monthly P&I
- —
- Monthly cashflow
- —
- DSCR
- —
- Eligible?
- —
Personal DTI + credit; lowest rate.
DSCR
20% down · 8.5% · 30yr
- Down + closing
- —
- Monthly P&I
- —
- Monthly cashflow
- —
- DSCR
- —
- Eligible?
- —
No personal income docs; deal must DSCR.
Hard money
10% down · 12.0% · 12mo
- Down + closing
- —
- Monthly P&I
- —
- Monthly cashflow
- —
- DSCR
- —
- Eligible?
- —
Short-term bridge; refi at stabilization.
Rent comps 40 comps
| Address | Beds | Baths | Sqft | Rent | $/sqft | DOM | Units | Dist |
|---|---|---|---|---|---|---|---|---|
| 15016 Reyes Rd Fort Worth, TX | 3.0 | 2.0 | 1461 | $2,099 | $1.44 | 1d | 1 | 0.02mi |
| 14933 Tejano St Haslet, TX | 3.0 | 2.0 | 1460 | $2,300 | $1.58 | 21d | 1 | 0.10mi |
| 15021 Red Sands Trl Haslet, TX | 3.0 | 2.0 | 1311 | $2,045 | $1.56 | 44d | 1 | 0.23mi |
| 15133 Hacienda Post Trl Haslet, TX | 3.0 | 2.0 | 1298 | $1,999 | $1.54 | 22d | 1 | 0.26mi |
| 15024 Red Sands Trl Haslet, TX | 4.0 | 2.0 | 1725 | $2,200 | $1.28 | 13d | 1 | 0.26mi |
| 15241 Rangeland Rd Haslet, TX | 3.0 | 2.0 | 1451 | $2,099 | $1.45 | 7d | 1 | 0.29mi |
| 15245 Rangeland Rd Haslet, TX | 3.0 | 2.0 | 1461 | $2,089 | $1.43 | 7d | 1 | 0.30mi |
| 15249 Rangeland Rd Haslet, TX | 3.0 | 2.0 | 1451 | $2,099 | $1.45 | 7d | 1 | 0.30mi |
| 15240 Grappling Irons Ln Haslet, TX | 3.0 | 2.0 | 1451 | $2,099 | $1.45 | 7d | 1 | 0.30mi |
| 15229 Grappling Irons Ln Haslet, TX | 3.0 | 2.0 | 1451 | $2,049 | $1.41 | 44d | 1 | 0.31mi |
| 1349 Buckaroo Blvd Haslet, TX | 3.0 | 2.0 | 1474 | $2,100 | $1.42 | 24d | 1 | 0.31mi |
| 15244 Grappling Irons Ln Haslet, TX | 3.0 | 2.0 | 1522 | $2,119 | $1.39 | 7d | 1 | 0.31mi |
| 15248 Grappling Irons Ln Haslet, TX | 3.0 | 2.0 | 1451 | $2,059 | $1.42 | 7d | 1 | 0.32mi |
| 15241 Grappling Irons Ln Haslet, TX | 3.0 | 2.0 | 1451 | $2,099 | $1.45 | 44d | 1 | 0.32mi |
| 1304 Amapola Dr Haslet, TX | 3.0 | 2.0 | 1451 | $2,099 | $1.45 | 7d | 1 | 0.33mi |
| 15245 Grappling Irons Ln Haslet, TX | 4.0 | 2.0 | 1720 | $2,249 | $1.31 | 44d | 1 | 0.33mi |
| 15249 Grappling Irons Ln Haslet, TX | 3.0 | 2.0 | 1461 | $2,089 | $1.43 | 24d | 1 | 0.34mi |
| 15249 Grappling Irons Ln Haslet, TX | 3.0 | 2.0 | 1461 | $2,089 | $1.43 | 44d | 1 | 0.34mi |
| 1312 Amapola Dr Haslet, TX | 3.0 | 2.0 | 1451 | $2,099 | $1.45 | 15d | 1 | 0.34mi |
| 1316 Amapola Dr Haslet, TX | 3.0 | 2.0 | 1522 | $2,069 | $1.36 | 5d | 1 | 0.34mi |
| 1320 Amapola Dr Haslet, TX | 3.0 | 2.0 | 1461 | $2,089 | $1.43 | 15d | 1 | 0.35mi |
| 1324 Amapola Dr Haslet, TX | 4.0 | 2.0 | 1720 | $2,249 | $1.31 | 7d | 1 | 0.36mi |
| 1324 Amapola Dr Haslet, TX | 4.0 | 2.0 | 1720 | $2,249 | $1.31 | 5d | 1 | 0.36mi |
| 1328 Amapola Dr Haslet, TX | 3.0 | 2.0 | 1451 | $2,099 | $1.45 | 44d | 1 | 0.36mi |
| 1340 Amapola Dr Haslet, TX | 3.0 | 2.0 | 1461 | $2,089 | $1.43 | 24d | 1 | 0.38mi |
| 1340 Amapola Dr Haslet, TX | 3.0 | 2.0 | 1461 | $2,089 | $1.43 | 44d | 1 | 0.38mi |
| 952 Dustwood Dr Haslet, TX | 4.0 | 2.0 | 1838 | $2,470 | $1.34 | 24d | 1 | 0.49mi |
| 1413 Mustang Canyon Dr Haslet, TX | 4.0 | 2.0 | 1738 | $2,125 | $1.22 | 4d | 1 | 0.74mi |
| 14845 Gilley Ln Haslet, TX | 3.0 | 2.0 | 1844 | $2,395 | $1.30 | 44d | 1 | 0.75mi |
| 652 Ridgeback Trl Haslet, TX | 4.0 | 2.0 | 1841 | $2,350 | $1.28 | 24d | 1 | 0.77mi |
| 14805 Gilley Ln Haslet, TX | 3.0 | 2.0 | 1874 | $2,400 | $1.28 | 24d | 1 | 0.81mi |
| 14353 Snaffle Bit Trl Haslet, TX | 4.0 | 2.0 | 1664 | $1,919 | $1.15 | 44d | 1 | 0.82mi |
| 565 Pueblo Bonito Trl Haslet, TX | 3.0 | 2.0 | 1606 | $2,200 | $1.37 | 19d | 1 | 0.93mi |
| 1352 Barrel Run Haslet, TX | 3.0 | 2.0 | 1780 | $2,055 | $1.15 | 4d | 1 | 0.94mi |
| 14825 Dusty Boot Trl Haslet, TX | 3.0 | 2.0 | 1606 | $2,195 | $1.37 | 44d | 1 | 0.94mi |
| 1257 Barrel Run Haslet, TX | 3.0 | 2.0 | 1780 | $2,200 | $1.24 | 44d | 1 | 0.97mi |
| 14525 Bootes Dr Haslet, TX | 4.0 | 2.0 | 1659 | $2,300 | $1.39 | 2d | 1 | 1.03mi |
| 14144 Rabbit Brush Ln Haslet, TX | 3.0 | 2.0 | 1860 | $2,299 | $1.24 | 3d | 1 | 1.04mi |
| 14144 Rabbit Brush Ln Haslet, TX | 3.0 | 2.0 | 1860 | $2,299 | $1.24 | 11d | 1 | 1.04mi |
| 14420 Bootes Dr Haslet, TX | 4.0 | 2.0 | 1659 | $2,395 | $1.44 | 19d | 1 | 1.08mi |
HOA detail
- Monthly dues
- $40 · $480/yr
Listing history 4 events
-
2026-04-22status Pending
-
2026-04-08price $272,999
-
2026-04-07price $273,999
-
2026-03-10$278,999 Active
ⓘ Source: listings_history table (triggers on properties + properties_extension) + one-shot
backfill from property_details.listing_events for pre-trigger history.
Climate risk First Street
- Flood 1/10 Low FEMA zone X (unshaded) · 0% chance over 30 yrs
- Wildfire 7/10 Severe
- Heat 7/10 Severe 7 d/yr ≥109°F today · 22 d/yr by 30 yrs out
- Wind 6/10 Major 22% chance of damaging wind over 30 yrs
Nearby sold comps map
Loading sold comps map…
Walkable amenities ~0.75 mi
Loading nearby amenities…
Taxation est. · year 1
- Rental income
- $27,553
- − Mortgage interest
- −$15,292
- − Property taxes
- −$4,095
- − Insurance
- −$1,365
- − Repairs & maintenance
- −$2,204
- − Management
- −$2,204
- − HOA
- −$480
- − Depreciation
- −$7,942
- Taxable loss
- −$6,029
- Est. tax savings @ 24.0%
- +$1,447
- After-tax cash flow
- $94/yr
For passive investors: Depreciation is non-cash, so a rental often shows a tax loss while cash-flowing — sheltering income. Rental losses are passive: they offset passive income freely, and up to $25,000/yr can offset ordinary (W-2) income if you actively participate and your MAGI is under $100k (phasing out to $0 by $150k); unused losses carry forward. On sale, claimed depreciation is recaptured at up to 25%, and gains may owe capital-gains tax (a 1031 exchange can defer both). Figures are a year-1 estimate at your 24.0% rate — not tax advice; consult a CPA.
Condition & rehab AI · 1 photo
This single-family home requires extensive repairs and updates to its roof, exterior, foundation, HVAC, and interior systems. Significant structural and aesthetic improvements are needed to increase its resale and rental value.
Repairs flagged
- Major roof — Significant damage and potential leaks.
- Major exterior siding — Significant wear and tear.
- Major foundation — Visible cracks and wear.
- Major HVAC/air conditioning — No visible systems, likely in poor condition.
- Major interior walls/paint — No visible walls or paint, likely in poor condition.
- Major bathrooms — No visible bathrooms, likely in poor condition.
- Major kitchen — No visible kitchen, likely in poor condition.
- Major windows — No visible windows, likely in poor condition.
- Major landscaping — No visible landscaping, likely in poor condition.
Value-add opportunities
- Both roof repair and replacement — Critical to prevent water damage and improve the home's appearance.
- Both exterior siding repair and repainting — Improves curb appeal and structural integrity.
- Both foundation repair — Prevents further structural damage and improves safety.
- Both HVAC/air conditioning replacement — Improves comfort and energy efficiency.
- Both interior wall and paint repair — Improves the home's appearance and value.
- Both bathroom and kitchen updates — Improves functionality and aesthetic appeal.
- Both window replacement — Improves energy efficiency and safety.
- Both landscaping and curb appeal improvements — Enhances the home's curb appeal and value.
Renovation cost estimate screening
| Repair item | Severity | Est. cost |
|---|---|---|
| roof · Significant damage and potential leaks. | Major | $15,000–50,000 |
| exterior siding · Significant wear and tear. | Major | $15,000–50,000 |
| foundation · Visible cracks and wear. | Major | $15,000–50,000 |
| HVAC/air conditioning · No visible systems, likely in poor condition. | Major | $15,000–50,000 |
| interior walls/paint · No visible walls or paint, likely in poor condition. | Major | $15,000–50,000 |
| bathrooms · No visible bathrooms, likely in poor condition. | Major | $15,000–50,000 |
| kitchen · No visible kitchen, likely in poor condition. | Major | $15,000–50,000 |
| windows · No visible windows, likely in poor condition. | Major | $15,000–50,000 |
| landscaping · No visible landscaping, likely in poor condition. | Major | $15,000–50,000 |
| Total estimated repair cost · 9 items | $135,000–450,000 |
Value-add ROI direction
- Both roof repair and replacement — Critical to prevent water damage and improve the home's appearance. ↑
- Both exterior siding repair and repainting — Improves curb appeal and structural integrity. ↑
- Both foundation repair — Prevents further structural damage and improves safety. ↑
- Both HVAC/air conditioning replacement — Improves comfort and energy efficiency. ↑
- Both interior wall and paint repair — Improves the home's appearance and value. ↑
- Both bathroom and kitchen updates — Improves functionality and aesthetic appeal. ↑
- Both window replacement — Improves energy efficiency and safety. ↑
- Both landscaping and curb appeal improvements — Enhances the home's curb appeal and value. ↑
ⓘ Cost ranges are severity-bucket heuristics (US national rule-of-thumb). Get contractor quotes + a written scope before underwriting a rehab budget.
Schools (NCES district)
- District
- Northwest ISD
- NCES district ID
- 4833180
- Math proficiency
- 48% ▼ -15.00%
- Reading proficiency
- 52% ▼ -8.00%
- Median HH income
- $85,315
- Composite
- 46.15/100
- National rank
- #2504
- State rank
- #120 of 826 in TX
Livability — Fort Worth
- Score
- 80/100
- State rank
- #49
- US rank
- #1954
Category grades
Schools grade is shown separately in the Schools card above.
Census & demographics
- Census place
- Fort Worth, TX
- County
- Tarrant County · 2,033,669 people
- City population
- 911,619
- Metro
- Dallas-Fort Worth-Arlington, TX
- Population (ZIP)
- 34,249
- Household income
- $143,555
- Rent vs Own
- Severe rent burden
- 358.0
Population outlook (Denton County) Hauer SSP2
- Today (2025)
- 1,053,010 people
- By 2030
- 1,192,269 · +13.2%
- By 2040
- 1,472,920 · +39.9%
- By 2050
- 1,746,506 · +65.9%
- By 2075
- 2,358,497 · +124.0%
- By 2100
- 2,779,183 · +163.9%
Race, ethnicity, and origin ACS 2023
- Neighborhood character
- Predominantly White (66%)
- Race & ethnicity
- White 66% Hispanic / Latino 14% Two or more races 13% Black 11% Asian 4%
- Hispanic origin (detail)
- Mexican 7% Puerto Rican 2%
- Common ancestry
- Lithuanian 7% Slovak 4% Romanian 1%
- Foreign-born
- 7% · Canada, Vietnam
- Languages at home
- 88% English-only · Spanish 6% Vietnamese 2% Other Indo-European 1%
Political lean MEDSL · Denton
- 2024 margin
- R (+13.2) · D 42.7% · R 55.8% · Other 1.5%
- 2008→2024 swing
- +11.0pp toward D · 2008: -24.2pp · 2024: -13.2pp
- All cycles
- 2024: R+13.2 2020: R+8.1 2016: R+20.2 2012: R+31.7 2008: R+24.2
Not yet ingested
- Civics
- —
Market trends
- HPI YoY
- ▼ -78.77%
- Current HPI
- 235.7417
- Rent YoY
- ▲ 1.08%
- Metro
- Dallas-Fort Worth-Arlington, TX
- State GDP YoY
- ▲ 3.95%
- F500 in state
- 110
Industry mix (Fortune 500 HQ in TX)
| Industry | F500 HQs | Revenue |
|---|---|---|
| Energy | 16 | $1,198B |
|
||
| Technology | 5 | $198B |
|
||
| Engineering / Construction | 4 | $72B |
|
||
| Energy Services | 3 | $60B |
|
||
| Utilities | 3 | $41B |
|
||
| Healthcare | 2 | $330B |
|
||
Price history
-2.2% since first listed4 events — show timeline
- 2026-04-22 Pending — NTREIS
- 2026-04-08 Price Changed $272,999 NTREIS
- 2026-04-07 Price Changed $273,999 NTREIS
- 2026-03-10 Listed $278,999 NTREIS
Cash-flow waterfall
monthlySold comps — $/sqft
last 12 mo · ≤1 miLoading sold comps…