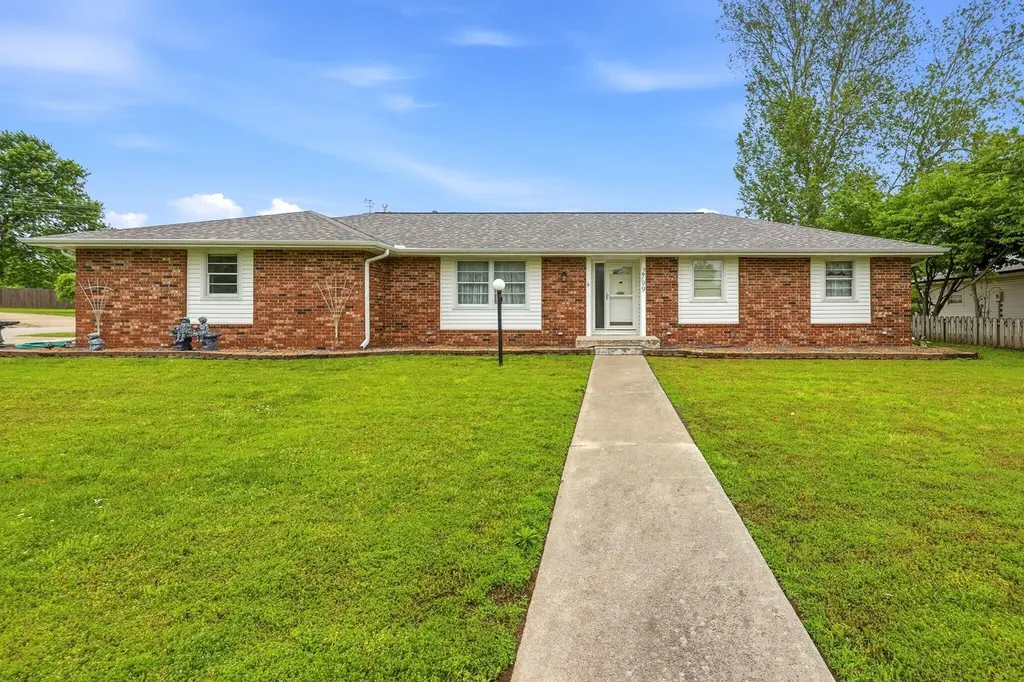
2799 W Camino Alto St · Springfield, MO
Flood risk 1/10 · Minimal
- FEMA flood zone
- X (unshaded)
- Chance of flooding over 30 yrs
- 0.0%
- Est. flood insurance / yr
- $507 – $1,088
Fire risk 1/10 · Minimal
- Est. fire insurance / yr
- $1,054 – $1,958
Heat risk 5/10 · Moderate
- Hot days now (above 105°F)
- 7 days/yr
- Hot days in 30 yrs
- 19 days/yr
Wind risk 2/10 · Minimal
- Chance of severe wind over 30 yrs
- 0.0%
Air-quality risk 1/10 · Minimal
- Unhealthy air days now
- 0 days/yr
- Unhealthy air days in 30 yrs
- 0 days/yr
Risk factors via First Street. Map © Google.
Why this score? — see what drove the D+ grade
The composite is a weighted blend of 9 inputs, each scored 0–100. Each bar is that input's sub-score; the figure is the points it added to the 100-point composite (weight × sub-score).
- ARV discount +15.0/15.0
- Cash flow +14.2/30.0
- DSCR +4.3/10.0
- Livability +3.8/5.0
- Schools +3.2/10.0
- Rent growth +3.1/5.0
- 1% rule +2.9/10.0
- Condition / age +2.5/5.0
- Appreciation +0.0/10.0
$290,000
🖨 Deal sheet 📄 Offer letter ✓ Due diligence
Listing remarks
Situated on a spacious corner lot in desirable South Springfield, this all-brick 4-bedroom, 2-bathroom home offers comfort, functionality, and an unbeatable location in the Kickapoo School District. Inside, you'll find a large formal dining room perfect for hosting gatherings, while the spacious living room features hardwood flooring, a cozy brick fireplace, and sliding glass doors leading to the back deck. The kitchen is equipped with warm wood cabinetry, stainless steel appliances, and a convenient breakfast nook that provides additional dining space. The home offers four generously sized bedrooms, including one with custom built-in cabinetry and shelving, making it an ideal home office,
Key facts
- Hardwood flooring
- Breakfast nook
- Formal dining room
Tags
Property features AI
Exterior
- Parking: 2-car garage with garage door opener (garage faces side)
- Utilities: Public water; Public sewer
- Home design: Single-family residence; One level
- Construction: Built with vinyl siding and brick; Composition roof
- Exterior features: Rain gutters; Deck; Partial wood fencing; Shed(s); Corner lot; Asphalt road frontage on a public, city-maintained street
Interior
- Kitchen: Gas oven; Free-standing gas oven; Dishwasher; Microwave
- Flooring: Carpet; Linoleum; Wood; Tile
- Bathrooms: 2 full bathrooms
- Heating & cooling: Natural gas heating with forced air; Central air; Ceiling fans
- Interior features: Storm windows; Wood-burning masonry fireplace in the living room; Disposal
- Laundry & utility: Main-level laundry; Laundry located in garage
Neighborhood map
What this means for you Summary
Snapshot
- This is a 4-bed/2.0-bath single-family listed at $290k.
Deal economics
- At list price, monthly cash flow is $49 ($585/yr) — positive.
- The deal already cash-flows at list — no discount required.
- To meet the 1% rule (rent ≥ 1% of price), the offer needs to be $229k (21.1% below list).
- Recommended offer: $229k (21.1% below list) — sets the bar for 1% rule.
- Cap rate 6.5% vs local median 4.6% in Springfield — top-decile yield for the area; either an underpriced asset or a hidden risk that comps aren't pricing in. Stress-test before assuming the spread holds.
Location & tenants
- Location reads 75/100 on livability (#57 in MO, #4,121 nationally) — a middle-class / working-renter tenant base. Strengths: commute A+, cost of living A+, housing A+; Watch: crime F, employment F.
- Springfield R-XII (urban): math 32% / reading 46% proficiency, ranked #174 of 324 in MO (top 54%) — families likely to look elsewhere, expect single-tenant / working-renter base with shorter leases.
- Zoned schools: Cherokee Middle (math 50% / reading 62%, grade B-, #40 of 391 statewide, top 10%, 758 students, 27% FRL); Kickapoo High (math 39% / reading 66%, grade C-, #89 of 521 statewide, top 17%, 1,881 students, 26% FRL) — zoned schools average 27% FRL vs 46% district-wide (20 pts lower); this property's tenant base skews higher-income than the district average.
- Zoned-school proficiency averages 54% at this address vs 39% district-wide (+15 pts) — the actual schools serving this property are materially stronger than the Springfield R-XII average implies; a family-tenant draw the district grade alone would hide.
- Market conditions: Rents rising (+2.5%/yr); 250 active listings in the ZIP; 4 comparable units currently listed for rent nearby; rentals at typical pace (median 24d on market — plan ~3-4 weeks tenant-placement turnaround); solid renter incomes; 1,302 units permitted in Greene County in 2024 (250 in 5+ unit buildings).
Forward outlook
- Local home prices are declining (-3.0%/yr); year-one equity from $2k of loan paydown is wiped out by about $9k of value loss. Plan a longer hold.
- Greene County population projected at +25% by 2050 — long-run rental-demand tailwind backs the buy-and-hold thesis.
Negotiation context
- It's been on market 27 days — a 2% lower offer ($286k) is reasonable based on typical stale-listing flexibility.
Risks & watch-outs
- Climate carrying-cost: extreme-heat days projected 7→19/yr by 2055 (HVAC capex compounding) — expect insurance premiums to compound above CPI over the hold.
Questions for the listing agent
- Built in 1974 — when were the roof, HVAC, electrical panel, plumbing, and water heater last replaced?
- Is there a deadline driving the sale (1031 exchange, divorce, estate, relocation)? That informs how much negotiation room exists.
- Crime grade is F in this area — have there been break-ins, vandalism, or insurance claims at this property in the last 3 years? What carrier currently insures it and at what premium?
- The area grade is low — what's the realistic commute time and amenity access for the typical tenant pool here? Any planned neighborhood developments (good or bad) we should know about?
- What's the average days-on-market for RENTAL listings here right now (not sales)? A rising rental-DOM trend means longer vacancies and softer asking-rent achievability than the comps imply.
- What's the recent tenant-quality profile in this submarket — average credit score on applications, eviction rate, late-payment / NSF rate, and stable-employment percentage? A property-management company in the area should have these aggregated.
- How much new for-sale + rental construction is in the pipeline within 1–3 miles? Heavy new supply typically softens prices + rents 12–24 months out; constrained supply supports both.
Investment metrics
- 1% rule
- 0.79% ✗
- Cap rate
- 6.49%
- Cash-on-cash
- 0.72%
- DSCR
- 1.03
- GRM
- 10.6
CMA / ARV
- ARV (on-the-fly)
- $363,636
- Comps found
- 12
Show comp detail 12 sales within ~0.75 mi
| Address | Dist | Beds/Ba | Sqft | Sold | Price | $/sf | Match |
|---|---|---|---|---|---|---|---|
| 2759 W Buena Vista St | 0.09mi | 4/2.0 | 1,774 (-8%) | 2mo | $234,900 | $132 | 81 |
| 4445 S Farm Road 137 | 0.17mi | 3/2.5 (-1) | 1,877 (-2%) | 2mo | $250,000 | $133 | 79 |
| 2725 W Camino Alto St | 0.13mi | 4/2.0 | 2,151 (+12%) | 2mo | $255,000 | $119 | 73 |
| 3277 W Cardinal St | 0.54mi | 4/2.0 | 1,993 (+4%) | 1mo | $377,900 | $190 | 68 |
| 4442 S Appleton Dr | 0.55mi | 4/2.0 | 1,854 (-4%) | 1mo | $395,000 | $213 | 68 |
| 4715 S Wildwood Dr | 0.36mi | 4/2.0 | 2,108 (+10%) | 2mo | $260,000 | $123 | 66 |
| 2983 W Teton Dr | 0.65mi | 3/2.0 (-1) | 1,920 (-0%) | 1mo | $440,000 | $229 | 64 |
| 2482 W Camino Alto St | 0.36mi | 4/2.5 | 2,200 (+14%) | 0mo | $445,900 | $203 | 57 |
| 3914 S Leroy Ct | 0.75mi | 3/2.0 (-1) | 1,959 (+2%) | 2mo | $339,900 | $174 | 56 |
| 2782 W Lasalle St | 0.61mi | 3/2.0 (-1) | 1,750 (-9%) | 0mo | $289,900 | $166 | 51 |
| 3039 W Teton Dr | 0.67mi | 3/2.5 (-1) | 2,117 (+10%) | 2mo | $399,995 | $189 | 43 |
| 4530 S Shady Lane Ct | 0.74mi | 3/2.0 (-1) | 1,710 (-11%) | 1mo | $339,900 | $199 | 41 |
Match score weights: distance 35% · size 25% · config 20% · recency 20%. Top-matched comps best support the ARV.
Projected returns pro-forma
-3.0% appreciation · 2.53% rent growth · sell at horizon
- IRR
- -15.7%
- Equity multiple
- 0.44×
- Total profit
- $-45,078
- Equity at exit
- $43,240
- IRR
- -8.0%
- Equity multiple
- 0.51×
- Total profit
- $-40,102
- Equity at exit
- $25,074
Cash invested: $81,200 (down + closing). Projections, not guarantees.
Landlord ↔ Tenant lean methodology
- Overall (STATE)
- 81 Strongly Landlord-Friendly
- State Missouri
- 81 Strongly Landlord-Friendly · R+10
- County
- — inherits STATE
- City
- — inherits STATE
ZIP-level market 65810
- Home prices YoY
- -28.8%
- Rents YoY
- 2.5%
- Active inventory
- 250
- Price-to-rent
- 10.6×
Monthly cashflow live
- Estimated rent
- $2,289 medium interval (Pro) →
- Mortgage (P&I)
- −$1,521
- Tax from tax record
- −$118 /mo · $1,419/yr
- Insurance
- −$121
- HOA
- −$0
- Vacancy / Maint / Mgmt
- −$481
- Net cashflow
- $49
Break-even live
UW: 25.0% down · 7.5% · 30yr · 1.5% tax · 5.0% vac · 8.0% maint · 8.0% mgmt
Financing live
Cash to close
- Down payment
- $72,500
- Closing costs
- $8,700
- Reserves months
- —
- Total cash needed
- —
Loan-product check · same deal, 3 products live
Conventional
25% down · 7.5% · 30yr
- Down + closing
- —
- Monthly P&I
- —
- Monthly cashflow
- —
- DSCR
- —
- Eligible?
- —
Personal DTI + credit; lowest rate.
DSCR
20% down · 8.5% · 30yr
- Down + closing
- —
- Monthly P&I
- —
- Monthly cashflow
- —
- DSCR
- —
- Eligible?
- —
No personal income docs; deal must DSCR.
Hard money
10% down · 12.0% · 12mo
- Down + closing
- —
- Monthly P&I
- —
- Monthly cashflow
- —
- DSCR
- —
- Eligible?
- —
Short-term bridge; refi at stabilization.
Rent comps 4 comps
| Address | Beds | Baths | Sqft | Rent | $/sqft | DOM | Units | Dist |
|---|---|---|---|---|---|---|---|---|
| 2556 W Cardinal St Springfield, MO | 4.0 | 2.0 | 2009 | $2,295 | $1.14 | 13d | 1 | 0.32mi |
| 2183 W Arlington St Springfield, MO | 3.0 | 2.0 | 1850 | $1,995 | $1.08 | 23d | 1 | 1.10mi |
| 3891 S Hillsdale Ave Springfield, MO | 4.0 | 2.0 | 1662 | $1,995 | $1.20 | 23d | 1 | 1.34mi |
| 3462 S Doris Ave Springfield, MO | 3.0 | 2.0 | 1503 | $1,595 | $1.06 | 44d | 1 | 1.35mi |
Listing history 15 events
-
2026-06-18days on market $290,000 Active 27 DOM
-
2026-06-17days on market $290,000 Active 26 DOM
-
2026-06-16days on market $290,000 Active 25 DOM
-
2026-06-15days on market $290,000 Active 24 DOM
-
2026-06-14days on market $290,000 Active 22 DOM
-
2026-06-10days on market $290,000 Active 19 DOM
-
2026-06-09days on market $290,000 Active 18 DOM
-
2026-06-08days on market $290,000 Active 17 DOM
-
2026-06-07days on market $290,000 Active 16 DOM
-
2026-06-03days on market $290,000 Active 12 DOM
-
2026-06-02days on market $290,000 Active 11 DOM
-
2026-06-01days on market $290,000 Active 10 DOM
-
2026-05-31days on market $290,000 Active 9 DOM
-
2026-05-30days on market $290,000 Active 8 DOM
-
2026-05-22$290,000 Active
ⓘ Source: listings_history table (triggers on properties + properties_extension) + one-shot
backfill from property_details.listing_events for pre-trigger history.
Tax reassessment forecast MO · Resets to sale price
- Current annual tax
- $1,419 · $118/mo
- Projected year-2 tax
- $2,813 · $234/mo
- Expected delta
- +$1,394/yr (+$116/mo · 98.2%)
ⓘ Screening estimate from a state-policy table — verify with the county assessor before closing.
Climate risk First Street
- Flood 1/10 Low FEMA zone X (unshaded) · 0% chance over 30 yrs
- Wildfire 1/10 Low
- Heat 5/10 Major 7 d/yr ≥105°F today · 19 d/yr by 30 yrs out
- Wind 2/10 Low 0% chance of damaging wind over 30 yrs
- Air quality 1/10 Low 0 unhealthy d/yr today · 0 by 30 yrs out
Nearby sold comps map
Loading sold comps map…
Walkable amenities ~0.75 mi
Loading nearby amenities…
Taxation est. · year 1
- Rental income
- $27,473
- − Mortgage interest
- −$16,245
- − Property taxes
- −$1,419
- − Insurance
- −$1,450
- − Repairs & maintenance
- −$2,198
- − Management
- −$2,198
- − Depreciation
- −$8,436
- Taxable loss
- −$4,472
- Est. tax savings @ 24.0%
- +$1,073
- After-tax cash flow
- $1,659/yr
For passive investors: Depreciation is non-cash, so a rental often shows a tax loss while cash-flowing — sheltering income. Rental losses are passive: they offset passive income freely, and up to $25,000/yr can offset ordinary (W-2) income if you actively participate and your MAGI is under $100k (phasing out to $0 by $150k); unused losses carry forward. On sale, claimed depreciation is recaptured at up to 25%, and gains may owe capital-gains tax (a 1031 exchange can defer both). Figures are a year-1 estimate at your 24.0% rate — not tax advice; consult a CPA.
Schools (NCES district)
- District
- Springfield R-XII
- NCES district ID
- 2928860
- Math proficiency
- 32% ▼ -2.00%
- Reading proficiency
- 46% ▼ -3.00%
- Median HH income
- $37,886
- Composite
- 32.45/100
- National rank
- #5717
- State rank
- #174 of 324 in MO
Livability — Springfield
- Score
- 75/100
- State rank
- #57
- US rank
- #4121
Category grades
Schools grade is shown separately in the Schools card above.
Census & demographics
- County
- Greene County · 244,327 people
- City population
- 223,044
- Metro
- Springfield, MO
- Population (ZIP)
- 22,137
- Household income
- $95,160
- Rent vs Own
- Severe rent burden
- 437.0
Population outlook (Greene County) Hauer SSP2
- Today (2025)
- 319,054 people
- By 2030
- 335,135 · +5.0%
- By 2040
- 366,186 · +14.8%
- By 2050
- 397,431 · +24.6%
- By 2075
- 477,035 · +49.5%
- By 2100
- 520,828 · +63.2%
Race, ethnicity, and origin ACS 2023
- Neighborhood character
- Predominantly White (89%)
- Race & ethnicity
- White 89% Two or more races 4% Hispanic / Latino 3% Asian 3% Black 2%
- Common ancestry
- Italian 4% Lithuanian 3% Portuguese 3%
- Foreign-born
- 4% · Vietnam, China, Canada
- Languages at home
- 95% English-only · Other Indo-European 1% Spanish 1% Chinese 1%
Political lean MEDSL · Greene
- 2024 margin
- Strong R (+20.8) · D 38.9% · R 59.7% · Other 1.4%
- 2008→2024 swing
- -5.0pp toward R · 2008: -15.8pp · 2024: -20.8pp
- All cycles
- 2024: R+20.8 2020: R+20.1 2016: R+27.4 2012: R+24.4 2008: R+15.8
Not yet ingested
- Civics
- —
Market trends
- HPI YoY
- ▼ -78.67%
- Current HPI
- 194.8736
- Rent YoY
- ▲ 2.53%
- Metro
- Springfield, MO
- State GDP YoY
- ▲ 1.84%
- F500 in state
- 20
Industry mix (Fortune 500 HQ in MO)
| Industry | F500 HQs | Revenue |
|---|---|---|
| Healthcare | 1 | $163B |
|
||
| Insurance | 1 | $21B |
|
||
| Industrial Technology | 1 | $17B |
|
||
| Retail | 1 | $16B |
|
||
| Industrial Distribution | 1 | $10B |
|
||
| Utilities | 1 | $9B |
|
||
Price history
1 event — show timeline
- 2026-05-22 Listed $290,000 SOMO
Property tax history
+3.2%/yrLatest (2025): $1,419 · +7.5% YoY. Source: county tax records.
Cash-flow waterfall
monthlySold comps — $/sqft
last 12 mo · ≤1 miLoading sold comps…