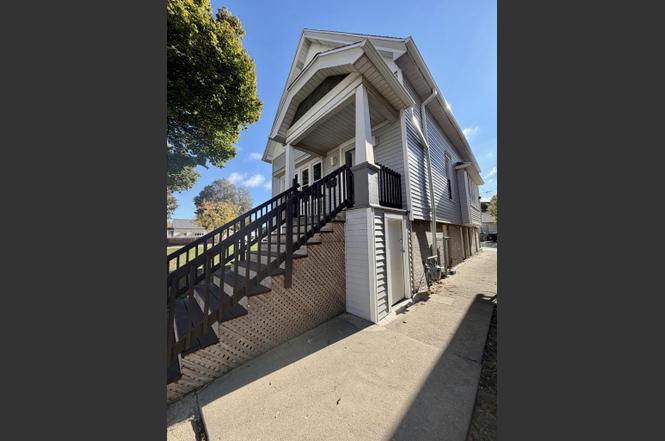
1813 W Burnham St · Milwaukee, WI
Flood risk 6/10 · Moderate
- FEMA flood zone
- X (unshaded)
- Chance of flooding over 30 yrs
- 0.72%
- Est. flood insurance / yr
- $473 – $860
Fire risk 1/10 · Minimal
- Est. fire insurance / yr
- $636 – $1,182
Heat risk 2/10 · Minimal
- Hot days now (above 97°F)
- 7 days/yr
- Hot days in 30 yrs
- 13 days/yr
Wind risk 2/10 · Minimal
- Chance of severe wind over 30 yrs
- —
Air-quality risk 3/10 · Minor
- Unhealthy air days now
- 3 days/yr
- Unhealthy air days in 30 yrs
- 3 days/yr
Risk factors via First Street. Map © Google.
Why this score? — see what drove the C+ grade
The composite is a weighted blend of 9 inputs, each scored 0–100. Each bar is that input's sub-score; the figure is the points it added to the 100-point composite (weight × sub-score).
- Cash flow +17.8/30.0
- ARV discount +12.9/15.0
- Appreciation +10.0/10.0
- DSCR +5.6/10.0
- 1% rule +4.8/10.0
- Livability +4.0/5.0
- Rent growth +3.0/5.0
- Condition / age +2.5/5.0
- Schools +1.2/10.0
$198,900
🖨 Deal sheet (PDF) 📄 Offer letter ✓ Due diligence
Listing remarks
Welcome to 1813 W Burnham Street -- a beautifully updated former duplex now converted into a spacious single-family home. This 5-bedroom, 1-bath property features brand-new luxury plank flooring and fresh carpet throughout. Enjoy peace of mind with new siding, a newer roof, and a brand-new furnace -- all the major updates are already done for you. The home offers plenty of space for family, work, or entertaining, and is completely move-in ready. Conveniently located near parks, schools, and local amenities. Highlights: 5 bedrooms, 1 bathroom Former duplex converted into a single-family home Brand-new furnace New siding and newer roof (approximately 2 years old) All-new plank flooring and c
Key facts
- Move-in ready
- New siding
- Newer roof
Tags
Property features AI
Finance
- Other: Fridge and stove included in the sale
Exterior
- Utilities: Municipal water; Natural gas
- Home design: Two-story single-family home; Residential zoning
- Construction: Assessor/public record for year built
- Exterior features: Vinyl exterior; Lot less than 1/2 acre
Interior
- Kitchen: Range; Refrigerator
- Bedrooms: Bedroom 2 — 12 x 12 (Main level); Bedroom 3 — 12 x 15 (Main level); Bedroom 4 — 12 x 15 (Lower level); Bedroom 5 — 12 x 16 (Lower level)
- Bathrooms: Full bathroom with ceramic tile and shower over tub
- Heating & cooling: Radiant / hot water heating (natural gas)
- Interior features: Living room (25 x 14); No basement (slab foundation)
Neighborhood map
What this means for you Summary
Snapshot
- This is a 5-bed/1.0-bath single-family listed at $199k.
Deal economics
- At list price, monthly cash flow is $162 ($2k/yr) — positive.
- The deal already cash-flows at list — no discount required.
- To meet the 1% rule (rent ≥ 1% of price), the offer needs to be $195k (2.2% below list).
- Recommended offer: $187k (6.0% below list) — sets the bar for market timing.
- Cap rate 7.3% vs local median 5.1% in Milwaukee — top-decile yield for the area; either an underpriced asset or a hidden risk that comps aren't pricing in. Stress-test before assuming the spread holds.
Location & tenants
- Location reads 81/100 on livability (#55 in WI, #1,534 nationally) — a professional / high-income tenant draw. Strengths: amenities A+, commute A+, cost of living A+; Watch: employment D+, schools F, crime F.
- Milwaukee School District (urban): math 10% / reading 18% proficiency, ranked #337 of 342 in WI (top 98%) — low school quality limits family demand, transient renter base, plan for 1-2y turnover; 77% free/reduced lunch — lower-income household profile, screen leases tightly.
- Market conditions: Rents rising (+2.0%/yr); 55 active listings in the ZIP; 1,017 units permitted in Milwaukee County in 2024 (803 in 5+ unit buildings).
- At $1,945/mo this rent would consume 51% of the median local household income ($46k/yr) (locally 2357% of renters already pay >50% of income on rent) — very limited rent-growth headroom before tenants either downsize or default.
Forward outlook
- In year one you build about $21k of equity ($1k loan paydown + $20k appreciation (10.0% local appreciation)).
- Milwaukee County population projected at +4% by 2050 — modest demand growth; plan on rents tracking national, not racing it.
- At projected returns (10.0% appreciation + 2.0% rent growth), your $56k cash investment doubles in ~3 years — after that, you're playing with house money.
- By year 2, paydown + projected appreciation supports a ~$34k cash-out refi (75% LTV) — recoverable capital for the next deal without selling this one.
Negotiation context
- It's been on market 78 days — a 6% lower offer ($187k) is reasonable based on typical stale-listing flexibility.
Risks & watch-outs
- Watch-outs: built in 1900 — expect roof / HVAC / electrical / plumbing capex.
- Climate carrying-cost: major flood risk — expect insurance premiums to compound above CPI over the hold.
Questions for the listing agent
- It's been on market 78 days. Have you received any prior offers? Is the seller open to a 6% concession, seller financing, or rate buy-down credit?
- Built in 1900 — when were the roof, HVAC, electrical panel, plumbing, and water heater last replaced?
- Why hasn't it sold? Are there any deal-killer items the seller is aware of (foundation, flood, title, zoning, code violations)?
- Is there a deadline driving the sale (1031 exchange, divorce, estate, relocation)? That informs how much negotiation room exists.
- Schools are F-rated, which usually means shorter tenancies and higher turnover. Who's the typical renter profile here, and what's been the actual vacancy rate?
- Crime grade is F in this area — have there been break-ins, vandalism, or insurance claims at this property in the last 3 years? What carrier currently insures it and at what premium?
- What's the average days-on-market for RENTAL listings here right now (not sales)? A rising rental-DOM trend means longer vacancies and softer asking-rent achievability than the comps imply.
- What's the recent tenant-quality profile in this submarket — average credit score on applications, eviction rate, late-payment / NSF rate, and stable-employment percentage? A property-management company in the area should have these aggregated.
- How much new for-sale + rental construction is in the pipeline within 1–3 miles? Heavy new supply typically softens prices + rents 12–24 months out; constrained supply supports both.
Investment metrics
- 1% rule
- 0.98% ✗
- Cap rate
- 7.27%
- Cash-on-cash
- 3.49%
- DSCR
- 1.16
- GRM
- 8.5
CMA / ARV
- ARV (on-the-fly)
- $225,920
- Comps found
- 12
Show comp detail 12 sales within ~0.75 mi
| Address | Dist | Beds/Ba | Sqft | Sold | Price | $/sf | Match |
|---|---|---|---|---|---|---|---|
| 2045 S 15th Pl | 0.26mi | 4/2.0 (-1) | 1,835 (+4%) | 3mo | $200,000 | $109 | 70 |
| 2402 S 20th St | 0.63mi | 5/2.0 | 1,764 (-0%) | 1mo | $225,000 | $128 | 66 |
| 1579 S 21st St | 0.36mi | 4/3.0 (-1) | 1,792 (+2%) | 6mo | $250,000 | $140 | 63 |
| 1302 S 21st St | 0.58mi | 4/1.0 (-1) | 1,638 (-7%) | 0mo | $111,000 | $68 | 56 |
| 2026 S 14th St | 0.37mi | 4/2.0 (-1) | 1,870 (+6%) | 11mo | $235,000 | $126 | 54 |
| 1963 S 20th St | 0.15mi | 4/2.0 (-1) | 2,000 (+13%) | 11mo | $270,000 | $135 | 53 |
| 1642 S Layton Blvd | 0.63mi | 4/1.0 (-1) | 1,657 (-6%) | 3mo | $135,000 | $81 | 53 |
| 2604 W Lincoln Ave | 0.72mi | 5/2.0 | 1,893 (+7%) | 7mo | $250,000 | $132 | 44 |
| 2054 S 29th St | 0.75mi | 4/2.0 (-1) | 1,900 (+8%) | 3mo | $245,000 | $129 | 41 |
| 1139 S 23rd St | 0.72mi | 4/1.5 (-1) | 1,866 (+6%) | 11mo | $160,000 | $86 | 41 |
| 2122 S 24th St | 0.47mi | 5/3.0 | 1,500 (-15%) | 12mo | $240,000 | $160 | 35 |
| 2143 S Layton Blvd | 0.69mi | 4/3.0 (-1) | 1,994 (+13%) | 1mo | $200,000 | $100 | 32 |
Match score weights: distance 35% · size 25% · config 20% · recency 20%. Top-matched comps best support the ARV.
Projected returns pro-forma
10.0% appreciation · 2.0% rent growth · sell at horizon
- IRR
- 26.4%
- Equity multiple
- 3.10×
- Total profit
- $116,739
- Equity at exit
- $179,185
- IRR
- 22.9%
- Equity multiple
- 6.96×
- Total profit
- $331,945
- Equity at exit
- $386,419
Cash invested: $55,692 (down + closing). Projections, not guarantees.
Landlord ↔ Tenant lean methodology
- Overall (STATE)
- 73 Landlord-Friendly
- State Wisconsin
- 73 Landlord-Friendly · R+2
- County
- — inherits STATE
- City
- — inherits STATE
ZIP-level market 53204
- Home prices YoY
- 19.0%
- Rents YoY
- 2.0%
- Active inventory
- 55
- Price-to-rent
- 8.5×
Monthly cashflow live
- Estimated rent
- $1,945 medium interval (Pro) →
- Mortgage (P&I)
- −$1,043
- Tax est. 1.5%
- −$249 /mo · $2,984/yr
- Insurance
- −$83
- HOA
- −$0
- Vacancy / Maint / Mgmt
- −$408
- Net cashflow
- $162
Break-even live
Sensitivity live
| Price | -10% $300 | -5% $231 | +0% $162 | +5% $93 | +10% $25 |
|---|---|---|---|---|---|
| Rent | -10% $8 | -5% $85 | +0% $162 | +5% $239 | +10% $316 |
| Rate | -1.0pp $262 | -0.5pp $213 | base $162 | +0.5pp $111 | +1.0pp $58 |
UW: 25.0% down · 7.5% · 30yr · 1.5% tax · 5.0% vac · 8.0% maint · 8.0% mgmt
Financing live
Cash to close
- Down payment
- $49,725
- Closing costs
- $5,967
- Reserves months
- —
- Total cash needed
- —
Loan-product check · same deal, 3 products live
Conventional
25% down · 7.5% · 30yr
- Down + closing
- —
- Monthly P&I
- —
- Monthly cashflow
- —
- DSCR
- —
- Eligible?
- —
Personal DTI + credit; lowest rate.
DSCR
20% down · 8.5% · 30yr
- Down + closing
- —
- Monthly P&I
- —
- Monthly cashflow
- —
- DSCR
- —
- Eligible?
- —
No personal income docs; deal must DSCR.
Hard money
10% down · 12.0% · 12mo
- Down + closing
- —
- Monthly P&I
- —
- Monthly cashflow
- —
- DSCR
- —
- Eligible?
- —
Short-term bridge; refi at stabilization.
Listing history 4 events
-
2026-04-29status Pending
-
2026-04-16price $198,900
-
2026-03-31price $199,900
-
2026-02-10$209,990 Active
ⓘ Source: listings_history table (triggers on properties + properties_extension) + one-shot
backfill from property_details.listing_events for pre-trigger history.
Climate risk First Street
- Flood 6/10 Major FEMA zone X (unshaded) · 72% chance over 30 yrs
- Wildfire 1/10 Low
- Heat 2/10 Low 7 d/yr ≥97°F today · 13 d/yr by 30 yrs out
- Wind 2/10 Low
- Air quality 3/10 Moderate 3 unhealthy d/yr today · 3 by 30 yrs out
Nearby sold comps map
Loading sold comps map…
Walkable amenities ~0.75 mi
Loading nearby amenities…
Taxation est. · year 1
- Rental income
- $23,341
- − Mortgage interest
- −$11,141
- − Property taxes
- −$2,984
- − Insurance
- −$994
- − Repairs & maintenance
- −$1,867
- − Management
- −$1,867
- − Depreciation
- −$5,786
- Taxable loss
- −$1,299
- Est. tax savings @ 24.0%
- +$312
- After-tax cash flow
- $2,256/yr
For passive investors: Depreciation is non-cash, so a rental often shows a tax loss while cash-flowing — sheltering income. Rental losses are passive: they offset passive income freely, and up to $25,000/yr can offset ordinary (W-2) income if you actively participate and your MAGI is under $100k (phasing out to $0 by $150k); unused losses carry forward. On sale, claimed depreciation is recaptured at up to 25%, and gains may owe capital-gains tax (a 1031 exchange can defer both). Figures are a year-1 estimate at your 24.0% rate — not tax advice; consult a CPA.
Schools (NCES district)
- District
- Milwaukee School District
- NCES district ID
- 5509600
- Math proficiency
- 10% ▼ -5.00%
- Reading proficiency
- 18% ▬ 0.00%
- Median HH income
- $36,339
- Composite
- 11.61/100
- National rank
- #9696
- State rank
- #337 of 342 in WI
Livability — Milwaukee
- Score
- 81/100
- State rank
- #55
- US rank
- #1534
Category grades
Schools grade is shown separately in the Schools card above.
Census & demographics
- Census place
- Milwaukee, WI
- County
- Milwaukee County · 926,379 people
- City population
- 573,768
- Metro
- Milwaukee-Waukesha, WI
- Population (ZIP)
- 39,996
- Household income
- $45,934
- Rent vs Own
- Severe rent burden
- 2357.0
Population outlook (Milwaukee County) Hauer SSP2
- Today (2025)
- 995,758 people
- By 2030
- 1,009,124 · +1.3%
- By 2040
- 1,028,128 · +3.3%
- By 2050
- 1,040,066 · +4.4%
- By 2075
- 1,057,849 · +6.2%
- By 2100
- 1,039,774 · +4.4%
Race, ethnicity, and origin ACS 2023
- Neighborhood character
- Predominantly Hispanic (68%)
- Race & ethnicity
- Hispanic / Latino 68% Two or more races 35% White 15% Black 11% Asian 3% Native American 1%
- Hispanic origin (detail)
- Mexican 51% Puerto Rican 13%
- Common ancestry
- Romanian 3% Portuguese 1% Lithuanian 1%
- Foreign-born
- 28% · Canada
- Languages at home
- 35% English-only · Spanish 61% Other Asian/Pacific 1%
Political lean MEDSL · Milwaukee
- 2024 margin
- Solid D (+38.5) · D 68.3% · R 29.8% · Other 1.8%
- 2008→2024 swing
- +2.7pp toward D · 2008: 35.9pp · 2024: 38.5pp
- All cycles
- 2024: D+38.5 2020: D+39.9 2016: D+37.5 2012: D+34.6 2008: D+35.9
Not yet ingested
- Civics
- —
Market trends
- HPI YoY
- ▲ 64.27%
- Current HPI
- 403.236
- Rent YoY
- ▲ 2.00%
- Metro
- Milwaukee-Waukesha, WI
- State GDP YoY
- ▲ 2.10%
- F500 in state
- 20
Industry mix (Fortune 500 HQ in WI)
| Industry | F500 HQs | Revenue |
|---|---|---|
| Industrial Machinery | 4 | $23B |
|
||
| Industrial Technology | 2 | $36B |
|
||
| Insurance | 1 | $36B |
|
||
| Professional Services | 1 | $19B |
|
||
| Utilities | 1 | $9B |
|
||
| Consumer Goods | 1 | $3B |
|
||
Price history
-5.3% since first listed4 events — show timeline
- 2026-04-29 Pending — METROMLS
- 2026-04-16 Price Changed $198,900 METROMLS
- 2026-03-31 Price Changed $199,900 METROMLS
- 2026-02-10 Listed $209,990 METROMLS
Cash-flow waterfall
monthlySold comps — $/sqft
last 12 mo · ≤1 miLoading sold comps…