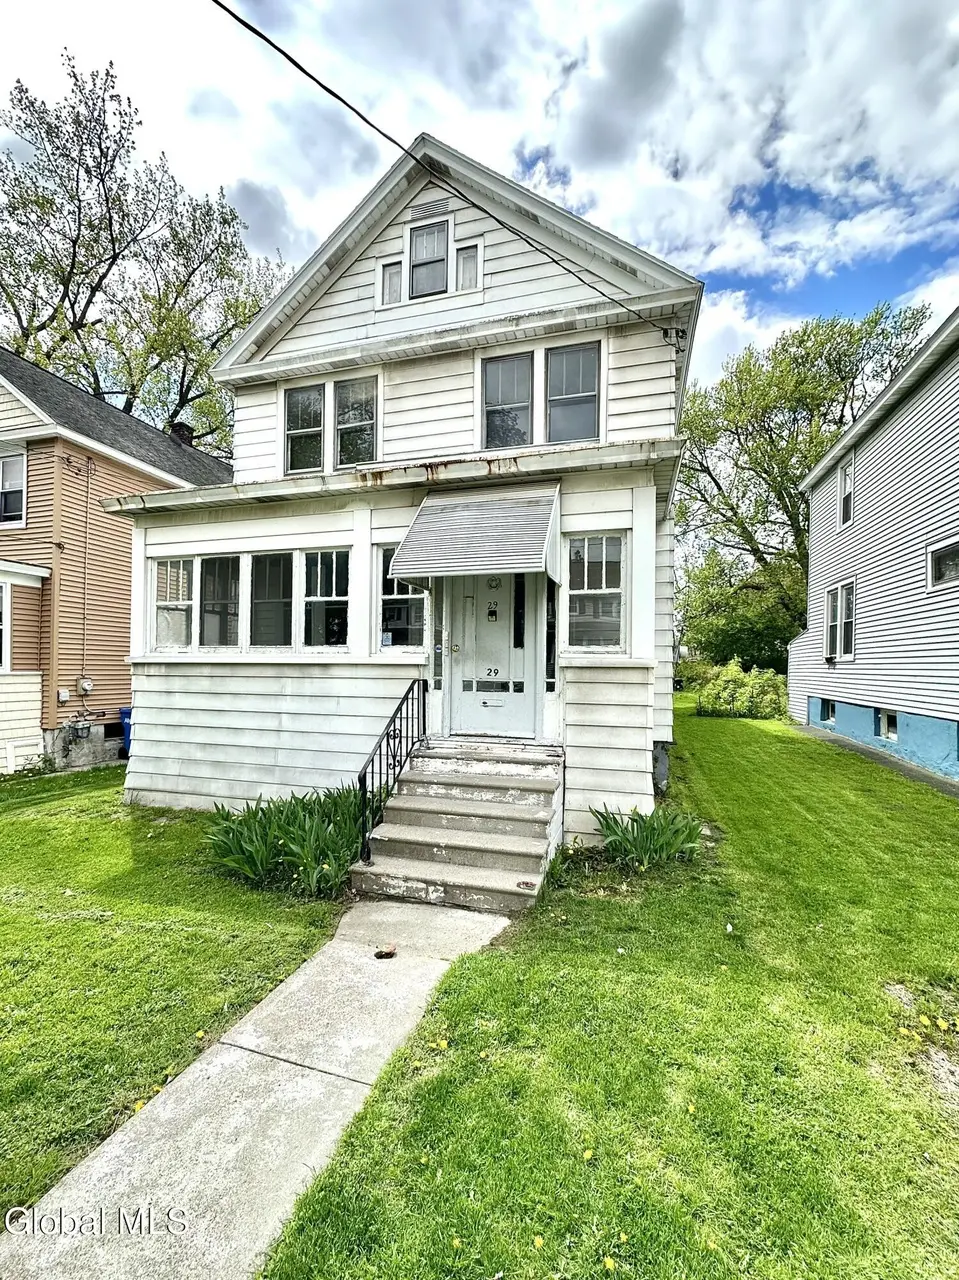
29 Bogart Ter · Albany, NY
Flood risk 1/10 · Minimal
- FEMA flood zone
- X (unshaded)
- Chance of flooding over 30 yrs
- 0.0%
- Est. flood insurance / yr
- $473 – $860
Fire risk 2/10 · Minimal
- Est. fire insurance / yr
- $691 – $1,283
Heat risk 4/10 · Minor
- Hot days now (above 99°F)
- 7 days/yr
- Hot days in 30 yrs
- 16 days/yr
Wind risk 3/10 · Minor
- Chance of severe wind over 30 yrs
- 6.0%
Air-quality risk 1/10 · Minimal
- Unhealthy air days now
- 0 days/yr
- Unhealthy air days in 30 yrs
- 0 days/yr
Risk factors via First Street. Map © Google.
Why this score? — see what drove the B+ grade
The composite is a weighted blend of 9 inputs, each scored 0–100. Each bar is that input's sub-score; the figure is the points it added to the 100-point composite (weight × sub-score).
- Cash flow +22.4/30.0
- ARV discount +15.0/15.0
- Appreciation +10.0/10.0
- 1% rule +8.3/10.0
- DSCR +7.2/10.0
- Rent growth +4.7/5.0
- Livability +4.0/5.0
- Schools +3.2/10.0
- Condition / age +2.5/5.0
$150,000
🖨 Deal sheet 📄 Offer letter ✓ Due diligence
Listing remarks
Opportunity awaits on Bogart Terrace - and with these bones, the possibilities are endless! Some updating and TLC can bring this hidden back to life, either for the owner occupant or seasoned investor. Character remains throughout with french doors, wood floors, and ample built-in storage. Gut and renovate the kitchen to expand the footprint. First floor bedroom, laundry, and full bathroom provide space to age in place, or for the multi-generational family. Upstairs you'll find three more spacious bedrooms, with access to the attic. A large bathroom upstairs can easily convert into a shower/tub combo, or restore the beautiful soaking tub currently in place. .. for the ''spa experience'' in
Key facts
- Wood floors
- French doors
- Easy access to 787
Tags
Property features AI
Exterior
- Parking: Driveway with space for 1 vehicle
- Utilities: Electric service with fuses; Public water; Public sewer
- Home design: Single-family residence; Fixer condition
- Construction: Aluminum siding; Block foundation; Shingle (asphalt) roof
- Exterior features: Covered front porch; Wood and chain-link fencing
Interior
- Kitchen: Gas oven; Refrigerator
- Bedrooms: First-floor bedroom; Second-floor bedroom; Second-floor bedroom; Second-floor bedroom
- Flooring: Hardwood
- Bathrooms: Two full bathrooms (one on the first floor, one on the second floor)
- Heating & cooling: Hot water heating (natural gas); Window air conditioning units
- Interior features: Unfinished basement; 10 total rooms; Hardwood floors
- Laundry & utility: First-floor laundry room; Washer/Dryer included
Neighborhood map
What this means for you Summary
Snapshot
- This is a 4-bed/2.0-bath single-family listed at $150k.
Deal economics
- At list price, monthly cash flow is $249 ($3k/yr) — positive.
- The deal already cash-flows at list — no discount required.
- Meets the 1% rule at list price ($2k rent vs $150k).
- Cap rate 8.3% vs local median 5.7% in Albany — top-decile yield for the area; either an underpriced asset or a hidden risk that comps aren't pricing in. Stress-test before assuming the spread holds.
Location & tenants
- Location reads 79/100 on livability (#129 in NY, #2,083 nationally) — a middle-class / working-renter tenant base. Strengths: amenities A+, commute A+, housing A+; Watch: employment C-, crime F.
- Albany City School District (urban): math 37% / reading 40% proficiency, ranked #543 of 590 in NY (top 92%) — families likely to look elsewhere, expect single-tenant / working-renter base with shorter leases; 66% free/reduced lunch — lower-income household profile, screen leases tightly.
- Zoned schools: Albany High School (math 74% / reading 67%, grade B+, #710 of 1,100 statewide, top 65%, 2,676 students, 69% FRL) — zoned schools at 69% FRL track the district average.
- Zoned-school proficiency averages 70% at this address vs 38% district-wide (+32 pts) — the actual schools serving this property are materially stronger than the Albany City School District average implies; a family-tenant draw the district grade alone would hide.
- Market conditions: Rents rising fast (+8.7%/yr); 58 active listings in the ZIP; 8 comparable units currently listed for rent nearby; rentals at typical pace (median 24d on market — plan ~3-4 weeks tenant-placement turnaround); 675 units permitted in Albany County in 2024 (451 in 5+ unit buildings).
- At $1,994/mo this rent would consume 45% of the median local household income ($53k/yr) (locally 935% of renters already pay >50% of income on rent) — very limited rent-growth headroom before tenants either downsize or default.
Forward outlook
- In year one you build about $16k of equity ($1k loan paydown + $15k appreciation (10.0% local appreciation)).
- Albany County population projected at +9% by 2050 — modest demand growth; plan on rents tracking national, not racing it.
- At projected returns (10.0% appreciation + 8.0% rent growth), your $42k cash investment doubles in ~3 years — after that, you're playing with house money.
- By year 3, paydown + projected appreciation supports a ~$41k cash-out refi (75% LTV) — recoverable capital for the next deal without selling this one.
Negotiation context
- Only 8 days on market — expect competitive offers; lowballing is unlikely to land.
Risks & watch-outs
- Watch-outs: property tax is 3.8% of price; built in 1920 — expect roof / HVAC / electrical / plumbing capex.
Questions for the listing agent
- Built in 1920 — when were the roof, HVAC, electrical panel, plumbing, and water heater last replaced?
- Property tax is high relative to price — has the assessment been appealed recently, and will the sale trigger a re-assessment?
- Is there a deadline driving the sale (1031 exchange, divorce, estate, relocation)? That informs how much negotiation room exists.
- Crime grade is F in this area — have there been break-ins, vandalism, or insurance claims at this property in the last 3 years? What carrier currently insures it and at what premium?
- What's the average days-on-market for RENTAL listings here right now (not sales)? A rising rental-DOM trend means longer vacancies and softer asking-rent achievability than the comps imply.
- What's the recent tenant-quality profile in this submarket — average credit score on applications, eviction rate, late-payment / NSF rate, and stable-employment percentage? A property-management company in the area should have these aggregated.
- How much new for-sale + rental construction is in the pipeline within 1–3 miles? Heavy new supply typically softens prices + rents 12–24 months out; constrained supply supports both.
Investment metrics
- 1% rule
- 1.33% ✓
- Cap rate
- 8.28%
- Cash-on-cash
- 7.10%
- DSCR
- 1.32
- GRM
- 6.3
CMA / ARV
- ARV (median comp)
- $211,278
- List price
- $150,000
- Delta
- -29.00%
- Verdict
- UNDERPRICED
- Comps
- 20 within 1.0 mi
Show comp detail 12 sales within ~0.75 mi
| Address | Dist | Beds/Ba | Sqft | Sold | Price | $/sf | Match |
|---|---|---|---|---|---|---|---|
| 16 Regent St | 0.11mi | 3/1.5 (-1) | 1,640 (-8%) | 5mo | $205,000 | $125 | 70 |
| 17 Kenosha St | 0.39mi | 4/2.0 | 1,700 (-5%) | 10mo | $325,000 | $191 | 65 |
| 24 Summit Ave | 0.53mi | 4/1.5 | 1,820 (+2%) | 8mo | $173,000 | $95 | 63 |
| 36 Osborne St | 0.56mi | 3/1.5 (-1) | 1,788 (+0%) | 9mo | $135,500 | $76 | 59 |
| 18 Bertha St | 0.39mi | 5/2.0 (+1) | 1,946 (+9%) | 9mo | $293,000 | $151 | 54 |
| 49 Mccarty Ave | 0.38mi | 3/1.5 (-1) | 1,600 (-10%) | 8mo | $181,500 | $113 | 52 |
| 153 Second Ave | 0.24mi | 3/1.5 (-1) | 1,596 (-10%) | 16mo | $195,000 | $122 | 51 |
| 3 Carroll Ter | 0.49mi | 4/2.0 | 1,536 (-14%) | 6mo | $245,723 | $160 | 49 |
| 4 Federal St | 0.51mi | 5/2.0 (+1) | 1,537 (-14%) | 2mo | $257,000 | $167 | 47 |
| 2 Kehoe St | 0.49mi | 3/2.0 (-1) | 1,542 (-14%) | 3mo | $239,900 | $156 | 47 |
| 8 Catalpa Dr | 0.59mi | 5/1.5 (+1) | 2,034 (+14%) | 3mo | $287,600 | $141 | 39 |
| 16 Delaware Ter | 0.52mi | 5/1.5 (+1) | 2,040 (+14%) | 15mo | $253,000 | $124 | 32 |
Match score weights: distance 35% · size 25% · config 20% · recency 20%. Top-matched comps best support the ARV.
Projected returns pro-forma
10.0% appreciation · 8.0% rent growth · sell at horizon
- IRR
- 32.1%
- Equity multiple
- 3.58×
- Total profit
- $108,268
- Equity at exit
- $135,132
- IRR
- 29.7%
- Equity multiple
- 8.93×
- Total profit
- $332,900
- Equity at exit
- $291,417
Cash invested: $42,000 (down + closing). Projections, not guarantees.
Landlord ↔ Tenant lean methodology
- Overall (STATE)
- 15 Strongly Tenant-Friendly
- State New York
- 15 Strongly Tenant-Friendly · D+10
- County
- — inherits STATE
- City
- — inherits STATE
ZIP-level market 12202
- Home prices YoY
- 14.3%
- Rents YoY
- 8.7%
- Active inventory
- 58
- Price-to-rent
- 6.3×
Monthly cashflow live
- Estimated rent
- $1,994 high interval (Pro) →
- Mortgage (P&I)
- −$787
- Tax from tax record
- −$477 /mo · $5,729/yr
- Insurance
- −$62
- HOA
- −$0
- Vacancy / Maint / Mgmt
- −$419
- Net cashflow
- $249
Break-even live
UW: 25.0% down · 7.5% · 30yr · 1.5% tax · 5.0% vac · 8.0% maint · 8.0% mgmt
Financing live
Cash to close
- Down payment
- $37,500
- Closing costs
- $4,500
- Reserves months
- —
- Total cash needed
- —
Loan-product check · same deal, 3 products live
Conventional
25% down · 7.5% · 30yr
- Down + closing
- —
- Monthly P&I
- —
- Monthly cashflow
- —
- DSCR
- —
- Eligible?
- —
Personal DTI + credit; lowest rate.
DSCR
20% down · 8.5% · 30yr
- Down + closing
- —
- Monthly P&I
- —
- Monthly cashflow
- —
- DSCR
- —
- Eligible?
- —
No personal income docs; deal must DSCR.
Hard money
10% down · 12.0% · 12mo
- Down + closing
- —
- Monthly P&I
- —
- Monthly cashflow
- —
- DSCR
- —
- Eligible?
- —
Short-term bridge; refi at stabilization.
Rent comps 8 comps
| Address | Beds | Baths | Sqft | Rent | $/sqft | DOM | Units | Dist |
|---|---|---|---|---|---|---|---|---|
| 15 Stanwix St Albany, NY | 4.0 | 1.5 | 1660 | $2,500 | $1.51 | 14d | 1 | 0.51mi |
| 201 Park Ave Unit 10 Albany, NY | 3.0 | 2.0 | 1600 | $2,100 | $1.31 | 43d | 1 | 0.76mi |
| 119 Grand St Albany, NY | 3.0 | 1.0 | 1600 | $1,300 | $0.81 | 43d | 1 | 0.85mi |
| 346 Madison Ave Albany, NY | 3.0 | 2.0 | 1500 | $2,495 | $1.66 | 23d | 1 | 0.94mi |
| 88 Willett St Albany, NY | 3.0 | 1.0 | 825 | $2,080 | $2.52 | 14d | 10 | 1.09mi |
| 21 Woodlawn Ave Unit 3RDFL Albany, NY | 3.0 | 1.0 | 1300 | $1,500 | $1.15 | 43d | 1 | 1.28mi |
| 21 Woodlawn Ave Unit 3rd floor Albany, NY | 3.0 | 1.0 | 1300 | $1,500 | $1.15 | 23d | 1 | 1.28mi |
| 546 Mercer St Unit 1 Albany, NY | 3.0 | 1.0 | 1400 | $1,800 | $1.29 | 23d | 1 | 1.30mi |
Listing history 2 events
-
2026-05-12status Pending 1041-char remark
-
2026-05-01$150,000 Active 1041-char remark
ⓘ Source: listings_history table (triggers on properties + properties_extension) + one-shot
backfill from property_details.listing_events for pre-trigger history.
Tax reassessment forecast NY · Partial reset (capped growth)
- Current annual tax
- $5,729 · $477/mo
- Projected year-2 tax
- $5,729 · $477/mo
- Expected delta
- $0/yr ($0/mo · 0.0%)
ⓘ Screening estimate from a state-policy table — verify with the county assessor before closing.
Climate risk First Street
- Flood 1/10 Low FEMA zone X (unshaded) · 0% chance over 30 yrs
- Wildfire 2/10 Low
- Heat 4/10 Moderate 7 d/yr ≥99°F today · 16 d/yr by 30 yrs out
- Wind 3/10 Moderate 6% chance of damaging wind over 30 yrs
- Air quality 1/10 Low 0 unhealthy d/yr today · 0 by 30 yrs out
Nearby sold comps map
Loading sold comps map…
Walkable amenities ~0.75 mi
Loading nearby amenities…
Taxation est. · year 1
- Rental income
- $23,925
- − Mortgage interest
- −$8,402
- − Property taxes
- −$5,729
- − Insurance
- −$750
- − Repairs & maintenance
- −$1,914
- − Management
- −$1,914
- − Depreciation
- −$4,364
- Taxable income
- $852
- Est. tax owed @ 24.0%
- −$205
- After-tax cash flow
- $2,778/yr
For passive investors: Depreciation is non-cash, so a rental often shows a tax loss while cash-flowing — sheltering income. Rental losses are passive: they offset passive income freely, and up to $25,000/yr can offset ordinary (W-2) income if you actively participate and your MAGI is under $100k (phasing out to $0 by $150k); unused losses carry forward. On sale, claimed depreciation is recaptured at up to 25%, and gains may owe capital-gains tax (a 1031 exchange can defer both). Figures are a year-1 estimate at your 24.0% rate — not tax advice; consult a CPA.
Schools (NCES district)
- District
- Albany City School District
- NCES district ID
- 3602460
- Math proficiency
- 37% ▲ 6.00%
- Reading proficiency
- 40% ▲ 7.00%
- Median HH income
- $40,568
- Composite
- 32.34/100
- National rank
- #5744
- State rank
- #543 of 590 in NY
Livability — Albany
- Score
- 79/100
- State rank
- #129
- US rank
- #2083
Category grades
Schools grade is shown separately in the Schools card above.
Census & demographics
- Census place
- Albany, NY
- County
- Albany County · 196,626 people
- City population
- 116,921
- Metro
- Albany-Schenectady-Troy, NY
- Population (ZIP)
- 10,166
- Household income
- $52,868
- Rent vs Own
- Severe rent burden
- 935.0
Population outlook (Albany County) Hauer SSP2
- Today (2025)
- 320,794 people
- By 2030
- 327,401 · +2.1%
- By 2040
- 338,218 · +5.4%
- By 2050
- 348,467 · +8.6%
- By 2075
- 381,693 · +19.0%
- By 2100
- 393,809 · +22.8%
Race, ethnicity, and origin ACS 2023
- Neighborhood character
- Highly diverse neighborhood (Simpson 0.73)
- Race & ethnicity
- Black 40% White 28% Hispanic / Latino 15% Two or more races 14% Asian 7%
- Hispanic origin (detail)
- Mexican 3% Puerto Rican 5% Dominican 5%
- Common ancestry
- Iranian 2% Romanian 1% Serbian 1%
- Foreign-born
- 14% · Canada, Philippines, China
- Languages at home
- 80% English-only · Spanish 10% Other Asian/Pacific 4% Arabic 1%
Political lean MEDSL · Albany
- 2024 margin
- Strong D (+25.8) · D 62.9% · R 37.1%
- 2008→2024 swing
- -3.6pp toward R · 2008: 29.4pp · 2024: 25.8pp
- All cycles
- 2024: D+25.8 2020: D+31.4 2016: D+24.3 2012: D+31.0 2008: D+29.4
Not yet ingested
- Civics
- —
Market trends
- HPI YoY
- ▲ 38.05%
- Current HPI
- 303.8939
- Rent YoY
- ▲ 8.70%
- Metro
- Albany-Schenectady-Troy, NY
- State GDP YoY
- ▲ 2.60%
- F500 in state
- 92
Industry mix (Fortune 500 HQ in NY)
| Industry | F500 HQs | Revenue |
|---|---|---|
| Financial Services | 10 | $950B |
|
||
| Consumer Goods | 9 | $162B |
|
||
| Insurance | 4 | $225B |
|
||
| Telecommunications | 2 | $144B |
|
||
| Pharmaceuticals | 2 | $112B |
|
||
| Media / Entertainment | 2 | $69B |
|
||
Price history
2 events — show timeline
- 2026-05-12 Pending — Global MLS
- 2026-05-01 Listed $150,000 Global MLS
Property tax history
+2.7%/yrLatest (2025): $5,729 · +2.3% YoY. Source: county tax records.
Cash-flow waterfall
monthlySold comps — $/sqft
last 12 mo · ≤1 miLoading sold comps…