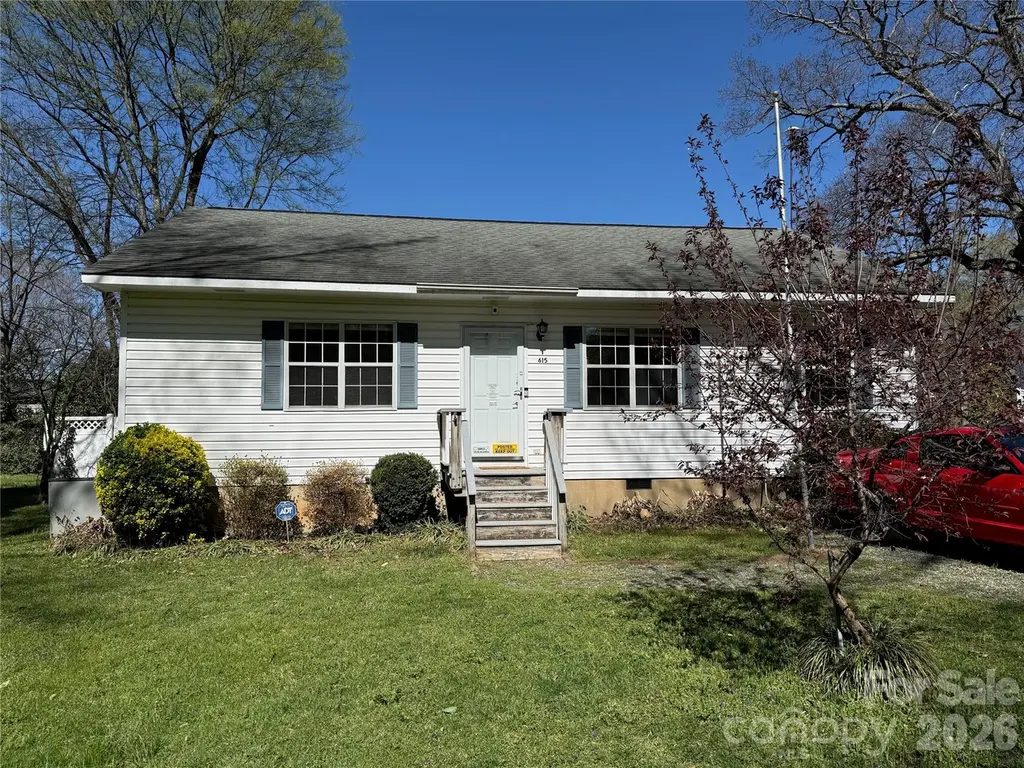
615 Hillcrest St · Charlotte, NC
Flood risk 1/10 · Minimal
- FEMA flood zone
- X (unshaded)
- Chance of flooding over 30 yrs
- 0.0%
- Est. flood insurance / yr
- $507 – $1,088
Fire risk 1/10 · Minimal
- Est. fire insurance / yr
- $906 – $1,684
Heat risk 6/10 · Moderate
- Hot days now (above 104°F)
- 7 days/yr
- Hot days in 30 yrs
- 17 days/yr
Wind risk 5/10 · Moderate
- Chance of severe wind over 30 yrs
- 26.0%
Air-quality risk 4/10 · Minor
- Unhealthy air days now
- 4 days/yr
- Unhealthy air days in 30 yrs
- 5 days/yr
Risk factors via First Street. Map © Google.
Why this score? — see what drove the D+ grade
The composite is a weighted blend of 9 inputs, each scored 0–100. Each bar is that input's sub-score; the figure is the points it added to the 100-point composite (weight × sub-score).
- ARV discount +15.0/15.0
- Cash flow +13.4/30.0
- DSCR +4.0/10.0
- Livability +3.9/5.0
- Schools +3.8/10.0
- 1% rule +3.0/10.0
- Condition / age +2.5/5.0
- Rent growth +2.1/5.0
- Appreciation +0.0/10.0
$239,000
🖨 Deal sheet (PDF) 📄 Offer letter ✓ Due diligence
Listing remarks
Incredibly charming single story home for sale in a fast growing area!! This 3 bedroom 1 bath home is ready for a new owner and has so much to offer. The kitchen features updated euro style cabinetry, a gas cooktop, LVP flooring, a SS refrigerator, and a quaint breakfast nook. Each bedroom is generously sized and the cathedral ceiling in the living room creates a warm and open space. The home also features a large deck that overlooks a beautiful large and flat back yard. The detached garage was used as a cabinetry shop and provides endless opportunities for storage or hobbies. Need more space? Make your way upstairs to the finished loft above the garage. With so much to offer this home will
Key facts
- Gas cooktop
- Ss refrigerator
- Lvp flooring
Tags
Neighborhood map
What this means for you Summary
Snapshot
- This is a 3-bed/1.0-bath single-family listed at $239k.
Deal economics
- At list price, monthly cash flow is $3 ($38/yr) — positive.
- The deal already cash-flows at list — no discount required.
- To meet the 1% rule (rent ≥ 1% of price), the offer needs to be $190k (20.4% below list).
- Recommended offer: $190k (20.4% below list) — sets the bar for 1% rule.
- Cap rate 6.3% vs local median 3.1% in Charlotte — top-decile yield for the area; either an underpriced asset or a hidden risk that comps aren't pricing in. Stress-test before assuming the spread holds.
Location & tenants
- Location reads 78/100 on livability (#26 in NC, #2,502 nationally) — a middle-class / working-renter tenant base. Strengths: amenities A+, commute A+, housing A+; Watch: schools D+, crime F.
- Charlotte-Mecklenburg Schools (urban): math 42% / reading 46% proficiency, ranked #85 of 178 in NC (top 48%) — families likely to look elsewhere, expect single-tenant / working-renter base with shorter leases.
- Market conditions: Rents soft (-1.8%/yr); 137 active listings in the ZIP; 40 comparable units currently listed for rent nearby; rentals leasing fast (median 6d on market — plan ~1-2 weeks tenant-placement turnaround); 11,969 units permitted in Mecklenburg County in 2024 (5,377 in 5+ unit buildings).
- This rent runs 37% of the median local income ($62k/yr) — at the standard rent-burdened threshold; future hikes will face affordability resistance.
Forward outlook
- Local home prices are declining (-3.0%/yr); year-one equity from $2k of loan paydown is wiped out by about $7k of value loss. Plan a longer hold.
- Mecklenburg County population projected at +53% by 2050 — long-run rental-demand tailwind backs the buy-and-hold thesis.
Negotiation context
- Only 9 days on market — expect competitive offers; lowballing is unlikely to land.
Risks & watch-outs
- Climate carrying-cost: moderate wind risk, 26% chance of damaging wind over 30y; extreme-heat days projected 7→17/yr by 2055 (HVAC capex compounding) — expect insurance premiums to compound above CPI over the hold.
Questions for the listing agent
- Is there a deadline driving the sale (1031 exchange, divorce, estate, relocation)? That informs how much negotiation room exists.
- Schools are D-rated, which usually means shorter tenancies and higher turnover. Who's the typical renter profile here, and what's been the actual vacancy rate?
- Crime grade is F in this area — have there been break-ins, vandalism, or insurance claims at this property in the last 3 years? What carrier currently insures it and at what premium?
- The area grade is low — what's the realistic commute time and amenity access for the typical tenant pool here? Any planned neighborhood developments (good or bad) we should know about?
- What's the average days-on-market for RENTAL listings here right now (not sales)? A rising rental-DOM trend means longer vacancies and softer asking-rent achievability than the comps imply.
- What's the recent tenant-quality profile in this submarket — average credit score on applications, eviction rate, late-payment / NSF rate, and stable-employment percentage? A property-management company in the area should have these aggregated.
- How much new for-sale + rental construction is in the pipeline within 1–3 miles? Heavy new supply typically softens prices + rents 12–24 months out; constrained supply supports both.
Investment metrics
- 1% rule
- 0.80% ✗
- Cap rate
- 6.31%
- Cash-on-cash
- 0.06%
- DSCR
- 1.00
- GRM
- 10.5
CMA / ARV
- ARV (on-the-fly)
- $305,760
- Comps found
- 8
Show comp detail 8 sales within ~0.75 mi
| Address | Dist | Beds/Ba | Sqft | Sold | Price | $/sf | Match |
|---|---|---|---|---|---|---|---|
| 631 W Craighead Rd | 0.28mi | 3/2.0 | 1,019 (-9%) | 5mo | $280,000 | $275 | 64 |
| 830 Log Cabin Rd | 0.73mi | 3/1.0 | 1,125 (+0%) | 8mo | $266,000 | $236 | 59 |
| 3801 Sofley Rd | 0.22mi | 3/2.0 | 953 (-15%) | 9mo | $260,000 | $273 | 54 |
| 4101 Cushman St | 0.28mi | 3/2.0 | 1,000 (-11%) | 18mo | $300,000 | $300 | 50 |
| 4808 Hidden Valley Rd | 0.67mi | 3/1.5 | 1,152 (+3%) | 23mo | $258,000 | $224 | 43 |
| 823 Ridgedale Ct | 0.38mi | 3/1.0 | 972 (-13%) | 22mo | $278,000 | $286 | 41 |
| 4601 Hidden Valley Rd | 0.65mi | 3/2.0 | 1,200 (+7%) | 24mo | $246,500 | $205 | 34 |
| 336 Drury Dr | 0.52mi | 4/2.0 (+1) | 1,256 (+12%) | 22mo | $275,000 | $219 | 28 |
Match score weights: distance 35% · size 25% · config 20% · recency 20%. Top-matched comps best support the ARV.
Projected returns pro-forma
-3.0% appreciation · 0.0% rent growth · sell at horizon
- IRR
- -19.4%
- Equity multiple
- 0.34×
- Total profit
- $-44,164
- Equity at exit
- $35,636
- IRR
- -19.1%
- Equity multiple
- 0.10×
- Total profit
- $-60,002
- Equity at exit
- $20,664
Cash invested: $66,920 (down + closing). Projections, not guarantees.
Landlord ↔ Tenant lean methodology
- Overall (STATE)
- 85 Strongly Landlord-Friendly
- State North Carolina
- 85 Strongly Landlord-Friendly · R+3
- County
- — inherits STATE
- City
- — inherits STATE
ZIP-level market 28206
- Home prices YoY
- -20.7%
- Rents YoY
- -1.8%
- Active inventory
- 137
- Price-to-rent
- 10.5×
Monthly cashflow live
- Estimated rent
- $1,902 high interval (Pro) →
- Mortgage (P&I)
- −$1,253
- Tax from tax record
- −$147 /mo · $1,759/yr
- Insurance
- −$100
- HOA
- −$0
- Vacancy / Maint / Mgmt
- −$399
- Net cashflow
- $3
Break-even live
Sensitivity live
| Price | -10% $138 | -5% $71 | +0% $3 | +5% $-64 | +10% $-132 |
|---|---|---|---|---|---|
| Rent | -10% $-147 | -5% $-72 | +0% $3 | +5% $78 | +10% $153 |
| Rate | -1.0pp $124 | -0.5pp $64 | base $3 | +0.5pp $-59 | +1.0pp $-122 |
UW: 25.0% down · 7.5% · 30yr · 1.5% tax · 5.0% vac · 8.0% maint · 8.0% mgmt
Financing live
Cash to close
- Down payment
- $59,750
- Closing costs
- $7,170
- Reserves months
- —
- Total cash needed
- —
Loan-product check · same deal, 3 products live
Conventional
25% down · 7.5% · 30yr
- Down + closing
- —
- Monthly P&I
- —
- Monthly cashflow
- —
- DSCR
- —
- Eligible?
- —
Personal DTI + credit; lowest rate.
DSCR
20% down · 8.5% · 30yr
- Down + closing
- —
- Monthly P&I
- —
- Monthly cashflow
- —
- DSCR
- —
- Eligible?
- —
No personal income docs; deal must DSCR.
Hard money
10% down · 12.0% · 12mo
- Down + closing
- —
- Monthly P&I
- —
- Monthly cashflow
- —
- DSCR
- —
- Eligible?
- —
Short-term bridge; refi at stabilization.
Rent comps 40 comps
| Address | Beds | Baths | Sqft | Rent | $/sqft | DOM | Units | Dist |
|---|---|---|---|---|---|---|---|---|
| 4333 Cinderella Rd Charlotte, NC | 1.0–2.0 | 1.0–1.5 | 759 | $1,425 | $1.88 | 24d | 1 | 0.43mi |
| 806 W Sugar Creek Rd Charlotte, NC | 4.0 | 2.0 | 1220 | $1,500 | $1.23 | 11d | 1 | 0.46mi |
| 4300 Penny Way Charlotte, NC | 2.0–3.0 | 2.0 | 1014 | $1,400 | $1.38 | 2d | 1 | 0.53mi |
| 307 Drury Dr Charlotte, NC | 3.0 | 2.5 | 1346 | $1,800 | $1.34 | 24d | 1 | 0.59mi |
| 337 Wellingford St Charlotte, NC | 3.0 | 1.0 | 843 | $1,700 | $2.02 | 24d | 1 | 0.70mi |
| 229 Hilo Dr Charlotte, NC | 1.0–2.0 | 1.0–2.0 | 860 | $1,475 | $1.72 | 24d | 1 | 0.73mi |
| 3934 Raleigh St Charlotte, NC | 3.0 | 1.0–2.0 | 959 | $3,105 | $3.24 | 8d | 103 | 0.88mi |
| 601 Kentbrook Dr Charlotte, NC | 3.0 | 1.0 | 1000 | $1,685 | $1.69 | 2d | 1 | 0.89mi |
| 614 Kentbrook Dr Charlotte, NC | 3.0 | 1.5 | 1104 | $1,600 | $1.45 | 5d | 1 | 0.91mi |
| 1030 Stitch Bend Way Charlotte, NC | 2.0 | 1.0–2.0 | 820 | $2,379 | $2.90 | 2d | 29 | 0.99mi |
| 815 Echo Glen Rd Charlotte, NC | 3.0 | 1.5 | 1125 | $1,495 | $1.33 | 15d | 1 | 0.99mi |
| 4418 Oat Grass Cir Charlotte, NC | 2.0–3.0 | 2.5–3.5 | 1665 | $3,081 | $1.85 | 3d | 84 | 1.00mi |
| 3750 Philemon Ave Charlotte, NC | 3.0 | 1.0–2.0 | 909 | $2,380 | $2.62 | 3d | 24 | 1.07mi |
| 1841 Prospect Dr Charlotte, NC | 1.0–3.0 | 1.0–2.0 | 915 | $1,604 | $1.75 | 8d | 25 | 1.09mi |
| 110 E 36th St Charlotte, NC | 3.0 | 1.0–2.0 | 883 | $3,195 | $3.62 | 2d | 51 | 1.10mi |
| 5401 Snow White Ln Charlotte, NC | 3.0 | 1.0 | 1264 | $1,670 | $1.32 | 4d | 1 | 1.15mi |
| 411 Lambeth Dr Charlotte, NC | 1.0–3.0 | 1.0–1.5 | 826 | $1,675 | $2.03 | 14d | 1 | 1.15mi |
| 2816 Dalecrest Dr Charlotte, NC | 3.0 | 2.0 | 1223 | $3,100 | $2.53 | 24d | 1 | 1.16mi |
| 4325 Raleigh St Charlotte, NC | 1.0–2.0 | 1.0–2.0 | 1005 | $1,920 | $1.91 | 5d | 25 | 1.16mi |
| 3035 N Tryon St Charlotte, NC | 2.0 | 1.0–2.0 | 968 | $2,661 | $2.75 | 2d | 342 | 1.18mi |
| 4736 Monmouth Dr Charlotte, NC | 3.0 | 1.0 | 1000 | $2,000 | $2.00 | 24d | 1 | 1.18mi |
| 3500 Philemon Ave Charlotte, NC | 2.0 | 1.0–2.0 | 781 | $2,377 | $3.04 | 2d | 117 | 1.19mi |
| 3537 Warp St Charlotte, NC | 2.0 | 2.0 | 1070 | $1,800 | $1.68 | 24d | 1 | 1.23mi |
| 3531 Warp St Charlotte, NC | 2.0 | 2.0 | 1006 | $1,750 | $1.74 | 5d | 1 | 1.23mi |
| 2800 Oneida Rd Charlotte, NC | 3.0 | 2.0 | 1171 | $1,725 | $1.47 | 16d | 1 | 1.23mi |
| 4375 Raleigh St Charlotte, NC | 2.0–3.0 | 2.5–3.5 | 1418 | $2,595 | $1.83 | 3d | 10 | 1.23mi |
| 300 E 36th St Charlotte, NC | 3.0 | 1.0–2.5 | 1040 | $3,168 | $3.05 | 2d | 31 | 1.24mi |
| 908 Bilmark Ave Charlotte, NC | 3.0 | 1.5 | 1150 | $1,625 | $1.41 | 24d | 1 | 1.25mi |
| 629 Raphael Pl Charlotte, NC | 2.0 | 2.0 | 1065 | $1,750 | $1.64 | 24d | 1 | 1.25mi |
| 5414 Princess St Charlotte, NC | 3.0 | 1.5 | 1233 | $1,825 | $1.48 | 22d | 1 | 1.29mi |
| 423 E 36th St Charlotte, NC | 3.0 | 1.0–2.0 | 912 | $3,012 | $3.30 | 3d | 15 | 1.30mi |
| 424 E 36th St Charlotte, NC | 2.0 | 1.0–2.0 | 920 | $2,316 | $2.52 | 3d | 36 | 1.30mi |
| 2019 Aberdale Farm Ln Charlotte, NC | 2.0–4.0 | 2.0 | 1119 | $1,450 | $1.30 | 5d | 1 | 1.31mi |
| 1300 Hunter Oaks Ln Charlotte, NC | 1.0–3.0 | 1.0–2.0 | 910 | $1,500 | $1.65 | 5d | 6 | 1.32mi |
| 1305 Hunter Oaks Ln Charlotte, NC | 2.0 | 2.0 | 996 | $1,300 | $1.31 | 24d | 1 | 1.32mi |
| 1305 Hunter Oaks Ln Unit 1303-01 Charlotte, NC | 3.0 | 2.0 | 1076 | $1,500 | $1.39 | 5d | 1 | 1.32mi |
| 1305 Hunter Oaks Ln Unit 1302-15 Charlotte, NC | 2.0 | 2.0 | 996 | $1,300 | $1.31 | 5d | 1 | 1.32mi |
| 1400 Ventura Way Dr Charlotte, NC | 3.0 | 1.0–1.5 | 650 | $1,513 | $2.33 | 2d | 18 | 1.33mi |
| 1305 Hunter Oaks Ln Unit 115 Charlotte, NC | 3.0 | 2.0 | 1076 | $1,500 | $1.39 | 24d | 1 | 1.33mi |
| 2746 Dogwood Ave Charlotte, NC | 2.0 | 1.0 | 1183 | $1,600 | $1.35 | 24d | 1 | 1.35mi |
Listing history 2 events
-
2026-04-04status Pending
-
2026-03-25$239,000 Active
ⓘ Source: listings_history table (triggers on properties + properties_extension) + one-shot
backfill from property_details.listing_events for pre-trigger history.
Tax reassessment forecast NC · Resets to sale price
- Current annual tax
- $1,759 · $147/mo
- Projected year-2 tax
- $1,960 · $163/mo
- Expected delta
- +$201/yr (+$17/mo · 11.4%)
ⓘ Screening estimate from a state-policy table — verify with the county assessor before closing.
Climate risk First Street
- Flood 1/10 Low FEMA zone X (unshaded) · 0% chance over 30 yrs
- Wildfire 1/10 Low
- Heat 6/10 Major 7 d/yr ≥104°F today · 17 d/yr by 30 yrs out
- Wind 5/10 Major 26% chance of damaging wind over 30 yrs
- Air quality 4/10 Moderate 4 unhealthy d/yr today · 5 by 30 yrs out
Nearby sold comps map
Loading sold comps map…
Walkable amenities ~0.75 mi
Loading nearby amenities…
Taxation est. · year 1
- Rental income
- $22,826
- − Mortgage interest
- −$13,388
- − Property taxes
- −$1,759
- − Insurance
- −$1,195
- − Repairs & maintenance
- −$1,826
- − Management
- −$1,826
- − Depreciation
- −$6,953
- Taxable loss
- −$4,121
- Est. tax savings @ 24.0%
- +$989
- After-tax cash flow
- $1,027/yr
For passive investors: Depreciation is non-cash, so a rental often shows a tax loss while cash-flowing — sheltering income. Rental losses are passive: they offset passive income freely, and up to $25,000/yr can offset ordinary (W-2) income if you actively participate and your MAGI is under $100k (phasing out to $0 by $150k); unused losses carry forward. On sale, claimed depreciation is recaptured at up to 25%, and gains may owe capital-gains tax (a 1031 exchange can defer both). Figures are a year-1 estimate at your 24.0% rate — not tax advice; consult a CPA.
Schools (NCES district)
- District
- Charlotte-Mecklenburg Schools
- NCES district ID
- 3702970
- Math proficiency
- 42% ▼ -6.00%
- Reading proficiency
- 46% ▲ 1.00%
- Median HH income
- $57,175
- Composite
- 38.49/100
- National rank
- #4183
- State rank
- #85 of 178 in NC
Livability — Charlotte
- Score
- 78/100
- State rank
- #26
- US rank
- #2502
Category grades
Schools grade is shown separately in the Schools card above.
Census & demographics
- Census place
- Charlotte, NC
- County
- Mecklenburg County · 1,167,319 people
- City population
- 920,422
- Metro
- Charlotte-Concord-Gastonia, NC-SC
- Population (ZIP)
- 15,375
- Household income
- $61,818
- Rent vs Own
- Severe rent burden
- 1143.0
Population outlook (Mecklenburg County) Hauer SSP2
- Today (2025)
- 1,305,740 people
- By 2030
- 1,442,752 · +10.5%
- By 2040
- 1,722,441 · +31.9%
- By 2050
- 1,999,450 · +53.1%
- By 2075
- 2,642,495 · +102.4%
- By 2100
- 3,106,755 · +137.9%
Race, ethnicity, and origin ACS 2023
- Neighborhood character
- Diverse neighborhood (Simpson 0.56)
- Race & ethnicity
- Black 62% White 18% Hispanic / Latino 16% Two or more races 6% Asian 3%
- Hispanic origin (detail)
- Mexican 7% Puerto Rican 1%
- Common ancestry
- Romanian 1%
- Foreign-born
- 14% · Canada, Vietnam, United Kingdom
- Languages at home
- 79% English-only · Spanish 14% French/Haitian/Cajun 2% Other Indo-European 1%
Political lean MEDSL · Mecklenburg
- 2024 margin
- Solid D (+32.9) · D 65.6% · R 32.7% · Other 1.6%
- 2008→2024 swing
- +8.5pp toward D · 2008: 24.4pp · 2024: 32.9pp
- All cycles
- 2024: D+32.9 2020: D+35.1 2016: D+29.9 2012: D+22.5 2008: D+24.4
Not yet ingested
- Civics
- —
Market trends
- HPI YoY
- ▼ -82.97%
- Current HPI
- 317.6081
- Rent YoY
- ▼ -1.79%
- Metro
- Charlotte-Concord-Gastonia, NC-SC
- State GDP YoY
- ▲ 3.28%
- F500 in state
- 26
Industry mix (Fortune 500 HQ in NC)
| Industry | F500 HQs | Revenue |
|---|---|---|
| Financial Services | 2 | $213B |
|
||
| Retail | 2 | $95B |
|
||
| Industrial Conglomerate | 1 | $38B |
|
||
| Metals / Steel | 1 | $35B |
|
||
| Utilities | 1 | $30B |
|
||
| Industrial Machinery | 1 | $19B |
|
||
Price history
2 events — show timeline
- 2026-04-04 Pending — CANOPYMLS as Distributed by MLS Grid
- 2026-03-25 Listed $239,000 CANOPYMLS as Distributed by MLS Grid
Property tax history
+5.1%/yrLatest (2025): $1,759 · +2.4% YoY. Source: county tax records.
Cash-flow waterfall
monthlySold comps — $/sqft
last 12 mo · ≤1 miLoading sold comps…