1018 Good Pr Ave · Wolfforth, TX
Flood risk No data
- FEMA flood zone
- —
- Chance of flooding over 30 yrs
- —
- Est. flood insurance / yr
- —
Fire risk No data
- Est. fire insurance / yr
- —
Heat risk No data
- Hot days now (above threshold)
- —
- Hot days in 30 yrs
- —
Wind risk No data
- Chance of severe wind over 30 yrs
- —
Air-quality risk No data
- Unhealthy air days now
- —
- Unhealthy air days in 30 yrs
- —
Risk factors via First Street. Map © Google.
Why this score? — see what drove the C- grade
The composite is a weighted blend of 9 inputs, each scored 0–100. Each bar is that input's sub-score; the figure is the points it added to the 100-point composite (weight × sub-score).
- Cash flow +13.2/30.0
- Appreciation +10.0/10.0
- ARV discount +7.5/15.0
- Schools +4.4/10.0
- Condition / age +4.2/5.0
- DSCR +4.0/10.0
- Livability +4.0/5.0
- 1% rule +3.7/10.0
- Rent growth +2.5/5.0
$196,999
🖨 Deal sheet 📄 Offer letter ✓ Due diligence
Listing remarks
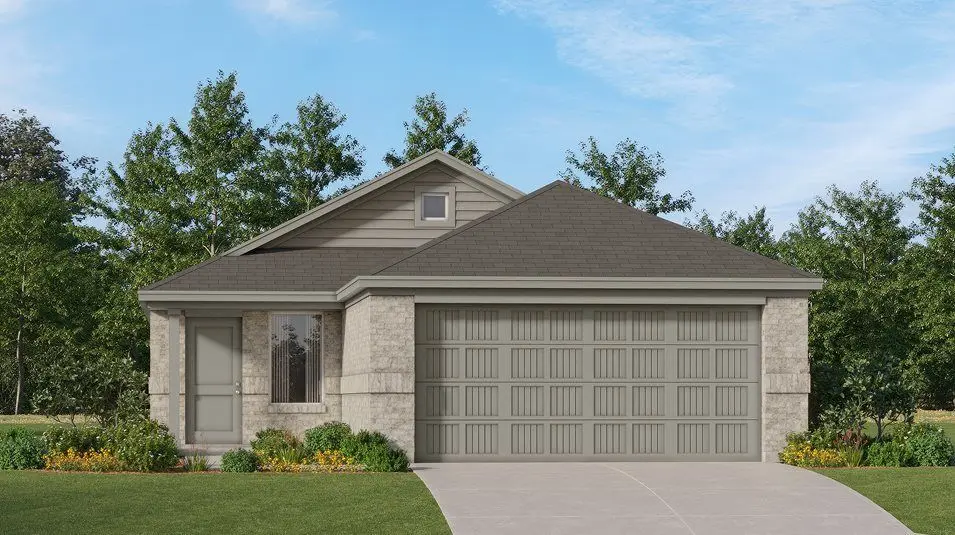
The Kitson - This single-level home showcases a spacious open floorplan shared between the kitchen, dining area and family room for easy entertaining during gatherings. An owner's suite enjoys a private location in a rear corner of the home, complemented by an en-suite bathroom and walk-in closet. There are two secondary bedrooms along the side of the home, which are comfortable spaces for household members and overnight guests. Estimated Completion September 2026. The completion date, prices and features may vary and are subject to change. Please verify with Lennar directly. Photos are for illustrative purposes only.
Key facts
- Walk-in closet
- Open floorplan
- Secondary bedrooms
Tags
Property features AI
Finance
- Other: Address: 1018 Good Prairie Ave, Wolfforth, TX 79382; Listing status: Active
- Financial info: List price $195,999
Exterior
- Home design: Kitson plan
- Construction: New construction (spec)
- Exterior features: Living area approximately 1,402
Interior
- Bedrooms: 3 bedrooms
- Bathrooms: 2 bathrooms
- Interior features: Spec new construction (Kitson plan)
Neighborhood map
What this means for you Summary
Snapshot
- This is a 3-bed/2.0-bath single-family listed at $197k. Condition is rated good.
Deal economics
- At list price, monthly cash flow is $-3 ($-39/yr) — negative.
- To cash-flow at today's rent, offer at most $197k (0.2% below list).
- To meet the 1% rule (rent ≥ 1% of price), the offer needs to be $172k (12.7% below list).
- Recommended offer: $172k (12.7% below list) — sets the bar for 1% rule.
Location & tenants
- Location reads 80/100 on livability (#43 in TX, #1,872 nationally) — a professional / high-income tenant draw. Strengths: cost of living A+, housing A+, health & safety A+; Watch: amenities F, commute F.
- Frenship ISD (urban): math 47% / reading 54% proficiency, ranked #162 of 826 in TX (top 20%) — acceptable for families but not a draw, mixed tenant base, ~2y average lease.
- Market conditions: 472 active listings in the ZIP; 33 comparable units currently listed for rent nearby; rentals lingering (median 44d on market — plan ~5-8 weeks vacancy on turnover, expect pricing pressure); 52% of comp listings sitting > 30 days — soft ceiling on asking rent; solid renter incomes; 2,219 units permitted in Lubbock County in 2024 (252 in 5+ unit buildings).
Forward outlook
- In year one you build about $21k of equity ($1k loan paydown + $20k appreciation (10.0% local appreciation)).
- Lubbock County population projected at +39% by 2050 — long-run rental-demand tailwind backs the buy-and-hold thesis.
- At projected returns (10.0% appreciation + 3.0% rent growth), your $55k cash investment doubles in ~3 years — after that, you're playing with house money.
- By year 2, paydown + projected appreciation supports a ~$34k cash-out refi (75% LTV) — recoverable capital for the next deal without selling this one.
Negotiation context
- It's been on market 17 days — a 2% lower offer ($194k) is reasonable based on typical stale-listing flexibility.
Questions for the listing agent
- What do current leases actually rent for vs. the listed asking? Can we see a recent rent roll and the last 12 months of T-12 income?
- Is there a deadline driving the sale (1031 exchange, divorce, estate, relocation)? That informs how much negotiation room exists.
- Schools are B-rated — typically a magnet for longer-tenancy family renters. What's the average tenant stay here, and is there a school-zone premium baked into asking?
- What's the average days-on-market for RENTAL listings here right now (not sales)? A rising rental-DOM trend means longer vacancies and softer asking-rent achievability than the comps imply.
- What's the recent tenant-quality profile in this submarket — average credit score on applications, eviction rate, late-payment / NSF rate, and stable-employment percentage? A property-management company in the area should have these aggregated.
- How much new for-sale + rental construction is in the pipeline within 1–3 miles? Heavy new supply typically softens prices + rents 12–24 months out; constrained supply supports both.
Investment metrics
- 1% rule
- 0.87% ✗
- Cap rate
- 6.27%
- Cash-on-cash
- -0.07%
- DSCR
- 1.00
- GRM
- 9.5
CMA / ARV
No comps found within radius.
Projected returns pro-forma
10.0% appreciation · 3.0% rent growth · sell at horizon
- IRR
- 24.2%
- Equity multiple
- 2.94×
- Total profit
- $107,110
- Equity at exit
- $177,472
- IRR
- 21.5%
- Equity multiple
- 6.72×
- Total profit
- $315,635
- Equity at exit
- $382,726
Cash invested: $55,160 (down + closing). Projections, not guarantees.
Landlord ↔ Tenant lean methodology
- Overall (STATE)
- 87 Strongly Landlord-Friendly
- State Texas
- 87 Strongly Landlord-Friendly · R+5
- County
- — inherits STATE
- City
- — inherits STATE
ZIP-level market 79382
- Active inventory
- 472
- Price-to-rent
- 9.5×
Monthly cashflow live
- Estimated rent
- $1,719 high interval (Pro) →
- Mortgage (P&I)
- −$1,033
- Tax est. 1.5%
- −$246 /mo · $2,955/yr
- Insurance
- −$82
- HOA
- −$0
- Vacancy / Maint / Mgmt
- −$361
- Net cashflow
- $-3
Break-even live
UW: 25.0% down · 7.5% · 30yr · 1.5% tax · 5.0% vac · 8.0% maint · 8.0% mgmt
Financing live
Cash to close
- Down payment
- $49,250
- Closing costs
- $5,910
- Reserves months
- —
- Total cash needed
- —
Loan-product check · same deal, 3 products live
Conventional
25% down · 7.5% · 30yr
- Down + closing
- —
- Monthly P&I
- —
- Monthly cashflow
- —
- DSCR
- —
- Eligible?
- —
Personal DTI + credit; lowest rate.
DSCR
20% down · 8.5% · 30yr
- Down + closing
- —
- Monthly P&I
- —
- Monthly cashflow
- —
- DSCR
- —
- Eligible?
- —
No personal income docs; deal must DSCR.
Hard money
10% down · 12.0% · 12mo
- Down + closing
- —
- Monthly P&I
- —
- Monthly cashflow
- —
- DSCR
- —
- Eligible?
- —
Short-term bridge; refi at stabilization.
Rent comps 33 comps
| Address | Beds | Baths | Sqft | Rent | $/sqft | DOM | Units | Dist |
|---|---|---|---|---|---|---|---|---|
| 611 E 14th St Wolfforth, TX | 3.0 | 2.0 | 1299 | $1,725 | $1.33 | 43d | 1 | 0.11mi |
| 1313 Corpus Ave Unit B Wolfforth, TX | 3.0 | 2.0 | 1550 | $1,850 | $1.19 | 13d | 1 | 0.30mi |
| 723 E 17th St Wolfforth, TX | 3.0 | 2.0 | 1670 | $1,800 | $1.08 | 43d | 1 | 0.36mi |
| 1712 Corpus Ave Wolfforth, TX | 2.0 | 2.0 | 1335 | $1,375 | $1.03 | 43d | 1 | 0.44mi |
| 2008 Cottonwood Ave Wolfforth, TX | 3.0 | 2.0 | 1450 | $1,810 | $1.25 | 43d | 1 | 0.53mi |
| 2304 Corpus Ave Wolfforth, TX | 3.0 | 2.0 | 1316 | $1,425 | $1.08 | 43d | 1 | 0.55mi |
| 1817 Corpus Ave Wolfforth, TX | 3.0 | 2.0 | 1405 | $1,600 | $1.14 | 13d | 1 | 0.57mi |
| 2001 Corpus Ave Unit 2001 B Corpus Wolfforth, TX | 3.0 | 2.0 | 1350 | $1,500 | $1.11 | 21d | 1 | 0.60mi |
| 2001 Corpus Ave Unit B Wolfforth, TX | 3.0 | 2.0 | 1316 | $1,500 | $1.14 | 13d | 1 | 0.60mi |
| 2006 Corpus Ave Unit A Wolfforth, TX | 3.0 | 2.0 | 1223 | $1,425 | $1.17 | 13d | 1 | 0.60mi |
| 2001 Bryan Ave Unit B Wolfforth, TX | 3.0 | 2.0 | 1360 | $1,400 | $1.03 | 43d | 1 | 0.63mi |
| 2008 Bryan Ave Unit Harvest-2008 A Bryan Wolfforth, TX | 3.0 | 2.0 | 1223 | $1,400 | $1.14 | 43d | 1 | 0.64mi |
| 304 E 19th St Wolfforth, TX | 3.0 | 2.0 | 1114 | $1,150 | $1.03 | 13d | 1 | 0.66mi |
| 127 Brooke Blvd Wolfforth, TX | 3.0 | 2.5 | 1714 | $1,757 | $1.03 | 13d | 2 | 0.66mi |
| 2011 Bryan Ave Wolfforth, TX | 3.0 | 2.0 | 1350 | $1,450 | $1.07 | 43d | 1 | 0.67mi |
| 2418 Aberdeen Ave Wolfforth, TX | 3.0 | 2.0 | 1450 | $1,799 | $1.24 | 43d | 1 | 0.68mi |
| 2408 Aberdeen Ave Wolfforth, TX | 4.0 | 2.0 | 1703 | $2,100 | $1.23 | 21d | 1 | 0.68mi |
| 215 14th St Wolfforth, TX | 4.0 | 3.0 | 1850 | $2,200 | $1.19 | 13d | 1 | 0.69mi |
| 407 E 21st St Wolfforth, TX | 3.0 | 2.0 | 1360 | $1,399 | $1.03 | 21d | 1 | 0.70mi |
| 7510 102nd St Lubbock, TX | 3.0 | 2.0 | 1503 | $1,600 | $1.06 | 43d | 1 | 0.93mi |
| 7456 104th St Lubbock, TX | 3.0 | 2.0 | 1460 | $1,700 | $1.16 | 43d | 1 | 1.02mi |
| 7729 92nd St Lubbock, TX | 4.0 | 3.0 | 1810 | $2,495 | $1.38 | 21d | 1 | 1.02mi |
| 7449 104th St Lubbock, TX | 3.0 | 2.0 | 1481 | $1,625 | $1.10 | 21d | 1 | 1.03mi |
| 7440 104th St Lubbock, TX | 3.0 | 2.0 | 1578 | $1,600 | $1.01 | 13d | 1 | 1.08mi |
| 811 11th St Wolfforth, TX | 3.0 | 2.0 | 1523 | $1,595 | $1.05 | 43d | 1 | 1.10mi |
| 2916 Corpus Ave Wolfforth, TX | 3.0 | 2.0 | 1657 | $1,800 | $1.09 | 43d | 1 | 1.14mi |
| 7424 104th St Lubbock, TX | 3.0 | 2.0 | 1598 | $1,750 | $1.10 | 43d | 1 | 1.17mi |
| 405 Ranger St Wolfforth, TX | 4.0 | 2.0 | 1866 | $2,450 | $1.31 | 13d | 1 | 1.20mi |
| 906 11th St Wolfforth, TX | 3.0 | 2.0 | 1731 | $2,000 | $1.16 | 43d | 1 | 1.20mi |
| 7350 100th St Lubbock, TX | 3.0 | 2.0 | 1400 | $1,650 | $1.18 | 43d | 1 | 1.24mi |
| 7811 86th St Lubbock, TX | 3.0 | 2.0 | 1710 | $2,025 | $1.18 | 21d | 1 | 1.32mi |
| 1019 Donald Preston Dr Unit A Wolfforth, TX | 3.0 | 2.0 | 1400 | $1,275 | $0.91 | 43d | 1 | 1.50mi |
| 1019 Donald Preston Dr Unit A Wolfforth, TX | 3.0 | 2.0 | 1400 | $1,275 | $0.91 | 21d | 1 | 1.50mi |
Listing history 16 events
-
2026-06-18days on market $196,999 Active 17 DOM
-
2026-06-17days on market $196,999 Active 16 DOM
-
2026-06-16days on market $196,999 Active 15 DOM
-
2026-06-15days on market $196,999 Active 14 DOM
-
2026-06-13days on market $196,999 Active 11 DOM
-
2026-06-10days on market $196,999 Active 9 DOM
-
2026-06-09days on market $196,999 Active 8 DOM
-
2026-06-08days on market $196,999 Active 7 DOM
-
2026-06-07days on market $196,999 Active 6 DOM
-
2026-06-05pricedays on market $196,999 Active 3 DOM
-
2026-06-03days on market $195,999 Active 2 DOM
-
2026-06-02remarks 625-char remark
-
2026-06-02days on market $195,999 Active 1 DOM
-
2026-06-01days on market $195,999 Active 12 DOM
-
2026-05-31days on market $195,999 Active 11 DOM
-
2026-05-30days on market $195,999 Active 10 DOM
ⓘ Source: listings_history table (triggers on properties + properties_extension) + one-shot
backfill from property_details.listing_events for pre-trigger history.
Nearby sold comps map
Loading sold comps map…
Walkable amenities ~0.75 mi
Loading nearby amenities…
Taxation est. · year 1
- Rental income
- $20,630
- − Mortgage interest
- −$11,035
- − Property taxes
- −$2,955
- − Insurance
- −$985
- − Repairs & maintenance
- −$1,650
- − Management
- −$1,650
- − Depreciation
- −$5,731
- Taxable loss
- −$3,376
- Est. tax savings @ 24.0%
- +$810
- After-tax cash flow
- $771/yr
For passive investors: Depreciation is non-cash, so a rental often shows a tax loss while cash-flowing — sheltering income. Rental losses are passive: they offset passive income freely, and up to $25,000/yr can offset ordinary (W-2) income if you actively participate and your MAGI is under $100k (phasing out to $0 by $150k); unused losses carry forward. On sale, claimed depreciation is recaptured at up to 25%, and gains may owe capital-gains tax (a 1031 exchange can defer both). Figures are a year-1 estimate at your 24.0% rate — not tax advice; consult a CPA.
Condition & rehab AI · 25 photos
This single-level home showcases a spacious open floorplan with modern finishes and a well-maintained exterior. It is in good condition with minimal repairs needed and offers high potential for value enhancement through updates.
Value-add opportunities
- Both Painting the exterior and interior walls — Fresh paint can enhance curb appeal and interior aesthetics.
- Both Updating the flooring in the bathrooms — Modern flooring can improve the look and feel of the bathrooms.
- Both Upgrading the kitchen appliances — New appliances can increase the home's appeal and functionality.
- Both Adding smart home features — Smart home features can increase the home's value and appeal to tech-savvy buyers.
- Both Landscaping improvements — Enhanced landscaping can improve curb appeal and add value to the home.
Renovation cost estimate screening
Value-add ROI direction
- Both Painting the exterior and interior walls — Fresh paint can enhance curb appeal and interior aesthetics. ↑
- Both Updating the flooring in the bathrooms — Modern flooring can improve the look and feel of the bathrooms. ↑
- Both Upgrading the kitchen appliances — New appliances can increase the home's appeal and functionality. ↑
- Both Adding smart home features — Smart home features can increase the home's value and appeal to tech-savvy buyers. ↑
- Both Landscaping improvements — Enhanced landscaping can improve curb appeal and add value to the home. ↑
ⓘ Cost ranges are severity-bucket heuristics (US national rule-of-thumb). Get contractor quotes + a written scope before underwriting a rehab budget.
Schools (NCES district)
- District
- Frenship ISD
- NCES district ID
- 4819830
- Math proficiency
- 47% ▼ -8.00%
- Reading proficiency
- 54% ▬ 0.00%
- Median HH income
- $54,376
- Composite
- 43.59/100
- National rank
- #2976
- State rank
- #162 of 826 in TX
Livability — Wolfforth
- Score
- 80/100
- State rank
- #43
- US rank
- #1872
Category grades
Schools grade is shown separately in the Schools card above.
Census & demographics
- Census place
- Wolfforth, TX
- County
- Lubbock County · 293,542 people
- City population
- 10,512
- Metro
- Lubbock, TX
- Population (ZIP)
- 10,512
- Household income
- $84,457
- Rent vs Own
- Severe rent burden
- 135.0
Population outlook (Lubbock County) Hauer SSP2
- Today (2025)
- 345,960 people
- By 2030
- 371,449 · +7.4%
- By 2040
- 424,539 · +22.7%
- By 2050
- 481,150 · +39.1%
- By 2075
- 633,467 · +83.1%
- By 2100
- 746,853 · +115.9%
Race, ethnicity, and origin ACS 2023
- Neighborhood character
- Majority White (64%)
- Race & ethnicity
- White 64% Hispanic / Latino 31% Two or more races 18% Black 1%
- Hispanic origin (detail)
- Mexican 28%
- Common ancestry
- Italian 4% Slovak 2% Lithuanian 2%
- Foreign-born
- 4% · Canada
- Languages at home
- 85% English-only · Spanish 14%
Political lean MEDSL · Lubbock
- 2024 margin
- Solid R (+39.5) · D 29.7% · R 69.2% · Other 1.0%
- 2008→2024 swing
- -2.8pp toward R · 2008: -36.7pp · 2024: -39.5pp
- All cycles
- 2024: R+39.5 2020: R+32.2 2016: R+38.4 2012: R+40.9 2008: R+36.7
Not yet ingested
- Civics
- —
Market trends
- HPI YoY
- ▲ 166.08%
- Current HPI
- 561.4491
- Rent YoY
- —
- Metro
- Lubbock, TX
- State GDP YoY
- ▲ 3.95%
- F500 in state
- 110
Industry mix (Fortune 500 HQ in TX)
| Industry | F500 HQs | Revenue |
|---|---|---|
| Energy | 16 | $1,198B |
|
||
| Technology | 5 | $198B |
|
||
| Engineering / Construction | 4 | $72B |
|
||
| Energy Services | 3 | $60B |
|
||
| Utilities | 3 | $41B |
|
||
| Healthcare | 2 | $330B |
|
||
Cash-flow waterfall
monthlySold comps — $/sqft
last 12 mo · ≤1 miLoading sold comps…