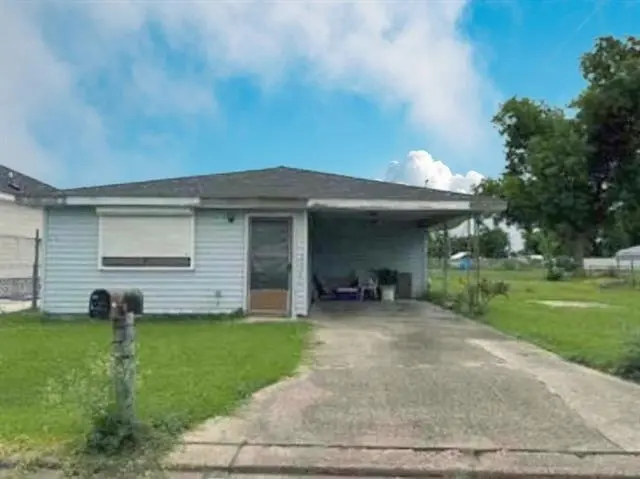
500 Ash Dr · Houma, LA
Flood risk 8/10 · Major
- FEMA flood zone
- X (shaded)
- Chance of flooding over 30 yrs
- 0.98%
- Est. flood insurance / yr
- $507 – $1,088
Fire risk 1/10 · Minimal
- Est. fire insurance / yr
- $1,269 – $2,357
Heat risk 9/10 · Severe
- Hot days now (above 107°F)
- 7 days/yr
- Hot days in 30 yrs
- 21 days/yr
Wind risk 9/10 · Severe
- Chance of severe wind over 30 yrs
- 99.0%
Air-quality risk 1/10 · Minimal
- Unhealthy air days now
- 0 days/yr
- Unhealthy air days in 30 yrs
- 0 days/yr
Risk factors via First Street. Map © Google.
Why this score? — see what drove the B- grade
The composite is a weighted blend of 9 inputs, each scored 0–100. Each bar is that input's sub-score; the figure is the points it added to the 100-point composite (weight × sub-score).
- Cash flow +30.0/30.0
- 1% rule +10.0/10.0
- DSCR +10.0/10.0
- ARV discount +7.5/15.0
- Schools +3.3/10.0
- Livability +3.2/5.0
- Rent growth +2.5/5.0
- Condition / age +2.5/5.0
- Appreciation +0.0/10.0
$51,700
🖨 Deal sheet 📄 Offer letter ✓ Due diligence
Listing remarks MLS
This ranch style single family offers 3 bedrooms and 2 bathrooms with approximately 1500 square feet of living space on a .25 acre lot. The foreclosure deed has been recorded, allowing for shorter closing timelines. No Buyer Premium on this property. It is a criminal offense to trespass on this property. The seller has closing representation in this transaction. The buyer has the right to select their own title/closing company, or may use the seller s title company. The buyer is responsible for all closing costs in this transaction. In the event the buyer chooses their own title/closing company, the buyer will be responsible for additional costs for coordinating the closing that are completed by the seller s title company. Offers to be placed on Xome.com. Interior inspections are not available. Do not trespass! Forward all inquiries and questions to Xome Customer Service (800) 758-8052. NO REPRESENTATION TO VALIDITY OF INFORMATION IS MADE, BUYER TO VERIFY ALL INFORMATION WHERIN
Key facts
- 0.25 acre lot
- Parking
- Built 1977
Neighborhood map
What this means for you Summary
Snapshot
- This is a 3-bed/2.0-bath single-family listed at $52k.
Deal economics
- At list price, monthly cash flow is $622 ($7k/yr) — positive.
- The deal already cash-flows at list — no discount required.
- Meets the 1% rule at list price ($1k rent vs $52k).
- Recommended offer: $49k (6.0% below list) — sets the bar for market timing.
- Cap rate 22.3% vs local median 4.0% in Houma — top-decile yield for the area; either an underpriced asset or a hidden risk that comps aren't pricing in. Stress-test before assuming the spread holds.
Location & tenants
- Location reads 64/100 on livability (#165 in LA) — a middle-class / working-renter tenant base. Strengths: cost of living A+, housing A; Watch: employment D, crime D-, amenities F.
- Terrebonne Parish (other): math 32% / reading 46% proficiency, ranked #23 of 98 in LA (top 24%) — families likely to look elsewhere, expect single-tenant / working-renter base with shorter leases; 62% free/reduced lunch — lower-income household profile, screen leases tightly.
- Market conditions: 206 active listings in the ZIP; 4 comparable units currently listed for rent nearby; rentals lingering (median 44d on market — plan ~5-8 weeks vacancy on turnover, expect pricing pressure); 100% of comp listings sitting > 30 days — soft ceiling on asking rent; 300 units permitted in Terrebonne Parish in 2024 (0 in 5+ unit buildings).
Forward outlook
- Local home prices are declining (-3.0%/yr); year-one equity from $357 of loan paydown is wiped out by about $2k of value loss. Plan a longer hold.
- At projected returns (-3.0% appreciation + 3.0% rent growth), your $14k cash investment doubles in ~3 years — after that, you're playing with house money.
Negotiation context
- It's been on market 74 days — a 6% lower offer ($49k) is reasonable based on typical stale-listing flexibility.
- 2 sale attempts with the ask held roughly flat each time — persistent listings suggest the price (not the market) is what's stuck; bring a comps-based counter.
Risks & watch-outs
- Watch-outs: flood insurance adds $66/mo.
- Climate carrying-cost: severe flood risk; severe wind risk, 99% chance of damaging wind over 30y; extreme-heat days projected 7→21/yr by 2055 (HVAC capex compounding) — expect insurance premiums to compound above CPI over the hold.
Questions for the listing agent
- It's been on market 74 days. Have you received any prior offers? Is the seller open to a 6% concession, seller financing, or rate buy-down credit?
- Built in 1977 — when were the roof, HVAC, electrical panel, plumbing, and water heater last replaced?
- What's the actual annual flood-insurance premium (NFIP or private), and is the property in a SFHA with mandatory coverage?
- Why hasn't it sold? Are there any deal-killer items the seller is aware of (foundation, flood, title, zoning, code violations)?
- Is there a deadline driving the sale (1031 exchange, divorce, estate, relocation)? That informs how much negotiation room exists.
- Schools are B-rated — typically a magnet for longer-tenancy family renters. What's the average tenant stay here, and is there a school-zone premium baked into asking?
- Crime grade is D in this area — have there been break-ins, vandalism, or insurance claims at this property in the last 3 years? What carrier currently insures it and at what premium?
- What's the average days-on-market for RENTAL listings here right now (not sales)? A rising rental-DOM trend means longer vacancies and softer asking-rent achievability than the comps imply.
- What's the recent tenant-quality profile in this submarket — average credit score on applications, eviction rate, late-payment / NSF rate, and stable-employment percentage? A property-management company in the area should have these aggregated.
- How much new for-sale + rental construction is in the pipeline within 1–3 miles? Heavy new supply typically softens prices + rents 12–24 months out; constrained supply supports both.
Investment metrics
- 1% rule
- 2.59% ✓
- Cap rate
- 22.26%
- Cash-on-cash
- 57.03%
- DSCR
- 3.54
- GRM
- 3.2
CMA / ARV
- ARV (median comp)
- $124,665
- List price
- $51,700
- Delta
- -58.53%
- Verdict
- UNDERPRICED
- Comps
- 20 within 1.0 mi
Show comp detail 12 sales within ~0.75 mi
| Address | Dist | Beds/Ba | Sqft | Sold | Price | $/sf | Match |
|---|---|---|---|---|---|---|---|
| 500 Ash Dr | 0.00mi | 3/2.0 | 1,500 (0%) | 0mo | $51,700 | $34 | 100 |
| 314 Marmande Ave | 0.44mi | 3/2.0 | 1,477 (-2%) | 7mo | $124,999 | $85 | 71 |
| 415 Marmande St | 0.54mi | 3/2.0 | 1,514 (+1%) | 6mo | $64,900 | $43 | 68 |
| 201 Walnut St | 0.33mi | 3/2.0 | 1,360 (-9%) | 5mo | $45,000 | $33 | 65 |
| 108 Gustave Ct | 0.70mi | 3/2.0 | 1,521 (+1%) | 2mo | $68,000 | $45 | 63 |
| 232 St Michel Ave | 0.20mi | 4/3.0 (+1) | 1,650 (+10%) | 6mo | $50,000 | $30 | 60 |
| 224 Hellier St | 0.53mi | 3/2.0 | 1,350 (-10%) | 1mo | $160,000 | $119 | 58 |
| 214 Cenac St | 0.45mi | 3/2.0 | 1,692 (+13%) | 1mo | $156,900 | $93 | 57 |
| 114 Jackson St | 0.68mi | 2/2.0 (-1) | 1,501 (+0%) | 11mo | $80,000 | $53 | 54 |
| 260 Garnet St | 0.35mi | 2/1.0 (-1) | 1,335 (-11%) | 10mo | $155,000 | $116 | 48 |
| 609 Williams Ave | 0.71mi | 3/2.0 | 1,402 (-6%) | 10mo | $215,000 | $153 | 47 |
| 8583 Main St | 0.47mi | 2/1.0 (-1) | 1,347 (-10%) | 8mo | $71,760 | $53 | 45 |
Match score weights: distance 35% · size 25% · config 20% · recency 20%. Top-matched comps best support the ARV.
Projected returns pro-forma
-3.0% appreciation · 3.0% rent growth · sell at horizon
- IRR
- 49.5%
- Equity multiple
- 3.16×
- Total profit
- $31,280
- Equity at exit
- $7,709
- IRR
- 55.0%
- Equity multiple
- 6.42×
- Total profit
- $78,495
- Equity at exit
- $4,470
Cash invested: $14,476 (down + closing). Projections, not guarantees.
Landlord ↔ Tenant lean methodology
- Overall (STATE)
- 90 Strongly Landlord-Friendly
- State Louisiana
- 90 Strongly Landlord-Friendly · R+12
- County
- — inherits STATE
- City
- — inherits STATE
ZIP-level market 70363
- Active inventory
- 206
- Price-to-rent
- 3.2×
Monthly cashflow live
- Estimated rent
- $1,340 medium interval (Pro) →
- Mortgage (P&I)
- −$271
- Tax from tax record
- −$78 /mo · $933/yr
- Insurance
- −$22
- Flood insurance flood zone
- −$66 /mo · $798/yr
- HOA
- −$0
- Vacancy / Maint / Mgmt
- −$281
- Net cashflow
- $622
Break-even live
UW: 25.0% down · 7.5% · 30yr · 1.5% tax · 5.0% vac · 8.0% maint · 8.0% mgmt
Financing live
Cash to close
- Down payment
- $12,925
- Closing costs
- $1,551
- Reserves months
- —
- Total cash needed
- —
Loan-product check · same deal, 3 products live
Conventional
25% down · 7.5% · 30yr
- Down + closing
- —
- Monthly P&I
- —
- Monthly cashflow
- —
- DSCR
- —
- Eligible?
- —
Personal DTI + credit; lowest rate.
DSCR
20% down · 8.5% · 30yr
- Down + closing
- —
- Monthly P&I
- —
- Monthly cashflow
- —
- DSCR
- —
- Eligible?
- —
No personal income docs; deal must DSCR.
Hard money
10% down · 12.0% · 12mo
- Down + closing
- —
- Monthly P&I
- —
- Monthly cashflow
- —
- DSCR
- —
- Eligible?
- —
Short-term bridge; refi at stabilization.
Rent comps 4 comps
| Address | Beds | Baths | Sqft | Rent | $/sqft | DOM | Units | Dist |
|---|---|---|---|---|---|---|---|---|
| 179 Garnet St Unit B Houma, LA | 3.0 | 1.0 | 1100 | $1,200 | $1.09 | 44d | 1 | 0.37mi |
| 735 A School St Unit A Houma, LA | 3.0 | 2.0 | 1450 | $1,600 | $1.10 | 44d | 1 | 0.79mi |
| 717 Wood St Houma, LA | 3.0 | 2.0 | 1534 | $1,300 | $0.85 | 44d | 1 | 0.89mi |
| 1300 Laban Ave Houma, LA | 1.0–3.0 | 1.0–1.5 | 896 | $1,347 | $1.50 | 44d | 41 | 1.39mi |
Listing history 5 events
-
2026-05-19status Pending 992-char remark
Show marketing remark (992 chars)
This ranch style single family offers 3 bedrooms and 2 bathrooms with approximately 1500 square feet of living space on a .25 acre lot. The foreclosure deed has been recorded, allowing for shorter closing timelines. No Buyer Premium on this property. It is a criminal offense to trespass on this property. The seller has closing representation in this transaction. The buyer has the right to select their own title/closing company, or may use the seller s title company. The buyer is responsible for all closing costs in this transaction. In the event the buyer chooses their own title/closing company, the buyer will be responsible for additional costs for coordinating the closing that are completed by the seller s title company. Offers to be placed on Xome.com. Interior inspections are not available. Do not trespass! Forward all inquiries and questions to Xome Customer Service (800) 758-8052. NO REPRESENTATION TO VALIDITY OF INFORMATION IS MADE, BUYER TO VERIFY ALL INFORMATION WHERIN
-
2026-03-05$51,700 Active 992-char remark
Show marketing remark (992 chars)
This ranch style single family offers 3 bedrooms and 2 bathrooms with approximately 1500 square feet of living space on a .25 acre lot. The foreclosure deed has been recorded, allowing for shorter closing timelines. No Buyer Premium on this property. It is a criminal offense to trespass on this property. The seller has closing representation in this transaction. The buyer has the right to select their own title/closing company, or may use the seller s title company. The buyer is responsible for all closing costs in this transaction. In the event the buyer chooses their own title/closing company, the buyer will be responsible for additional costs for coordinating the closing that are completed by the seller s title company. Offers to be placed on Xome.com. Interior inspections are not available. Do not trespass! Forward all inquiries and questions to Xome Customer Service (800) 758-8052. NO REPRESENTATION TO VALIDITY OF INFORMATION IS MADE, BUYER TO VERIFY ALL INFORMATION WHERIN
-
2025-11-10$51,700 Active
-
2004-01-22soldstatus
-
1976-12-15soldstatus
ⓘ Source: listings_history table (triggers on properties + properties_extension) + one-shot
backfill from property_details.listing_events for pre-trigger history.
Tax reassessment forecast LA · Resets to sale price
- Current annual tax
- $933 · $78/mo
- Projected year-2 tax
- $933 · $78/mo
- Expected delta
- $0/yr ($0/mo · 0.0%)
ⓘ Screening estimate from a state-policy table — verify with the county assessor before closing.
Climate risk First Street
- Flood 8/10 Severe FEMA zone X (shaded) · 98% chance over 30 yrs
- Wildfire 1/10 Low
- Heat 9/10 Extreme 7 d/yr ≥107°F today · 21 d/yr by 30 yrs out
- Wind 9/10 Extreme 99% chance of damaging wind over 30 yrs
- Air quality 1/10 Low 0 unhealthy d/yr today · 0 by 30 yrs out
Nearby sold comps map
Loading sold comps map…
Walkable amenities ~0.75 mi
Loading nearby amenities…
Taxation est. · year 1
- Rental income
- $16,078
- − Mortgage interest
- −$2,896
- − Property taxes
- −$933
- − Insurance
- −$1,056
- − Repairs & maintenance
- −$1,286
- − Management
- −$1,286
- − Depreciation
- −$1,504
- Taxable income
- $7,116
- Est. tax owed @ 24.0%
- −$1,708
- After-tax cash flow
- $5,751/yr
For passive investors: Depreciation is non-cash, so a rental often shows a tax loss while cash-flowing — sheltering income. Rental losses are passive: they offset passive income freely, and up to $25,000/yr can offset ordinary (W-2) income if you actively participate and your MAGI is under $100k (phasing out to $0 by $150k); unused losses carry forward. On sale, claimed depreciation is recaptured at up to 25%, and gains may owe capital-gains tax (a 1031 exchange can defer both). Figures are a year-1 estimate at your 24.0% rate — not tax advice; consult a CPA.
Schools (NCES district)
- District
- Terrebonne Parish
- NCES district ID
- 2201740
- Math proficiency
- 32% ▼ -36.00%
- Reading proficiency
- 46% ▼ -30.00%
- Median HH income
- $47,612
- Composite
- 33.38/100
- National rank
- #5480
- State rank
- #23 of 98 in LA
Livability — Houma
- Score
- 64/100
- State rank
- #165
- US rank
- #13966
Category grades
Schools grade is shown separately in the Schools card above.
Census & demographics
- Census place
- Houma, LA
- City population
- 57,290
- Population (ZIP)
- 24,668
Population outlook (Terrebonne County) Hauer SSP2
- Today (2025)
- 118,724 people
- By 2030
- 120,321 · +1.3%
- By 2040
- 121,894 · +2.7%
- By 2050
- 121,119 · +2.0%
- By 2075
- 117,270 · -1.2%
- By 2100
- 107,544 · -9.4%
Race, ethnicity, and origin ACS 2023
- Neighborhood character
- Diverse neighborhood (Simpson 0.62)
- Race & ethnicity
- White 57% Black 22% Hispanic / Latino 9% Two or more races 8% Native American 8%
- Hispanic origin (detail)
- Mexican 2%
- Common ancestry
- Lithuanian 16% Italian 1%
- Foreign-born
- 5% · Canada
- Languages at home
- 88% English-only · Spanish 7% French/Haitian/Cajun 4%
Political lean MEDSL · Terrebonne
- 2024 margin
- Solid R (+51.8) · D 23.5% · R 75.3% · Other 1.2%
- 2008→2024 swing
- -11.0pp toward R · 2008: -40.9pp · 2024: -51.8pp
- All cycles
- 2024: R+51.8 2020: R+50.0 2016: R+48.4 2012: R+41.2 2008: R+40.9
Not yet ingested
- Civics
- —
Market trends
- HPI YoY
- ▼ -99.27%
- Current HPI
- 91.3914
- Rent YoY
- —
- Metro
- —
- State GDP YoY
- ▲ 3.29%
- F500 in state
- 10
Industry mix (Fortune 500 HQ in LA)
| Industry | F500 HQs | Revenue |
|---|---|---|
| Telecommunications | 2 | $23B |
|
||
| Utilities | 1 | $12B |
|
||
| Wholesale / Distribution | 1 | $5B |
|
||
| Advertising | 1 | $2B |
|
||
Price history
+0.0% since first listed5 events — show timeline
- 2026-05-19 Pending — AcadianaMLS
- 2026-03-05 Listed $51,700 AcadianaMLS
- 2025-11-10 Listed $51,700 AcadianaMLS
- 2004-01-22 Sold (Public Records) — Public Records
- 1976-12-15 Sold (Public Records) — Public Records
Property tax history
+24.5%/yrLatest (2025): $933 · -2.3% YoY. Source: county tax records.
Cash-flow waterfall
monthlySold comps — $/sqft
last 12 mo · ≤1 miLoading sold comps…