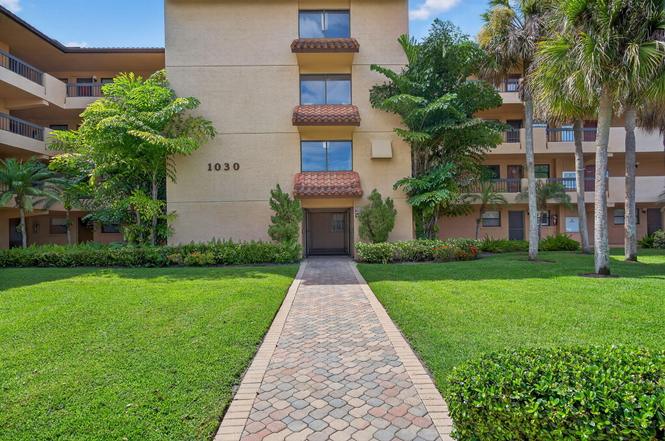
1030 Us Highway 1 #413 · North Palm Beach, FL
Flood risk 1/10 · Minimal
- FEMA flood zone
- X (unshaded)
- Chance of flooding over 30 yrs
- 0.0%
- Est. flood insurance / yr
- $507 – $1,088
Fire risk 2/10 · Minimal
- Est. fire insurance / yr
- $947 – $1,759
Heat risk 10/10 · Severe
- Hot days now (above 106°F)
- 7 days/yr
- Hot days in 30 yrs
- 26 days/yr
Wind risk 10/10 · Severe
- Chance of severe wind over 30 yrs
- 99.0%
Air-quality risk 2/10 · Minimal
- Unhealthy air days now
- 0 days/yr
- Unhealthy air days in 30 yrs
- 1 days/yr
Risk factors via First Street. Map © Google.
Why this score? — see what drove the D grade
The composite is a weighted blend of 9 inputs, each scored 0–100. Each bar is that input's sub-score; the figure is the points it added to the 100-point composite (weight × sub-score).
- Cash flow +10.4/30.0
- 1% rule +7.9/10.0
- ARV discount +7.5/15.0
- Schools +4.3/10.0
- Livability +3.9/5.0
- DSCR +3.0/10.0
- Rent growth +2.6/5.0
- Condition / age +2.5/5.0
- Appreciation +0.0/10.0
$300,000
🖨 Deal sheet (PDF) 📄 Offer letter ✓ Due diligence
Listing remarks MLS
TOP FLOOR VAULTED CEILINGS;GREAT VIEW OF THE INTRACOASTAL!; SHOW= CALL SANDY C#308-6983 OR KEN 329-6320 COVERED PARKING;POOL;CLB.HS;GOLF & TENNIS AT NPBCC
Key facts
- New stove
- Community pool
- New fridge
Tags
Property features AI
Finance
- Financial info: Community contains 108 units; Pets allowed with restrictions (breed, number, size limits possible)
- HOA & community: Association with monthly fee (includes cable TV, insurance, grounds maintenance, sewer, trash, water, common areas, common real estate tax, elevator, recreation facility); Amenities include clubhouse, elevators, on-site management/manager, pool, storage, trash chute, bike storage, sidewalks
Exterior
- Parking: Assigned covered parking; Carport (1 space); 2 open parking spaces; Guest parking
- Utilities: Public water; Public sewer; Three-phase electric service; Cable available
- Home design: Condominium; Resale property; Faces south; Building has 4 stories; Building name: 1030
- Construction: Built with CBS construction; Spanish tile roof; Building area approx. 1,568 (public records)
- Exterior features: Patio; Waterfront with ocean access and intracoastal; fixed bridge
Interior
- Kitchen: Dishwasher; Electric range; Microwave; Refrigerator
- Bedrooms: 2 bedrooms on the main level
- Flooring: Ceramic tile
- Bathrooms: 2 full bathrooms on the main level
- Heating & cooling: Central heating (electric); Central air conditioning; Ceiling fans; Electric cooling
- Interior features: High ceilings; Kitchen island; Walk-in closets; Split bedroom layout; Blinds on windows
- Laundry & utility: Inside laundry
Neighborhood map
What this means for you Summary
Snapshot
- This is a 2-bed/2.0-bath condo listed at $300k.
Deal economics
- At list price, monthly cash flow is $-158 ($-2k/yr) — negative.
- To cash-flow at today's rent, offer at most $272k (9.3% below list).
- Meets the 1% rule at list price ($4k rent vs $300k).
- Recommended offer: $264k (12.0% below list) — sets the bar for market timing.
Location & tenants
- Location reads 77/100 on livability (#184 in FL, #2,894 nationally) — a middle-class / working-renter tenant base. Strengths: crime A+, employment A+, housing A+; Watch: amenities F, commute F, cost of living D-.
- Palm Beach (suburban): math 46% / reading 53% proficiency, ranked #34 of 73 in FL (top 47%) — families likely to look elsewhere, expect single-tenant / working-renter base with shorter leases.
- Zoned schools: Teen Parent Program - Pk (19 students, 0% FRL); Howell L. Watkins Middle School (math 18% / reading 33%, grade F, #512 of 571 statewide, top 90%, 794 students, 76% FRL); Palm Beach Gardens High School (math 19% / reading 40%, grade F, #447 of 667 statewide, top 68%, 2,570 students, 61% FRL).
- Zoned-school proficiency averages 28% at this address vs 50% district-wide (-22 pts) — the specific schools serving this property underperform the Palm Beach average; the district grade overstates school quality for this exact location.
- Market conditions: Rents flat; 404 active listings in the ZIP; 40 comparable units currently listed for rent nearby; rentals at typical pace (median 26d on market — plan ~3-4 weeks tenant-placement turnaround); solid renter incomes; 3,974 units permitted in Palm Beach County in 2024 (1,012 in 5+ unit buildings).
- At $3,864/mo this rent would consume 50% of the median local household income ($92k/yr) (locally 835% of renters already pay >50% of income on rent) — very limited rent-growth headroom before tenants either downsize or default.
Forward outlook
- Local home prices are declining (-3.0%/yr); year-one equity from $2k of loan paydown is wiped out by about $9k of value loss. Plan a longer hold.
- Palm Beach County population projected at +30% by 2050 — long-run rental-demand tailwind backs the buy-and-hold thesis.
Negotiation context
- It's been on market 160 days — a 12% lower offer ($264k) is reasonable based on typical stale-listing flexibility.
- 3 sale attempts since 24y ago; this cycle's ask has dropped $20k (6%) from the opening price — seller is motivated, your offer sets the floor, not the list.
- Current owner paid $159k; list at $300k implies a 89% gain — meaningful room to come down on a strong offer.
Risks & watch-outs
- Watch-outs: HOA is 29% of rent.
- Climate carrying-cost: severe wind risk, 99% chance of damaging wind over 30y; extreme-heat days projected 7→26/yr by 2055 (HVAC capex compounding) — expect insurance premiums to compound above CPI over the hold.
Questions for the listing agent
- What do current leases actually rent for vs. the listed asking? Can we see a recent rent roll and the last 12 months of T-12 income?
- It's been on market 160 days. Have you received any prior offers? Is the seller open to a 12% concession, seller financing, or rate buy-down credit?
- What does the HOA fee cover, when was the last increase, and are there any pending special assessments or reserve-fund shortfalls?
- Any open or pending special assessments — roof, HVAC, plumbing, elevator, façade? What's the per-unit balance and payoff schedule, and is the seller paying it off at close or rolling it to the buyer?
- Why hasn't it sold? Are there any deal-killer items the seller is aware of (foundation, flood, title, zoning, code violations)?
- Is there a deadline driving the sale (1031 exchange, divorce, estate, relocation)? That informs how much negotiation room exists.
- Schools are A-rated — typically a magnet for longer-tenancy family renters. What's the average tenant stay here, and is there a school-zone premium baked into asking?
- The area grade is low — what's the realistic commute time and amenity access for the typical tenant pool here? Any planned neighborhood developments (good or bad) we should know about?
- What's the average days-on-market for RENTAL listings here right now (not sales)? A rising rental-DOM trend means longer vacancies and softer asking-rent achievability than the comps imply.
- What's the recent tenant-quality profile in this submarket — average credit score on applications, eviction rate, late-payment / NSF rate, and stable-employment percentage? A property-management company in the area should have these aggregated.
- How much new apartment / multifamily construction is in the pipeline within 1–3 miles? Heavy new supply (>2% of stock underway) typically softens rents 12–24 months out; light construction supports rent growth.
Investment metrics
- 1% rule
- 1.29% ✓
- Cap rate
- 5.66%
- Cash-on-cash
- -2.26%
- DSCR
- 0.90
- GRM
- 6.5
CMA / ARV
No comps found within radius.
Projected returns pro-forma
-3.0% appreciation · 0.27% rent growth · sell at horizon
- IRR
- -24.7%
- Equity multiple
- 0.19×
- Total profit
- $-68,275
- Equity at exit
- $44,731
- IRR
- -42.5%
- Equity multiple
- -0.30×
- Total profit
- $-109,508
- Equity at exit
- $25,939
Cash invested: $84,000 (down + closing). Projections, not guarantees.
Landlord ↔ Tenant lean methodology
- Overall (STATE)
- 87 Strongly Landlord-Friendly
- State Florida
- 87 Strongly Landlord-Friendly · R+3
- County
- — inherits STATE
- City
- — inherits STATE
ZIP-level market 33408
- Rents YoY
- 0.3%
- Active inventory
- 404
- Price-to-rent
- 6.5×
Monthly cashflow live
- Estimated rent
- $3,864 high interval (Pro) →
- Mortgage (P&I)
- −$1,573
- Tax from tax record
- −$380 /mo · $4,558/yr
- Insurance
- −$125
- HOA
- −$1,133
- Vacancy / Maint / Mgmt
- −$811
- Net cashflow
- $-158
Break-even live
Sensitivity live
| Price | -10% $11 | -5% $-73 | +0% $-158 | +5% $-243 | +10% $-328 |
|---|---|---|---|---|---|
| Rent | -10% $-464 | -5% $-311 | +0% $-158 | +5% $-6 | +10% $147 |
| Rate | -1.0pp $-7 | -0.5pp $-82 | base $-158 | +0.5pp $-236 | +1.0pp $-315 |
UW: 25.0% down · 7.5% · 30yr · 1.5% tax · 5.0% vac · 8.0% maint · 8.0% mgmt
Financing live
Cash to close
- Down payment
- $75,000
- Closing costs
- $9,000
- Reserves months
- —
- Total cash needed
- —
Loan-product check · same deal, 3 products live
Conventional
25% down · 7.5% · 30yr
- Down + closing
- —
- Monthly P&I
- —
- Monthly cashflow
- —
- DSCR
- —
- Eligible?
- —
Personal DTI + credit; lowest rate.
DSCR
20% down · 8.5% · 30yr
- Down + closing
- —
- Monthly P&I
- —
- Monthly cashflow
- —
- DSCR
- —
- Eligible?
- —
No personal income docs; deal must DSCR.
Hard money
10% down · 12.0% · 12mo
- Down + closing
- —
- Monthly P&I
- —
- Monthly cashflow
- —
- DSCR
- —
- Eligible?
- —
Short-term bridge; refi at stabilization.
Rent comps 40 comps
| Address | Beds | Baths | Sqft | Rent | $/sqft | DOM | Units | Dist |
|---|---|---|---|---|---|---|---|---|
| 20 Yacht Club Dr #405 North Palm Beach, FL | 2.0 | 2.0 | 1010 | $3,000 | $2.97 | 26d | 1 | 0.15mi |
| 29 Yacht Club Dr #306 North Palm Beach, FL | 2.0 | 2.0 | 1200 | $3,000 | $2.50 | 4d | 1 | 0.16mi |
| 123 Lakeshore Dr #445 North Palm Beach, FL | 2.0 | 2.0 | 1715 | $3,950 | $2.30 | 26d | 1 | 0.23mi |
| 124 Lakeshore Dr #4280 North Palm Beach, FL | 2.0 | 2.0 | 1422 | $3,750 | $2.64 | 22d | 1 | 0.28mi |
| 126 Lakeshore Dr Unit 927 North Palm Beach, FL | 2.0 | 2.0 | 1422 | $3,250 | $2.29 | 26d | 1 | 0.29mi |
| 52 Yacht Club Dr #308 North Palm Beach, FL | 2.0 | 2.0 | 1130 | $3,800 | $3.36 | 13d | 1 | 0.29mi |
| 52 Yacht Club Dr North Palm Beach, FL | 2.0 | 2.0 | 1130 | $3,375 | $2.99 | 18d | 2 | 0.29mi |
| 336 Golfview Rd Ph 12 North Palm Beach, FL | 3.0 | 2.0 | 1523 | $3,900 | $2.56 | 9d | 1 | 0.31mi |
| 336 Golfview Rd Ph 12 North Palm Beach, FL | 3.0 | 2.0 | 1523 | $4,000 | $2.63 | 26d | 1 | 0.31mi |
| 336 Golfview Rd Ph 12 North Palm Beach, FL | 3.0 | 2.0 | 1523 | $3,900 | $2.56 | 12d | 1 | 0.31mi |
| 60 Yacht Club Dr #405 North Palm Beach, FL | 2.0 | 2.0 | 1423 | $3,100 | $2.18 | 20d | 1 | 0.31mi |
| 134 Lakeshore Dr Unit T13 North Palm Beach, FL | 2.0 | 2.0 | 1244 | $3,250 | $2.61 | 26d | 1 | 0.32mi |
| 132 Lakeshore Dr #1118 North Palm Beach, FL | 3.0 | 2.5 | 1498 | $6,450 | $4.31 | 26d | 1 | 0.34mi |
| 136 Lakeshore Dr North Palm Beach, FL | 2.0 | 2.0 | 1244 | $4,000 | $3.22 | 5d | 1 | 0.34mi |
| 130 Lakeshore Dr #923 North Palm Beach, FL | 2.0 | 2.0 | 1244 | $3,300 | $2.65 | 26d | 1 | 0.34mi |
| 370 Golfview Rd North Palm Beach, FL | 2.0 | 2.0 | 1724 | $3,775 | $2.19 | 3d | 2 | 0.43mi |
| 382 Golfview Rd Unit C North Palm Beach, FL | 2.0 | 2.0 | 1513 | $2,950 | $1.95 | 26d | 1 | 0.51mi |
| 1 Water Club Way North Palm Beach, FL | 3.0–4.0 | 3.0–4.0 | 2154 | $12,500 | $5.80 | 20d | 3 | 0.53mi |
| 700 Sanctuary Cove Dr West Palm Beach, FL | 1.0–3.0 | 1.0–2.0 | 1120 | $2,584 | $2.31 | 0d | 55 | 0.75mi |
| 1660 Twelve Oaks Way #203 North Palm Beach, FL | 2.0 | 2.0 | 1492 | $7,500 | $5.03 | 21d | 1 | 0.75mi |
| 732 Pelican Way North Palm Beach, FL | 3.0 | 2.0 | 1728 | $4,950 | $2.86 | 26d | 1 | 0.79mi |
| 733 Waterway Dr North Palm Beach, FL | 2.0 | 2.0 | 1590 | $11,500 | $7.23 | 26d | 1 | 0.87mi |
| 11370 Twelve Oaks Way #614 North Palm Beach, FL | 2.0 | 2.0 | 1535 | $3,750 | $2.44 | 26d | 1 | 0.90mi |
| 2100 PGA Blvd Palm Beach Gardens, FL | 1.0–2.0 | 1.0–2.0 | 983 | $3,118 | $3.17 | 0d | 9 | 0.90mi |
| 2539 Wabash Dr West Palm Beach, FL | 3.0 | 2.5 | 1468 | $5,500 | $3.75 | 26d | 1 | 0.95mi |
| 429 Inlet Rd North Palm Beach, FL | 3.0 | 2.5 | 1452 | $6,500 | $4.48 | 26d | 1 | 0.97mi |
| 11521 Landing Pl Unit E1 North Palm Beach, FL | 2.0 | 2.0 | 1130 | $7,000 | $6.19 | 26d | 1 | 1.00mi |
| 160 Lost Bridge Dr Palm Beach Gardens, FL | 3.0 | 2.0 | 1826 | $4,500 | $2.46 | 16d | 1 | 1.03mi |
| 2396 Easy St Unit A Palm Beach Gardens, FL | 2.0 | 1.0 | 948 | $3,500 | $3.69 | 26d | 1 | 1.05mi |
| 708 Westwind Dr North Palm Beach, FL | 3.0 | 2.0 | 1761 | $4,000 | $2.27 | 26d | 1 | 1.06mi |
| 517 Gulf Rd North Palm Beach, FL | 3.0 | 2.0 | 1657 | $5,500 | $3.32 | 26d | 1 | 1.11mi |
| 1128 Rainwood Cir W Palm Beach Gardens, FL | 3.0 | 2.0 | 1650 | $4,200 | $2.55 | 23d | 1 | 1.17mi |
| 549 Fairwind Dr North Palm Beach, FL | 3.0 | 2.0 | 1498 | $5,000 | $3.34 | 26d | 1 | 1.21mi |
| 522 Eastwind Dr North Palm Beach, FL | 2.0 | 2.0 | 948 | $3,995 | $4.21 | 26d | 1 | 1.25mi |
| 10174 Plum St Palm Beach Gardens, FL | 3.0 | 2.0 | 1546 | $3,800 | $2.46 | 26d | 1 | 1.25mi |
| 908 Lighthouse Dr North Palm Beach, FL | 3.0 | 2.0 | 1478 | $4,250 | $2.88 | 26d | 1 | 1.35mi |
| 913 Lighthouse Dr North Palm Beach, FL | 3.0 | 2.5 | 1092 | $5,900 | $5.40 | 26d | 1 | 1.37mi |
| 222 E Tall Oaks Cir Palm Beach Gardens, FL | 3.0 | 2.0 | 1577 | $5,000 | $3.17 | 23d | 1 | 1.40mi |
| 624 Southwind Cir Unit 3 North Palm Beach, FL | 3.0 | 3.0 | 1316 | $5,500 | $4.18 | 26d | 1 | 1.40mi |
| 624 Southwind Cir Apt 4 North Palm Beach, FL | 3.0 | 2.0 | 1134 | $4,750 | $4.19 | 26d | 1 | 1.40mi |
HOA detail condo
- Monthly dues
- $1,133 · $13,596/yr
- Likely covers
- pool
- Assessments
- None detected in remarks — confirm with the listing agent.
Listing history 23 events
-
2026-06-21days on market $300,000 Active 160 DOM
-
2026-06-18days on market $300,000 Active 157 DOM
-
2026-06-17days on market $300,000 Active 156 DOM
-
2026-06-16days on market $300,000 Active 155 DOM
-
2026-06-15days on market $300,000 Active 154 DOM
-
2026-06-13days on market $300,000 Active 152 DOM
-
2026-06-09days on market $300,000 Active 148 DOM
-
2026-06-07days on market $300,000 Active 146 DOM
-
2026-06-04days on market $300,000 Active 143 DOM
-
2026-06-03days on market $300,000 Active 142 DOM
-
2026-06-01days on market $300,000 Active 140 DOM
-
2026-05-31days on market $300,000 Active 139 DOM
-
2026-05-05price $300,000
-
2026-02-27price $310,000
-
2026-01-12$320,000 Active
-
2026-01-09historical
-
2025-09-05price $335,000
-
2025-08-01$349,000 Active
-
2002-07-09soldstatus $159,000
-
2002-07-03soldstatus $159,000 158-char remark
Show marketing remark (158 chars)
TOP FLOOR VAULTED CEILINGS;GREAT VIEW OF THE INTRACOASTAL!; SHOW= CALL SANDY C#308-6983 OR KEN 329-6320 COVERED PARKING;POOL;CLB.HS;GOLF & TENNIS AT NPBCC
-
2002-04-05historical 158-char remark
Show marketing remark (158 chars)
TOP FLOOR VAULTED CEILINGS;GREAT VIEW OF THE INTRACOASTAL!; SHOW= CALL SANDY C#308-6983 OR KEN 329-6320 COVERED PARKING;POOL;CLB.HS;GOLF & TENNIS AT NPBCC
-
2002-03-28$159,000 158-char remark
Show marketing remark (158 chars)
TOP FLOOR VAULTED CEILINGS;GREAT VIEW OF THE INTRACOASTAL!; SHOW= CALL SANDY C#308-6983 OR KEN 329-6320 COVERED PARKING;POOL;CLB.HS;GOLF & TENNIS AT NPBCC
-
1987-05-01soldstatus $110,000
ⓘ Source: listings_history table (triggers on properties + properties_extension) + one-shot
backfill from property_details.listing_events for pre-trigger history.
Tax reassessment forecast FL · Resets to sale price
- Current annual tax
- $4,558 · $380/mo
- Projected year-2 tax
- $4,558 · $380/mo
- Expected delta
- $0/yr ($0/mo · 0.0%)
ⓘ Screening estimate from a state-policy table — verify with the county assessor before closing.
Climate risk First Street
- Flood 1/10 Low FEMA zone X (unshaded) · 0% chance over 30 yrs
- Wildfire 2/10 Low
- Heat 10/10 Extreme 7 d/yr ≥106°F today · 26 d/yr by 30 yrs out
- Wind 10/10 Extreme 99% chance of damaging wind over 30 yrs
- Air quality 2/10 Low 0 unhealthy d/yr today · 1 by 30 yrs out
Nearby sold comps map
Loading sold comps map…
Walkable amenities ~0.75 mi
Loading nearby amenities…
Taxation est. · year 1
- Rental income
- $46,369
- − Mortgage interest
- −$16,805
- − Property taxes
- −$4,558
- − Insurance
- −$1,500
- − Repairs & maintenance
- −$3,710
- − Management
- −$3,710
- − HOA
- −$13,596
- − Depreciation
- −$8,727
- Taxable loss
- −$6,235
- Est. tax savings @ 24.0%
- +$1,496
- After-tax cash flow
- $-404/yr
For passive investors: Depreciation is non-cash, so a rental often shows a tax loss while cash-flowing — sheltering income. Rental losses are passive: they offset passive income freely, and up to $25,000/yr can offset ordinary (W-2) income if you actively participate and your MAGI is under $100k (phasing out to $0 by $150k); unused losses carry forward. On sale, claimed depreciation is recaptured at up to 25%, and gains may owe capital-gains tax (a 1031 exchange can defer both). Figures are a year-1 estimate at your 24.0% rate — not tax advice; consult a CPA.
Schools (NCES district)
- District
- Palm Beach
- NCES district ID
- 1201500
- Math proficiency
- 46% ▼ -16.00%
- Reading proficiency
- 53% ▼ -4.00%
- Median HH income
- $53,943
- Composite
- 42.72/100
- National rank
- #3160
- State rank
- #34 of 73 in FL
Livability — North Palm Beach
- Score
- 77/100
- State rank
- #184
- US rank
- #2894
Category grades
Schools grade is shown separately in the Schools card above.
Census & demographics
- Census place
- North Palm Beach, FL
- County
- Palm Beach County · 1,438,312 people
- City population
- 18,817
- Metro
- Miami-Fort Lauderdale-Pompano Beach, FL
- Population (ZIP)
- 18,817
- Household income
- $92,216
- Rent vs Own
- Severe rent burden
- 835.0
Population outlook (Palm Beach County) Hauer SSP2
- Today (2025)
- 1,637,487 people
- By 2030
- 1,743,255 · +6.5%
- By 2040
- 1,948,712 · +19.0%
- By 2050
- 2,132,979 · +30.3%
- By 2075
- 2,530,027 · +54.5%
- By 2100
- 2,706,979 · +65.3%
Race, ethnicity, and origin ACS 2023
- Neighborhood character
- Predominantly White (86%)
- Race & ethnicity
- White 86% Hispanic / Latino 9% Two or more races 7% Black 1% Asian 1%
- Hispanic origin (detail)
- Puerto Rican 2% Cuban 2%
- Common ancestry
- Lithuanian 4% Slovak 3% Romanian 3%
- Foreign-born
- 11% · Canada, Jamaica, Guatemala
- Languages at home
- 89% English-only · Spanish 7% Other Indo-European 1% French/Haitian/Cajun 1%
Political lean MEDSL · Palm Beach
- 2024 margin
- Toss-up / Even · D 50.0% · R 49.2%
- 2008→2024 swing
- -22.1pp toward R · 2008: 22.9pp · 2024: 0.8pp
- All cycles
- 2024: D+0.8 2020: D+12.8 2016: D+15.3 2012: D+17.0 2008: D+22.9
Not yet ingested
- Civics
- —
Market trends
- HPI YoY
- ▼ -223.14%
- Current HPI
- 365.2913
- Rent YoY
- ▲ 0.27%
- Metro
- Miami-Fort Lauderdale-Pompano Beach, FL
- State GDP YoY
- ▲ 3.28%
- F500 in state
- 36
Industry mix (Fortune 500 HQ in FL)
| Industry | F500 HQs | Revenue |
|---|---|---|
| Industrial Technology | 2 | $29B |
|
||
| Insurance | 2 | $17B |
|
||
| Retail | 1 | $60B |
|
||
| Technology Distribution | 1 | $58B |
|
||
| Homebuilding | 1 | $35B |
|
||
| Technology Manufacturing | 1 | $35B |
|
||
Price history
+172.7% since first listed11 events — show timeline
- 2026-05-05 Price Changed $300,000 Beaches MLS
- 2026-02-27 Price Changed $310,000 Beaches MLS
- 2026-01-12 Listed $320,000 Beaches MLS
- 2026-01-09 Listing Removed — Beaches MLS
- 2025-09-05 Price Changed $335,000 Beaches MLS
- 2025-08-01 Listed $349,000 Beaches MLS
- 2002-07-09 Sold (Public Records) $159,000 Public Records
- 2002-07-03 Sold (MLS) $159,000 Beaches MLS
- 2002-04-05 Listing Removed — Beaches MLS
- 2002-03-28 Listed $159,000 Beaches MLS
- 1987-05-01 Sold (Public Records) $110,000 Public Records
Property tax history
+2.7%/yrLatest (2025): $4,558 · -11.2% YoY. Source: county tax records.
Cash-flow waterfall
monthlySold comps — $/sqft
last 12 mo · ≤1 miLoading sold comps…