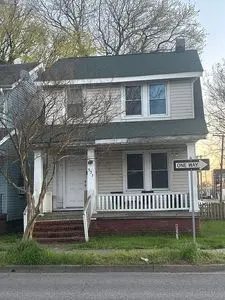
537 W 27th St · Norfolk, VA
Flood risk 4/10 · Minor
- FEMA flood zone
- X (unshaded)
- Chance of flooding over 30 yrs
- 0.13%
- Est. flood insurance / yr
- $507 – $1,088
Fire risk 1/10 · Minimal
- Est. fire insurance / yr
- $666 – $1,236
Heat risk 9/10 · Severe
- Hot days now (above 106°F)
- 7 days/yr
- Hot days in 30 yrs
- 16 days/yr
Wind risk 8/10 · Major
- Chance of severe wind over 30 yrs
- 80.0%
Air-quality risk 3/10 · Minor
- Unhealthy air days now
- 2 days/yr
- Unhealthy air days in 30 yrs
- 5 days/yr
Risk factors via First Street. Map © Google.
Why this score? — see what drove the C- grade
The composite is a weighted blend of 9 inputs, each scored 0–100. Each bar is that input's sub-score; the figure is the points it added to the 100-point composite (weight × sub-score).
- ARV discount +15.0/15.0
- Cash flow +13.9/30.0
- DSCR +4.2/10.0
- Livability +4.2/5.0
- Schools +3.5/10.0
- 1% rule +3.4/10.0
- Rent growth +3.4/5.0
- Condition / age +2.5/5.0
- Appreciation +0.0/10.0
$215,000
🖨 Deal sheet (PDF) 📄 Offer letter ✓ Due diligence
Listing remarks
For sale by owner in Norfolk! This home has had some solid updates, including a newer roof (2025), updated appliances, a large 4-car driveway, and a fenced-in yard. There & acirc; & euro; & trade; s also a front porch that & acirc; & euro; & trade; s great for sitting outside and relaxing. Inside has a comfortable layout with good natural light and is easy to make your own, whether you & acirc; & euro; & trade; re looking for a primary home or an investment. Convenient location close to shops, restaurants, and main roads. No agent fees. Open to a quick, straightforward closing. Message me if you want more info or to come take a look!
Key facts
- Built 1919
Neighborhood map
What this means for you Summary
Snapshot
- This is a 3-bed/1.5-bath single-family listed at $215k.
Deal economics
- At list price, monthly cash flow is $25 ($305/yr) — positive.
- The deal already cash-flows at list — no discount required.
- To meet the 1% rule (rent ≥ 1% of price), the offer needs to be $180k (16.4% below list).
- Recommended offer: $180k (16.4% below list) — sets the bar for 1% rule.
- Cap rate 6.4% vs local median 4.0% in Norfolk — top-decile yield for the area; either an underpriced asset or a hidden risk that comps aren't pricing in. Stress-test before assuming the spread holds.
Location & tenants
- Location reads 83/100 on livability (#43 in VA, #1,026 nationally) — a professional / high-income tenant draw. Strengths: amenities A+, commute A+, health & safety A+; Watch: employment C-, crime F.
- Norfolk City Public School District (urban): math 27% / reading 56% proficiency, ranked #118 of 131 in VA (top 90%) — families likely to look elsewhere, expect single-tenant / working-renter base with shorter leases.
- Zoned schools: Ghent K-8 (math 47% / reading 75%, grade B, #524 of 1,108 statewide, top 48%, 482 students, 97% FRL); Blair Middle (math 29% / reading 57%, grade D-, #288 of 342 statewide, top 85%, 1,149 students, 92% FRL); Matthew Fontaine Maury High (math 46% / reading 90%, grade B, #180 of 319 statewide, top 57%, 1,697 students, 96% FRL) — zoned schools average 95% FRL vs 59% district-wide (36 pts higher); higher-poverty schools than district average — tighter screening recommended.
- Zoned-school proficiency averages 57% at this address vs 42% district-wide (+16 pts) — the actual schools serving this property are materially stronger than the Norfolk City Public School District average implies; a family-tenant draw the district grade alone would hide.
- Market conditions: Rents rising (+3.4%/yr); 32 active listings in the ZIP; 40 comparable units currently listed for rent nearby; rentals at typical pace (median 19d on market — plan ~3-4 weeks tenant-placement turnaround); 438 units permitted in Norfolk city in 2024 (273 in 5+ unit buildings).
- This rent runs 32% of the median local income ($67k/yr) — at the standard rent-burdened threshold; future hikes will face affordability resistance.
Forward outlook
- Local home prices are declining (-3.0%/yr); year-one equity from $1k of loan paydown is wiped out by about $6k of value loss. Plan a longer hold.
Negotiation context
- Only 0 days on market — expect competitive offers; lowballing is unlikely to land.
- 3 sale attempts since 8y ago with the ask held roughly flat each time — persistent listings suggest the price (not the market) is what's stuck; bring a comps-based counter.
- Current owner paid $161k; 34% above their basis — modest negotiation headroom, anchor on the comps not their cost.
Risks & watch-outs
- Watch-outs: built in 1919 — expect roof / HVAC / electrical / plumbing capex.
- Climate carrying-cost: severe wind risk, 80% chance of damaging wind over 30y; extreme-heat days projected 7→16/yr by 2055 (HVAC capex compounding) — expect insurance premiums to compound above CPI over the hold.
Questions for the listing agent
- Built in 1919 — when were the roof, HVAC, electrical panel, plumbing, and water heater last replaced?
- Is there a deadline driving the sale (1031 exchange, divorce, estate, relocation)? That informs how much negotiation room exists.
- Schools are A-rated — typically a magnet for longer-tenancy family renters. What's the average tenant stay here, and is there a school-zone premium baked into asking?
- Crime grade is F in this area — have there been break-ins, vandalism, or insurance claims at this property in the last 3 years? What carrier currently insures it and at what premium?
- What's the average days-on-market for RENTAL listings here right now (not sales)? A rising rental-DOM trend means longer vacancies and softer asking-rent achievability than the comps imply.
- What's the recent tenant-quality profile in this submarket — average credit score on applications, eviction rate, late-payment / NSF rate, and stable-employment percentage? A property-management company in the area should have these aggregated.
- How much new for-sale + rental construction is in the pipeline within 1–3 miles? Heavy new supply typically softens prices + rents 12–24 months out; constrained supply supports both.
Investment metrics
- 1% rule
- 0.84% ✗
- Cap rate
- 6.43%
- Cash-on-cash
- 0.51%
- DSCR
- 1.02
- GRM
- 10.0
CMA / ARV
- ARV (on-the-fly)
- $259,740
- Comps found
- 12
Show comp detail 12 sales within ~0.75 mi
| Address | Dist | Beds/Ba | Sqft | Sold | Price | $/sf | Match |
|---|---|---|---|---|---|---|---|
| 537 W 27th St | 0.00mi | 3/1.5 | 1,170 (0%) | 1mo | $215,000 | $184 | 99 |
| 726 W 27th St | 0.18mi | 3/1.5 | 1,089 (-7%) | 4mo | $305,000 | $280 | 77 |
| 4400 Colonial Ave | 0.70mi | 3/1.5 | 1,184 (+1%) | 2mo | $359,000 | $303 | 64 |
| 824 W 41st St | 0.63mi | 3/1.0 | 1,206 (+3%) | 1mo | $235,000 | $195 | 63 |
| 609 Virginia Ave | 0.57mi | 3/1.5 | 1,216 (+4%) | 8mo | $270,000 | $222 | 61 |
| 237 W 27th St | 0.31mi | 3/2.0 | 1,300 (+11%) | 7mo | $295,000 | $227 | 59 |
| 839 W 42nd St | 0.67mi | 4/2.0 (+1) | 1,188 (+2%) | 1mo | $171,000 | $144 | 58 |
| 868 W 36th St | 0.48mi | 3/1.5 | 1,300 (+11%) | 2mo | $251,000 | $193 | 58 |
| 715 Maryland Ave | 0.66mi | 3/2.0 | 1,276 (+9%) | 2mo | $375,000 | $294 | 50 |
| 1043 W 37th St | 0.58mi | 2/1.0 (-1) | 1,049 (-10%) | 6mo | $240,000 | $229 | 43 |
| 835 W 42nd St | 0.67mi | 4/1.5 (+1) | 1,300 (+11%) | 2mo | $165,000 | $127 | 43 |
| 1041 W 37th St | 0.58mi | 2/1.0 (-1) | 1,014 (-13%) | 4mo | $215,000 | $212 | 41 |
Match score weights: distance 35% · size 25% · config 20% · recency 20%. Top-matched comps best support the ARV.
Projected returns pro-forma
-3.0% appreciation · 3.44% rent growth · sell at horizon
- IRR
- -15.0%
- Equity multiple
- 0.46×
- Total profit
- $-32,449
- Equity at exit
- $32,057
- IRR
- -5.8%
- Equity multiple
- 0.62×
- Total profit
- $-22,979
- Equity at exit
- $18,589
Cash invested: $60,200 (down + closing). Projections, not guarantees.
Landlord ↔ Tenant lean methodology
- Overall (STATE)
- 55 Moderately Landlord-Leaning
- State Virginia
- 55 Moderately Landlord-Leaning · D+2
- County
- — inherits STATE
- City
- — inherits STATE
ZIP-level market 23517
- Home prices YoY
- -20.0%
- Rents YoY
- 3.4%
- Active inventory
- 32
- Price-to-rent
- 10.0×
Monthly cashflow live
- Estimated rent
- $1,797 high interval (Pro) →
- Mortgage (P&I)
- −$1,127
- Tax from tax record
- −$177 /mo · $2,128/yr
- Insurance
- −$90
- HOA
- −$0
- Vacancy / Maint / Mgmt
- −$377
- Net cashflow
- $25
Break-even live
Sensitivity live
| Price | -10% $147 | -5% $86 | +0% $25 | +5% $-35 | +10% $-96 |
|---|---|---|---|---|---|
| Rent | -10% $-117 | -5% $-46 | +0% $25 | +5% $96 | +10% $167 |
| Rate | -1.0pp $134 | -0.5pp $80 | base $25 | +0.5pp $-30 | +1.0pp $-87 |
UW: 25.0% down · 7.5% · 30yr · 1.5% tax · 5.0% vac · 8.0% maint · 8.0% mgmt
Financing live
Cash to close
- Down payment
- $53,750
- Closing costs
- $6,450
- Reserves months
- —
- Total cash needed
- —
Loan-product check · same deal, 3 products live
Conventional
25% down · 7.5% · 30yr
- Down + closing
- —
- Monthly P&I
- —
- Monthly cashflow
- —
- DSCR
- —
- Eligible?
- —
Personal DTI + credit; lowest rate.
DSCR
20% down · 8.5% · 30yr
- Down + closing
- —
- Monthly P&I
- —
- Monthly cashflow
- —
- DSCR
- —
- Eligible?
- —
No personal income docs; deal must DSCR.
Hard money
10% down · 12.0% · 12mo
- Down + closing
- —
- Monthly P&I
- —
- Monthly cashflow
- —
- DSCR
- —
- Eligible?
- —
Short-term bridge; refi at stabilization.
Rent comps 40 comps
| Address | Beds | Baths | Sqft | Rent | $/sqft | DOM | Units | Dist |
|---|---|---|---|---|---|---|---|---|
| 417 W 27th St Unit F Norfolk, VA | 3.0 | 2.0 | 1200 | $1,600 | $1.33 | 22d | 1 | 0.13mi |
| 417 W 27th St Unit F Norfolk, VA | 3.0 | 2.0 | 1200 | $1,600 | $1.33 | 16d | 1 | 0.13mi |
| 601 W 24th St Norfolk, VA | 1.0–2.0 | 1.0–2.0 | 722 | $2,045 | $2.83 | 3d | 2 | 0.20mi |
| 400 W 30th St Norfolk, VA | 3.0 | 1.5 | 1120 | $1,985 | $1.77 | 45d | 1 | 0.23mi |
| 309 W 26th St Unit A Norfolk, VA | 2.0 | 1.0 | 900 | $1,525 | $1.69 | 18d | 1 | 0.24mi |
| 325 W 31st St Unit 6 Norfolk, VA | 3.0 | 1.0 | 1400 | $1,750 | $1.25 | 25d | 1 | 0.27mi |
| 415 W 32nd St Unit 1 Norfolk, VA | 2.0 | 1.0 | 850 | $1,325 | $1.56 | 45d | 1 | 0.27mi |
| 812 W 27th St Unit 1 Norfolk, VA | 2.0 | 1.0 | 750 | $1,295 | $1.73 | 9d | 1 | 0.28mi |
| 2202 Llewellyn Ave Norfolk, VA | 2.0 | 2.0 | 980 | $1,971 | $2.01 | 9d | 1 | 0.37mi |
| 225 W 31st St Unit D Norfolk, VA | 2.0 | 1.0 | 925 | $975 | $1.05 | 9d | 1 | 0.37mi |
| 3210 Llewellyn Ave Norfolk, VA | 2.0 | 1.0 | 800 | $975 | $1.22 | 45d | 1 | 0.39mi |
| 3700 Gosnold Ave Unit A Norfolk, VA | 2.0 | 1.0 | 700 | $1,300 | $1.86 | 25d | 1 | 0.40mi |
| 204 W 22nd St Norfolk, VA | 1.0–2.0 | 1.0–2.0 | 907 | $2,065 | $2.28 | 4d | 3 | 0.42mi |
| 742 Washington Park Unit A5 Norfolk, VA | 2.0 | 1.0 | 944 | $1,450 | $1.54 | 16d | 1 | 0.43mi |
| 742 Washington Park Unit A5 Norfolk, VA | 2.0 | 1.0 | 994 | $1,450 | $1.46 | 18d | 1 | 0.43mi |
| 742 Washington Park Unit B4 Norfolk, VA | 2.0 | 1.0 | 1054 | $2,000 | $1.90 | 14d | 1 | 0.43mi |
| 305 W 36th St Norfolk, VA | 2.0 | 1.0 | 1271 | $1,495 | $1.18 | 5d | 1 | 0.46mi |
| 819 W 38th St Unit 5 Norfolk, VA | 2.0 | 1.0 | 1000 | $1,200 | $1.20 | 21d | 1 | 0.48mi |
| 201 W 21st St Norfolk, VA | 1.0–2.0 | 1.0–2.0 | 992 | $2,199 | $2.22 | 3d | 5 | 0.48mi |
| 1016 W 24th St Norfolk, VA | 3.0 | 1.0–2.0 | 771 | $1,655 | $2.15 | 25d | 20 | 0.48mi |
| 810 Brandon Ave Norfolk, VA | 3.0 | 1.0 | 1420 | $2,350 | $1.65 | 16d | 1 | 0.49mi |
| 201 W 34th St Unit 3 Norfolk, VA | 2.0 | 1.0 | 750 | $995 | $1.33 | 45d | 1 | 0.49mi |
| 868 W 36th St Norfolk, VA | 3.0 | 1.5 | 1300 | $2,500 | $1.92 | 14d | 1 | 0.49mi |
| 201 W 34th St Unit 7 Norfolk, VA | 2.0 | 1.0 | 750 | $1,099 | $1.47 | 20d | 1 | 0.49mi |
| 628 Georgia Ave Norfolk, VA | 3.0 | 2.0 | 1300 | $2,495 | $1.92 | 25d | 1 | 0.50mi |
| 832 Brandon Ave Unit A5 Norfolk, VA | 2.0 | 1.0 | 875 | $1,650 | $1.89 | 25d | 1 | 0.51mi |
| 858 37th St Unit A Norfolk, VA | 3.0 | 1.5 | 1150 | $1,950 | $1.70 | 18d | 1 | 0.52mi |
| 1512 Colonial Ave Unit B Norfolk, VA | 2.0 | 1.0 | 1050 | $1,575 | $1.50 | 9d | 1 | 0.53mi |
| 435 Virginia Ave Norfolk, VA | 2.0 | 2.0 | 1012 | $1,954 | $1.93 | 5d | 1 | 0.56mi |
| 731 Shirley Ave Unit 1 Norfolk, VA | 3.0 | 1.0 | 1200 | $1,950 | $1.62 | 45d | 1 | 0.57mi |
| 829 Spotswood Ave Unit B Norfolk, VA | 3.0 | 2.0 | 1250 | $2,150 | $1.72 | 16d | 1 | 0.57mi |
| 3601 Omohundro Ave Unit 3 Norfolk, VA | 2.0 | 1.0 | 800 | $1,395 | $1.74 | 45d | 1 | 0.57mi |
| 1037 37th St Apt B Norfolk, VA | 2.0 | 1.0 | 803 | $1,100 | $1.37 | 45d | 1 | 0.58mi |
| 4013 Colley Ave Norfolk, VA | 4.0 | 2.0 | 1450 | $2,600 | $1.79 | 45d | 1 | 0.60mi |
| 1045 37th St Unit A Norfolk, VA | 3.0 | 1.0 | 950 | $1,600 | $1.68 | 45d | 1 | 0.61mi |
| 527 Maryland Ave Norfolk, VA | 3.0 | 1.0 | 1200 | $2,000 | $1.67 | 45d | 1 | 0.61mi |
| 1323 Colonial Ave #4 Norfolk, VA | 2.0 | 1.0 | 786 | $2,200 | $2.80 | 12d | 1 | 0.63mi |
| 1009 Brandon Ave Unit 6 Norfolk, VA | 2.0 | 1.0 | 1400 | $1,500 | $1.07 | 14d | 1 | 0.67mi |
| 1300 Stockley Gdns #206 Norfolk, VA | 2.0 | 2.0 | 1000 | $2,000 | $2.00 | 12d | 1 | 0.67mi |
| 726 W Princess Anne Rd Unit 2 Norfolk, VA | 3.0 | 2.0 | 1265 | $1,695 | $1.34 | 5d | 1 | 0.70mi |
Listing history 8 events
-
2026-05-26$215,000
-
2021-09-14soldstatus $160,550
-
2021-08-03status Under Contract
-
2021-07-22historical Active Under Contract
-
2021-07-09price $159,000
-
2021-06-09$165,000 Active
-
2018-11-28status Under Contract
-
2018-10-17$80,000 Active
ⓘ Source: listings_history table (triggers on properties + properties_extension) + one-shot
backfill from property_details.listing_events for pre-trigger history.
Tax reassessment forecast VA · Resets to sale price
- Current annual tax
- $2,128 · $177/mo
- Projected year-2 tax
- $2,128 · $177/mo
- Expected delta
- $0/yr ($0/mo · 0.0%)
ⓘ Screening estimate from a state-policy table — verify with the county assessor before closing.
Climate risk First Street
- Flood 4/10 Moderate FEMA zone X (unshaded) · 13% chance over 30 yrs
- Wildfire 1/10 Low
- Heat 9/10 Extreme 7 d/yr ≥106°F today · 16 d/yr by 30 yrs out
- Wind 8/10 Severe 80% chance of damaging wind over 30 yrs
- Air quality 3/10 Moderate 2 unhealthy d/yr today · 5 by 30 yrs out
Nearby sold comps map
Loading sold comps map…
Walkable amenities ~0.75 mi
Loading nearby amenities…
Taxation est. · year 1
- Rental income
- $21,567
- − Mortgage interest
- −$12,043
- − Property taxes
- −$2,128
- − Insurance
- −$1,075
- − Repairs & maintenance
- −$1,725
- − Management
- −$1,725
- − Depreciation
- −$6,255
- Taxable loss
- −$3,384
- Est. tax savings @ 24.0%
- +$812
- After-tax cash flow
- $1,118/yr
For passive investors: Depreciation is non-cash, so a rental often shows a tax loss while cash-flowing — sheltering income. Rental losses are passive: they offset passive income freely, and up to $25,000/yr can offset ordinary (W-2) income if you actively participate and your MAGI is under $100k (phasing out to $0 by $150k); unused losses carry forward. On sale, claimed depreciation is recaptured at up to 25%, and gains may owe capital-gains tax (a 1031 exchange can defer both). Figures are a year-1 estimate at your 24.0% rate — not tax advice; consult a CPA.
Schools (NCES district)
- District
- Norfolk City Public School District
- NCES district ID
- 5102670
- Math proficiency
- 27% ▼ -44.00%
- Reading proficiency
- 56% ▼ -10.00%
- Median HH income
- $44,358
- Composite
- 35.08/100
- National rank
- #5026
- State rank
- #118 of 131 in VA
Livability — Norfolk
- Score
- 83/100
- State rank
- #43
- US rank
- #1026
Category grades
Schools grade is shown separately in the Schools card above.
Census & demographics
- Census place
- Norfolk, VA
- County
- Norfolk City · 214,042 people
- City population
- 214,042
- Metro
- Virginia Beach-Norfolk-Newport News, VA-NC
- Population (ZIP)
- 4,932
- Household income
- $67,375
- Rent vs Own
- Severe rent burden
- 463.0
Population outlook (Norfolk County) Hauer SSP2
- Today (2025)
- 249,032 people
- By 2030
- 252,347 · +1.3%
- By 2040
- 253,644 · +1.9%
- By 2050
- 251,913 · +1.2%
- By 2075
- 245,281 · -1.5%
- By 2100
- 219,548 · -11.8%
Race, ethnicity, and origin ACS 2023
- Neighborhood character
- Diverse neighborhood (Simpson 0.56)
- Race & ethnicity
- White 62% Black 21% Hispanic / Latino 9% Two or more races 6% Asian 4%
- Hispanic origin (detail)
- Mexican 6%
- Common ancestry
- Lithuanian 4% Romanian 4% Portuguese 3%
- Foreign-born
- 8% · Canada, South Korea
- Languages at home
- 87% English-only · Spanish 6% Other Indo-European 1% German/W. Germanic 1%
Political lean MEDSL · Norfolk
- 2024 margin
- Solid D (+41.5) · D 70.0% · R 28.5% · Other 1.6%
- 2008→2024 swing
- -1.4pp toward R · 2008: 43.0pp · 2024: 41.5pp
- All cycles
- 2024: D+41.5 2020: D+45.6 2016: D+42.0 2012: D+44.0 2008: D+43.0
Not yet ingested
- Civics
- —
Market trends
- HPI YoY
- ▼ -68.26%
- Current HPI
- 273.4702
- Rent YoY
- ▲ 3.44%
- Metro
- Virginia Beach-Norfolk-Newport News, VA-NC
- State GDP YoY
- ▲ 2.40%
- F500 in state
- 50
Industry mix (Fortune 500 HQ in VA)
| Industry | F500 HQs | Revenue |
|---|---|---|
| Aerospace / Defense | 4 | $236B |
|
||
| Technology / Defense | 3 | $32B |
|
||
| Financial Services | 2 | $176B |
|
||
| Utilities | 2 | $27B |
|
||
| Insurance | 2 | $25B |
|
||
| Technology | 2 | $15B |
|
||
Price history
+168.8% since first listed8 events — show timeline
- 2026-05-26 Listed $215,000 FSBO.com
- 2021-09-14 Sold (Public Records) $160,550 Public Records
- 2021-08-03 Pending — REINMLS
- 2021-07-22 Contingent — REINMLS
- 2021-07-09 Price Changed $159,000 REINMLS
- 2021-06-09 Listed $165,000 REINMLS
- 2018-11-28 Pending — REINMLS
- 2018-10-17 Listed $80,000 REINMLS
Property tax history
+5.5%/yrLatest (2025): $2,128 · +5.4% YoY. Source: county tax records.
Cash-flow waterfall
monthlySold comps — $/sqft
last 12 mo · ≤1 miLoading sold comps…