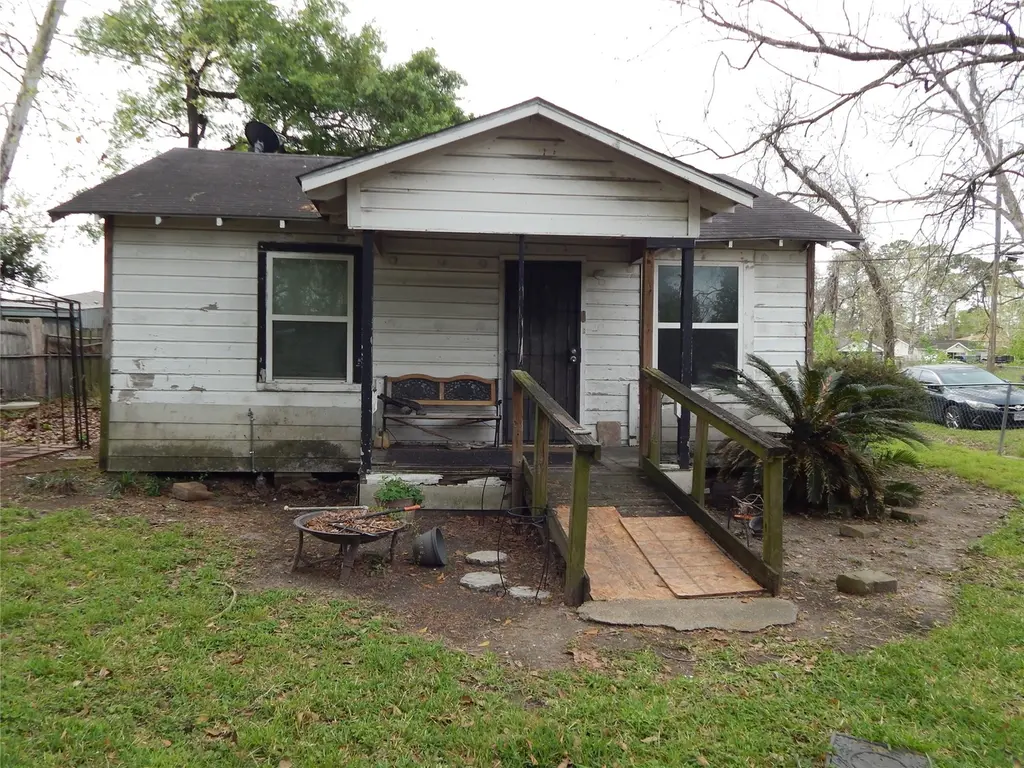
2449 Garwood Dr · Houston, TX
Flood risk 7/10 · Major
- FEMA flood zone
- X (unshaded)
- Chance of flooding over 30 yrs
- 0.99%
- Est. flood insurance / yr
- $507 – $1,088
Fire risk 1/10 · Minimal
- Est. fire insurance / yr
- $1,222 – $2,270
Heat risk 9/10 · Severe
- Hot days now (above 109°F)
- 7 days/yr
- Hot days in 30 yrs
- 24 days/yr
Wind risk 9/10 · Severe
- Chance of severe wind over 30 yrs
- 99.0%
Air-quality risk 3/10 · Minor
- Unhealthy air days now
- 3 days/yr
- Unhealthy air days in 30 yrs
- 4 days/yr
Risk factors via First Street. Map © Google.
Why this score? — see what drove the C grade
The composite is a weighted blend of 9 inputs, each scored 0–100. Each bar is that input's sub-score; the figure is the points it added to the 100-point composite (weight × sub-score).
- Cash flow +21.0/30.0
- ARV discount +15.0/15.0
- DSCR +6.7/10.0
- 1% rule +6.4/10.0
- Livability +3.7/5.0
- Rent growth +3.0/5.0
- Condition / age +2.5/5.0
- Schools +1.5/10.0
- Appreciation +0.0/10.0
$120,000
🖨 Deal sheet 📄 Offer letter ✓ Due diligence
Listing remarks MLS
This quaint residence is full of character, waiting for a personal touch. With three bedrooms and one bath, this corner lot property offers ample potential. The home is ready for updates; the kitchen boasts generous counter space. Washer and dryer connections are conveniently located inside. Stay cool with window air conditioning units. Ideal for homeowners or investors looking to add value. Buyer to verify room measurements.
Key facts
- Corner lot
- 5,353 sq ft lot
- Built 1936
Tags
Neighborhood map
What this means for you Summary
Snapshot
- This is a 2-bed/1.0-bath single-family listed at $120k.
Deal economics
- At list price, monthly cash flow is $103 ($1k/yr) — positive.
- The deal already cash-flows at list — no discount required.
- Meets the 1% rule at list price ($1k rent vs $120k).
- Recommended offer: $113k (6.0% below list) — sets the bar for market timing.
- Cap rate 8.0% vs local median 3.2% in Houston — top-decile yield for the area; either an underpriced asset or a hidden risk that comps aren't pricing in. Stress-test before assuming the spread holds.
Location & tenants
- Location reads 74/100 on livability (#184 in TX, #4,771 nationally) — a middle-class / working-renter tenant base. Strengths: amenities A+, cost of living A+, housing A+; Watch: schools D, crime F.
- Aldine ISD (suburban): math 16% / reading 21% proficiency, ranked #790 of 826 in TX (top 96%) — low school quality limits family demand, transient renter base, plan for 1-2y turnover; 79% free/reduced lunch — lower-income household profile, screen leases tightly.
- Market conditions: Rents rising (+2.1%/yr); 675 active listings in the ZIP; 24 comparable units currently listed for rent nearby; rentals at typical pace (median 15d on market — plan ~3-4 weeks tenant-placement turnaround); lower-income renter base — watch delinquency; 29,883 units permitted in Harris County in 2024 (8,621 in 5+ unit buildings).
- At $1,369/mo this rent would consume 46% of the median local household income ($35k/yr) (locally 3210% of renters already pay >50% of income on rent) — very limited rent-growth headroom before tenants either downsize or default.
Forward outlook
- Local home prices are declining (-3.0%/yr); year-one equity from $830 of loan paydown is wiped out by about $4k of value loss. Plan a longer hold.
- Harris County population projected at +47% by 2050 — long-run rental-demand tailwind backs the buy-and-hold thesis.
Negotiation context
- It's been on market 85 days — a 6% lower offer ($113k) is reasonable based on typical stale-listing flexibility.
Risks & watch-outs
- Watch-outs: flood insurance adds $66/mo; built in 1936 — expect roof / HVAC / electrical / plumbing capex.
- Climate carrying-cost: major flood risk; severe wind risk, 99% chance of damaging wind over 30y; extreme-heat days projected 7→24/yr by 2055 (HVAC capex compounding) — expect insurance premiums to compound above CPI over the hold.
Questions for the listing agent
- It's been on market 85 days. Have you received any prior offers? Is the seller open to a 6% concession, seller financing, or rate buy-down credit?
- Built in 1936 — when were the roof, HVAC, electrical panel, plumbing, and water heater last replaced?
- What's the actual annual flood-insurance premium (NFIP or private), and is the property in a SFHA with mandatory coverage?
- Why hasn't it sold? Are there any deal-killer items the seller is aware of (foundation, flood, title, zoning, code violations)?
- Is there a deadline driving the sale (1031 exchange, divorce, estate, relocation)? That informs how much negotiation room exists.
- Schools are D-rated, which usually means shorter tenancies and higher turnover. Who's the typical renter profile here, and what's been the actual vacancy rate?
- Crime grade is F in this area — have there been break-ins, vandalism, or insurance claims at this property in the last 3 years? What carrier currently insures it and at what premium?
- What's the average days-on-market for RENTAL listings here right now (not sales)? A rising rental-DOM trend means longer vacancies and softer asking-rent achievability than the comps imply.
- What's the recent tenant-quality profile in this submarket — average credit score on applications, eviction rate, late-payment / NSF rate, and stable-employment percentage? A property-management company in the area should have these aggregated.
- How much new for-sale + rental construction is in the pipeline within 1–3 miles? Heavy new supply typically softens prices + rents 12–24 months out; constrained supply supports both.
Investment metrics
- 1% rule
- 1.14% ✓
- Cap rate
- 7.99%
- Cash-on-cash
- 6.04%
- DSCR
- 1.27
- GRM
- 7.3
CMA / ARV
- ARV (median comp)
- $154,400
- List price
- $120,000
- Delta
- -22.28%
- Verdict
- UNDERPRICED
- Comps
- 20 within 1.0 mi
Show comp detail 12 sales within ~0.75 mi
| Address | Dist | Beds/Ba | Sqft | Sold | Price | $/sf | Match |
|---|---|---|---|---|---|---|---|
| 6707 Goldspier St | 0.15mi | 3/2.0 (+1) | 1,008 (-3%) | 3mo | $129,000 | $128 | 76 |
| 7050 Inwood Park Dr #113 | 0.37mi | 2/1.5 | 997 (-4%) | 3mo | $149,400 | $150 | 71 |
| 7111 Venus St | 0.22mi | 3/1.0 (+1) | 1,035 (-0%) | 16mo | $195,900 | $189 | 71 |
| 2438 Calvin St | 0.17mi | 3/1.0 (+1) | 1,104 (+6%) | 9mo | $144,000 | $130 | 70 |
| 2531 Walcott Ln | 0.23mi | 2/1.0 | 900 (-14%) | 6mo | $165,000 | $183 | 62 |
| 2409 Areba St | 0.18mi | 3/1.0 (+1) | 906 (-13%) | 13mo | $135,000 | $149 | 54 |
| 2122 De Soto St | 0.64mi | 3/1.0 (+1) | 1,052 (+1%) | 14mo | $550,000 | $523 | 52 |
| 2623 Homer St St | 0.48mi | 3/1.0 (+1) | 980 (-6%) | 21mo | $169,000 | $172 | 45 |
| 6814 Covington Dr | 0.51mi | 2/3.0 | 1,180 (+14%) | 3mo | $145,000 | $123 | 43 |
| 7407 Hezekiah Ln | 0.45mi | 3/2.0 (+1) | 1,148 (+10%) | 16mo | $199,900 | $174 | 39 |
| 5911 Shirley Mae Ln | 0.70mi | 3/1.5 (+1) | 1,081 (+4%) | 20mo | $214,000 | $198 | 37 |
| 7519 Dyer St | 0.64mi | 3/2.0 (+1) | 1,175 (+13%) | 14mo | $185,250 | $158 | 28 |
Match score weights: distance 35% · size 25% · config 20% · recency 20%. Top-matched comps best support the ARV.
Projected returns pro-forma
-3.0% appreciation · 2.1% rent growth · sell at horizon
- IRR
- -11.6%
- Equity multiple
- 0.58×
- Total profit
- $-14,017
- Equity at exit
- $17,892
- IRR
- -3.9%
- Equity multiple
- 0.75×
- Total profit
- $-8,273
- Equity at exit
- $10,375
Cash invested: $33,600 (down + closing). Projections, not guarantees.
Landlord ↔ Tenant lean methodology
- Overall (STATE)
- 87 Strongly Landlord-Friendly
- State Texas
- 87 Strongly Landlord-Friendly · R+5
- County
- — inherits STATE
- City
- — inherits STATE
ZIP-level market 77091
- Home prices YoY
- -24.9%
- Rents YoY
- 2.1%
- Active inventory
- 675
- Price-to-rent
- 7.3×
Monthly cashflow live
- Estimated rent
- $1,369 high interval (Pro) →
- Mortgage (P&I)
- −$629
- Tax from tax record
- −$233 /mo · $2,798/yr
- Insurance
- −$50
- Flood insurance flood zone
- −$66 /mo · $798/yr
- HOA
- −$0
- Vacancy / Maint / Mgmt
- −$288
- Net cashflow
- $103
Break-even live
UW: 25.0% down · 7.5% · 30yr · 1.5% tax · 5.0% vac · 8.0% maint · 8.0% mgmt
Financing live
Cash to close
- Down payment
- $30,000
- Closing costs
- $3,600
- Reserves months
- —
- Total cash needed
- —
Loan-product check · same deal, 3 products live
Conventional
25% down · 7.5% · 30yr
- Down + closing
- —
- Monthly P&I
- —
- Monthly cashflow
- —
- DSCR
- —
- Eligible?
- —
Personal DTI + credit; lowest rate.
DSCR
20% down · 8.5% · 30yr
- Down + closing
- —
- Monthly P&I
- —
- Monthly cashflow
- —
- DSCR
- —
- Eligible?
- —
No personal income docs; deal must DSCR.
Hard money
10% down · 12.0% · 12mo
- Down + closing
- —
- Monthly P&I
- —
- Monthly cashflow
- —
- DSCR
- —
- Eligible?
- —
Short-term bridge; refi at stabilization.
Rent comps 24 comps
| Address | Beds | Baths | Sqft | Rent | $/sqft | DOM | Units | Dist |
|---|---|---|---|---|---|---|---|---|
| 2602 Dalview St Unit B Houston, TX | 2.0 | 1.0 | 800 | $1,400 | $1.75 | 43d | 1 | 0.29mi |
| 7200 T C Jester Blvd Houston, TX | 1.0–3.0 | 1.0–2.0 | 1102 | $1,275 | $1.16 | 2d | 8 | 0.58mi |
| 7200 T C Jester Blvd Houston, TX | 1.0–3.0 | 1.0–2.0 | 970 | $1,188 | $1.22 | 22d | 9 | 0.58mi |
| 1825 W Little York Rd Houston, TX | 2.0 | 1.0 | 787 | $880 | $1.12 | 43d | 1 | 0.60mi |
| 7903 Moon Beam St Houston, TX | 3.0 | 2.5 | 1217 | $1,700 | $1.40 | 17d | 1 | 0.69mi |
| 8101 Venus St Unit A Houston, TX | 3.0 | 2.0 | 1375 | $1,699 | $1.24 | 24d | 1 | 0.84mi |
| 8101 Venus St Unit B Houston, TX | 3.0 | 2.0 | 1375 | $1,595 | $1.16 | 24d | 1 | 0.84mi |
| 2407 Ferguson Way Houston, TX | 3.0 | 2.5 | 1195 | $1,650 | $1.38 | 43d | 1 | 1.09mi |
| 2303 W Tidwell Rd Houston, TX | 2.0–3.0 | 2.0 | 1061 | $995 | $0.94 | 3d | 3 | 1.23mi |
| 5550 Holly View Dr Houston, TX | 1.0–2.0 | 1.0–2.0 | 698 | $1,025 | $1.47 | 24d | 17 | 1.28mi |
| 5555 Holly View Dr Houston, TX | 1.0–2.0 | 1.0–2.0 | 770 | $1,315 | $1.71 | 15d | 15 | 1.34mi |
| 1464 Ferguson Way Houston, TX | 2.0 | 3.0 | 850 | $1,850 | $2.18 | 43d | 1 | 1.40mi |
| 5500 De Soto St Unit 424 Houston, TX | 2.0 | 2.0 | 830 | $1,301 | $1.57 | 7d | 1 | 1.40mi |
| 5500 De Soto St Unit 2112 Houston, TX | 2.0 | 2.0 | 830 | $1,293 | $1.56 | 2d | 1 | 1.40mi |
| 5500 De Soto St Unit 5557 Houston, TX | 2.0 | 2.0 | 830 | $1,325 | $1.60 | 10d | 1 | 1.40mi |
| 6246 Antoine Dr Houston, TX | 1.0 | 1.0 | 742 | $860 | $1.16 | 43d | 1 | 1.43mi |
| 6240 Antoine Dr Unit 6273 Houston, TX | 3.0 | 2.0 | 1484 | $1,432 | $0.96 | 2d | 1 | 1.44mi |
| 6240 Antoine Dr Unit 6261 Houston, TX | 1.0 | 1.0 | 742 | $782 | $1.05 | 2d | 1 | 1.44mi |
| 6240 Antoine Dr Unit 6261 Houston, TX | 1.0 | 1.0 | 742 | $820 | $1.11 | 12d | 1 | 1.44mi |
| 6240 Antoine Dr Unit 422 Houston, TX | 2.0 | 2.0 | 890 | $989 | $1.11 | 7d | 1 | 1.44mi |
| 6240 Antoine Dr Houston, TX | 1.0 | 1.0 | 742 | $774 | $1.04 | 12d | 1 | 1.48mi |
| 5950 Antoine Dr Houston, TX | 1.0–2.0 | 1.0–2.0 | 795 | $1,347 | $1.69 | 22d | 1 | 1.49mi |
| 6240 Antoine Dr Unit 2047 Houston, TX | 2.0 | 2.0 | 890 | $981 | $1.10 | 2d | 1 | 1.49mi |
| 6240 Antoine Dr Unit 1047 Houston, TX | 1.0 | 1.0 | 742 | $825 | $1.11 | 11d | 1 | 1.49mi |
Listing history 15 events
-
2026-06-18days on market $120,000 Active 85 DOM
-
2026-06-17days on market $120,000 Active 84 DOM
-
2026-06-16days on market $120,000 Active 83 DOM
-
2026-06-15days on market $120,000 Active 82 DOM
-
2026-06-13days on market $120,000 Active 80 DOM
-
2026-06-13days on market $120,000 Active 79 DOM
-
2026-06-09days on market $120,000 Active 76 DOM
-
2026-06-08days on market $120,000 Active 75 DOM
-
2026-06-07days on market $120,000 Active 74 DOM
-
2026-06-04days on market $120,000 Active 71 DOM
-
2026-06-03days on market $120,000 Active 70 DOM
-
2026-06-02days on market $120,000 Active 69 DOM
-
2026-06-01days on market $120,000 Active 68 DOM
-
2026-05-31days on market $120,000 Active 67 DOM
-
2026-03-25$120,000 Active 429-char remark
Show marketing remark (429 chars)
This quaint residence is full of character, waiting for a personal touch. With three bedrooms and one bath, this corner lot property offers ample potential. The home is ready for updates; the kitchen boasts generous counter space. Washer and dryer connections are conveniently located inside. Stay cool with window air conditioning units. Ideal for homeowners or investors looking to add value. Buyer to verify room measurements.
ⓘ Source: listings_history table (triggers on properties + properties_extension) + one-shot
backfill from property_details.listing_events for pre-trigger history.
Tax reassessment forecast TX · Resets to sale price
- Current annual tax
- $2,798 · $233/mo
- Projected year-2 tax
- $2,798 · $233/mo
- Expected delta
- $0/yr ($0/mo · 0.0%)
ⓘ Screening estimate from a state-policy table — verify with the county assessor before closing.
Climate risk First Street
- Flood 7/10 Severe FEMA zone X (unshaded) · 99% chance over 30 yrs
- Wildfire 1/10 Low
- Heat 9/10 Extreme 7 d/yr ≥109°F today · 24 d/yr by 30 yrs out
- Wind 9/10 Extreme 99% chance of damaging wind over 30 yrs
- Air quality 3/10 Moderate 3 unhealthy d/yr today · 4 by 30 yrs out
Nearby sold comps map
Loading sold comps map…
Walkable amenities ~0.75 mi
Loading nearby amenities…
Taxation est. · year 1
- Rental income
- $16,430
- − Mortgage interest
- −$6,722
- − Property taxes
- −$2,798
- − Insurance
- −$1,398
- − Repairs & maintenance
- −$1,314
- − Management
- −$1,314
- − Depreciation
- −$3,491
- Taxable loss
- −$607
- Est. tax savings @ 24.0%
- +$146
- After-tax cash flow
- $1,379/yr
For passive investors: Depreciation is non-cash, so a rental often shows a tax loss while cash-flowing — sheltering income. Rental losses are passive: they offset passive income freely, and up to $25,000/yr can offset ordinary (W-2) income if you actively participate and your MAGI is under $100k (phasing out to $0 by $150k); unused losses carry forward. On sale, claimed depreciation is recaptured at up to 25%, and gains may owe capital-gains tax (a 1031 exchange can defer both). Figures are a year-1 estimate at your 24.0% rate — not tax advice; consult a CPA.
Schools (NCES district)
- District
- Aldine ISD
- NCES district ID
- 4807710
- Math proficiency
- 16% ▼ -23.00%
- Reading proficiency
- 21% ▼ -11.00%
- Median HH income
- $37,081
- Composite
- 15.42/100
- National rank
- #9317
- State rank
- #790 of 826 in TX
Livability — Houston
- Score
- 74/100
- State rank
- #184
- US rank
- #4771
Category grades
Schools grade is shown separately in the Schools card above.
Census & demographics
- Census place
- Houston, TX
- County
- Harris County · 4,702,590 people
- City population
- 3,226,434
- Metro
- Houston-The Woodlands-Sugar Land, TX
- Population (ZIP)
- 28,728
- Household income
- $35,432
- Rent vs Own
- Severe rent burden
- 3210.0
Population outlook (Harris County) Hauer SSP2
- Today (2025)
- 5,571,493 people
- By 2030
- 6,089,821 · +9.3%
- By 2040
- 7,142,806 · +28.2%
- By 2050
- 8,185,864 · +46.9%
- By 2075
- 10,574,329 · +89.8%
- By 2100
- 12,109,958 · +117.4%
Race, ethnicity, and origin ACS 2023
- Neighborhood character
- Diverse neighborhood (Simpson 0.58)
- Race & ethnicity
- Hispanic / Latino 46% Black 45% Two or more races 15% White 7%
- Hispanic origin (detail)
- Mexican 29%
- Common ancestry
- Italian 1%
- Foreign-born
- 24% · Canada, Jamaica
- Languages at home
- 55% English-only · Spanish 41% French/Haitian/Cajun 2%
Political lean MEDSL · Harris
- 2024 margin
- Lean D (+5.5) · D 52.0% · R 46.4% · Other 1.6%
- 2008→2024 swing
- +3.9pp toward D · 2008: 1.6pp · 2024: 5.5pp
- All cycles
- 2024: D+5.5 2020: D+13.3 2016: D+12.4 2012: D+0.1 2008: D+1.6
Not yet ingested
- Civics
- —
Market trends
- HPI YoY
- ▼ -94.19%
- Current HPI
- 283.7523
- Rent YoY
- ▲ 2.10%
- Metro
- Houston-The Woodlands-Sugar Land, TX
- State GDP YoY
- ▲ 3.95%
- F500 in state
- 110
Industry mix (Fortune 500 HQ in TX)
| Industry | F500 HQs | Revenue |
|---|---|---|
| Energy | 16 | $1,198B |
|
||
| Technology | 5 | $198B |
|
||
| Engineering / Construction | 4 | $72B |
|
||
| Energy Services | 3 | $60B |
|
||
| Utilities | 3 | $41B |
|
||
| Healthcare | 2 | $330B |
|
||
Price history
1 event — show timeline
- 2026-03-25 Listed $120,000 HARMLS
Property tax history
+13.1%/yrLatest (2025): $2,798 · +20.5% YoY. Source: county tax records.
Cash-flow waterfall
monthlySold comps — $/sqft
last 12 mo · ≤1 miLoading sold comps…