1281 Pleasant Valley Rd #44 · Diamond Springs, CA
Flood risk 1/10 · Minimal
- FEMA flood zone
- X (unshaded)
- Chance of flooding over 30 yrs
- 0.0%
- Est. flood insurance / yr
- $507 – $1,088
Fire risk 8/10 · Major
- Est. fire insurance / yr
- $659 – $1,223
Heat risk 6/10 · Moderate
- Hot days now (above 99°F)
- 7 days/yr
- Hot days in 30 yrs
- 17 days/yr
Wind risk 1/10 · Minimal
- Chance of severe wind over 30 yrs
- —
Air-quality risk 10/10 · Severe
- Unhealthy air days now
- 31 days/yr
- Unhealthy air days in 30 yrs
- 38 days/yr
Risk factors via First Street. Map © Google.
Why this score? — see what drove the B- grade
The composite is a weighted blend of 9 inputs, each scored 0–100. Each bar is that input's sub-score; the figure is the points it added to the 100-point composite (weight × sub-score).
- Cash flow +30.0/30.0
- 1% rule +10.0/10.0
- DSCR +10.0/10.0
- ARV discount +6.3/15.0
- Schools +3.2/10.0
- Rent growth +2.5/5.0
- Condition / age +2.5/5.0
- Livability +2.4/5.0
- Appreciation +0.0/10.0
$139,000
🖨 Deal sheet 📄 Offer letter ✓ Due diligence
Listing remarks
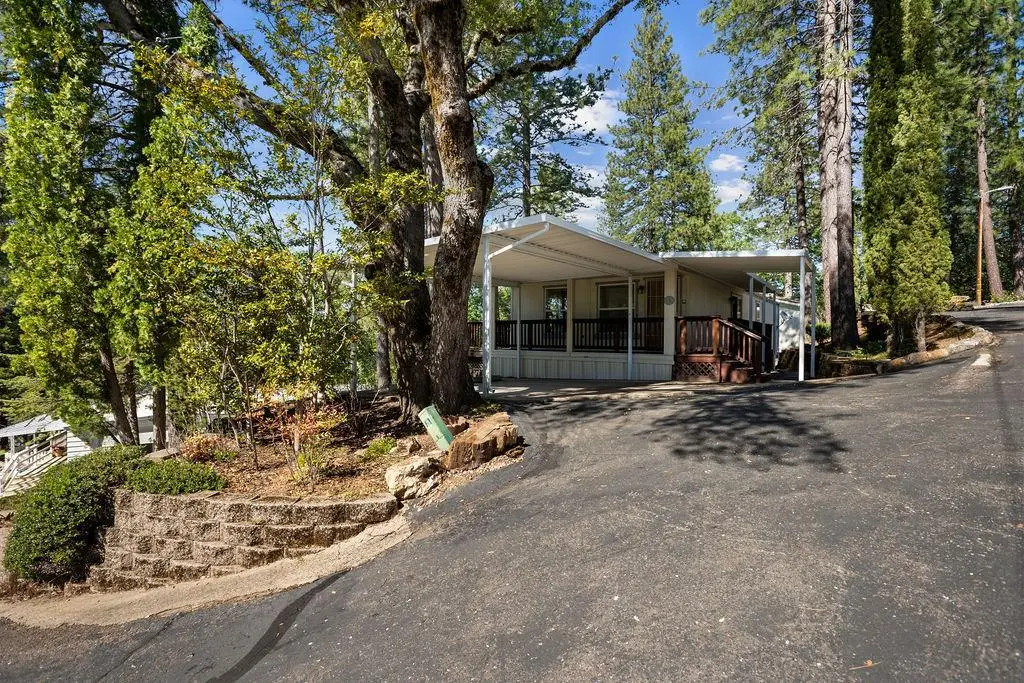
Welcome to Diamond Manor, a highly desirable 55 + senior community offering peaceful living in a private setting. This 3 bedroom, 2 bath home features a comfortable, functional floor plan with generous living and dining spaces. The combined open living space and dining area offers ample room for gatherings. The kitchen provides plenty of cabinet storage and workspace. The primary suite includes a private bath and lots of closet space, while two additional bedrooms offer flexibility for guests, hobbies, or office use. Outside, enjoy a quiet covered deck creating a sense of privacy. With the carport offering 2 covered side by side spaces and a storage shed located outside, this property offer
Key facts
- Covered deck
- Carport
- Storage shed
Tags
Property features AI
Finance
- Other: Lot features listed as none
- Financial info: Land lease: No (land lease amount listed separately)
- HOA & community: No homeowners association; Senior community
Exterior
- Parking: Covered parking
- Utilities: Propane; 220V in kitchen; Public sewer; Public water
- Home design: Manufactured home in park; Double-wide; Built in 1999
- Construction: Composition roof; Wood skirting; Manufactured by Golden West
- Exterior features: Porch; Storage shed(s)
Interior
- Kitchen: Gas cooktop; Free standing electric oven; Dishwasher; Disposal; Ice maker; Laminate counters
- Bedrooms: 3 bedrooms
- Flooring: Carpet; Vinyl
- Bathrooms: 2 full bathrooms; Tub with shower over
- Heating & cooling: Central heating; Central air conditioning; Ceiling fans
- Interior features: Great room living area; Dining and family room combo; Porch; Storage area
- Laundry & utility: Inside laundry room
Neighborhood map
What this means for you Summary
Snapshot
- This is a 3-bed/2.0-bath manufactured listed at $139k.
Deal economics
- At list price, monthly cash flow is $687 ($8k/yr) — positive.
- The deal already cash-flows at list — no discount required.
- Meets the 1% rule at list price ($2k rent vs $139k).
- Recommended offer: $131k (6.0% below list) — sets the bar for market timing.
- Cap rate 12.2% vs local median 2.3% in Diamond Springs — top-decile yield for the area; either an underpriced asset or a hidden risk that comps aren't pricing in. Stress-test before assuming the spread holds.
Location & tenants
- Location reads 47/100 on livability (#1,239 in CA) — a working-class tenant base; expect higher turnover. Strengths: housing B+; Watch: schools D, crime D-, amenities F.
- Gold Oak Union Elementary (rural): math 25% / reading 44% proficiency, ranked #262 of 517 in CA (top 51%) — families likely to look elsewhere, expect single-tenant / working-renter base with shorter leases.
- Market conditions: 30 active listings in the ZIP; 2 comparable units currently listed for rent nearby; 437 units permitted in El Dorado County in 2024 (0 in 5+ unit buildings).
Forward outlook
- Local home prices are declining (-3.0%/yr); year-one equity from $961 of loan paydown is wiped out by about $4k of value loss. Plan a longer hold.
- El Dorado County population projected to shrink 3% by 2050 — rents likely to lag national; underwrite the cash flow, not the appreciation.
- At projected returns (-3.0% appreciation + 3.0% rent growth), your $39k cash investment doubles in ~6 years — after that, you're playing with house money.
Negotiation context
- It's been on market 68 days — a 6% lower offer ($131k) is reasonable based on typical stale-listing flexibility.
Risks & watch-outs
- Climate carrying-cost: severe wildfire risk; extreme-heat days projected 7→17/yr by 2055 (HVAC capex compounding) — expect insurance premiums to compound above CPI over the hold.
Questions for the listing agent
- It's been on market 68 days. Have you received any prior offers? Is the seller open to a 6% concession, seller financing, or rate buy-down credit?
- Why hasn't it sold? Are there any deal-killer items the seller is aware of (foundation, flood, title, zoning, code violations)?
- Is there a deadline driving the sale (1031 exchange, divorce, estate, relocation)? That informs how much negotiation room exists.
- Schools are D-rated, which usually means shorter tenancies and higher turnover. Who's the typical renter profile here, and what's been the actual vacancy rate?
- Crime grade is D in this area — have there been break-ins, vandalism, or insurance claims at this property in the last 3 years? What carrier currently insures it and at what premium?
- What's the average days-on-market for RENTAL listings here right now (not sales)? A rising rental-DOM trend means longer vacancies and softer asking-rent achievability than the comps imply.
- What's the recent tenant-quality profile in this submarket — average credit score on applications, eviction rate, late-payment / NSF rate, and stable-employment percentage? A property-management company in the area should have these aggregated.
- How much new for-sale + rental construction is in the pipeline within 1–3 miles? Heavy new supply typically softens prices + rents 12–24 months out; constrained supply supports both.
Investment metrics
- 1% rule
- 1.50% ✓
- Cap rate
- 12.22%
- Cash-on-cash
- 21.18%
- DSCR
- 1.94
- GRM
- 5.6
CMA / ARV
- ARV (on-the-fly)
- $135,520
- Comps found
- 9
Show comp detail 9 sales within ~0.75 mi
| Address | Dist | Beds/Ba | Sqft | Sold | Price | $/sf | Match |
|---|---|---|---|---|---|---|---|
| 1281 Pleasant Valley Rd #31 | 0.04mi | 2/2.0 (-1) | 1,175 (+5%) | 1mo | $139,500 | $119 | 84 |
| 1281 Pleasant Vly #30 | 0.05mi | 2/2.0 (-1) | 1,056 (-6%) | 7mo | $128,000 | $121 | 78 |
| 4421 Big Cut Rd | 0.20mi | 2/2.0 (-1) | 1,152 (+3%) | 11mo | $207,250 | $180 | 72 |
| 1281 Pleasant Valley Rd #10 | 0.09mi | 3/2.0 | 1,260 (+12%) | 6mo | $112,000 | $89 | 70 |
| 1281 Pleasant Valley Rd #49 | 0.03mi | 2/2.0 (-1) | 1,056 (-6%) | 17mo | $170,000 | $161 | 70 |
| 1281 Pleasant Valley Rd #24 | 0.07mi | 2/2.0 (-1) | 1,248 (+11%) | 5mo | $110,000 | $88 | 68 |
| 1281 Pleasant Valley Rd #52 | 0.04mi | 2/2.0 (-1) | 960 (-14%) | 5mo | $124,500 | $130 | 65 |
| 1281 Pleasant Valley Rd #32 | 0.04mi | 2/2.0 (-1) | 1,040 (-7%) | 22mo | $125,000 | $120 | 63 |
| 1281 Pleasant Valley Rd #2 | 0.08mi | 2/2.0 (-1) | 960 (-14%) | 14mo | $140,000 | $146 | 56 |
Match score weights: distance 35% · size 25% · config 20% · recency 20%. Top-matched comps best support the ARV.
Projected returns pro-forma
-3.0% appreciation · 3.0% rent growth · sell at horizon
- IRR
- 13.7%
- Equity multiple
- 1.55×
- Total profit
- $21,266
- Equity at exit
- $20,725
- IRR
- 22.5%
- Equity multiple
- 2.93×
- Total profit
- $74,992
- Equity at exit
- $12,018
Cash invested: $38,920 (down + closing). Projections, not guarantees.
Landlord ↔ Tenant lean methodology
- Overall (STATE)
- 18 Strongly Tenant-Friendly
- State California
- 18 Strongly Tenant-Friendly · D+13
- County
- — inherits STATE
- City
- — inherits STATE
ZIP-level market 95619
- Active inventory
- 30
- Price-to-rent
- 5.6×
Monthly cashflow live
- Estimated rent
- $2,086 medium interval (Pro) →
- Mortgage (P&I)
- −$729
- Tax est. 1.5%
- −$174 /mo · $2,085/yr
- Insurance
- −$58
- HOA
- −$0
- Vacancy / Maint / Mgmt
- −$438
- Net cashflow
- $687
Break-even live
UW: 25.0% down · 7.5% · 30yr · 1.5% tax · 5.0% vac · 8.0% maint · 8.0% mgmt
Financing live
Cash to close
- Down payment
- $34,750
- Closing costs
- $4,170
- Reserves months
- —
- Total cash needed
- —
Loan-product check · same deal, 3 products live
Conventional
25% down · 7.5% · 30yr
- Down + closing
- —
- Monthly P&I
- —
- Monthly cashflow
- —
- DSCR
- —
- Eligible?
- —
Personal DTI + credit; lowest rate.
DSCR
20% down · 8.5% · 30yr
- Down + closing
- —
- Monthly P&I
- —
- Monthly cashflow
- —
- DSCR
- —
- Eligible?
- —
No personal income docs; deal must DSCR.
Hard money
10% down · 12.0% · 12mo
- Down + closing
- —
- Monthly P&I
- —
- Monthly cashflow
- —
- DSCR
- —
- Eligible?
- —
Short-term bridge; refi at stabilization.
Rent comps 2 comps
| Address | Beds | Baths | Sqft | Rent | $/sqft | DOM | Units | Dist |
|---|---|---|---|---|---|---|---|---|
| 4012 Wimbledon Dr Diamond Springs, CA | 3.0 | 2.5 | 1233 | $2,250 | $1.82 | 2d | 1 | 1.28mi |
| 579 Racquet Way Diamond Springs, CA | 2.0 | 2.0 | 968 | $1,900 | $1.96 | 2d | 1 | 1.37mi |
Listing history 13 events
-
2026-06-18days on market $139,000 Active 68 DOM
-
2026-06-17days on market $139,000 Active 67 DOM
-
2026-06-16days on market $139,000 Active 66 DOM
-
2026-06-15days on market $139,000 Active 65 DOM
-
2026-06-13days on market $139,000 Active 63 DOM
-
2026-06-13days on market $139,000 Active 62 DOM
-
2026-06-09days on market $139,000 Active 59 DOM
-
2026-06-08days on market $139,000 Active 58 DOM
-
2026-06-07days on market $139,000 Active 57 DOM
-
2026-06-03days on market $139,000 Active 53 DOM
-
2026-06-02days on market $139,000 Active 52 DOM
-
2026-06-01days on market $139,000 Active 51 DOM
-
2026-05-31days on market $139,000 Active 50 DOM
ⓘ Source: listings_history table (triggers on properties + properties_extension) + one-shot
backfill from property_details.listing_events for pre-trigger history.
Climate risk First Street
- Flood 1/10 Low FEMA zone X (unshaded) · 0% chance over 30 yrs
- Wildfire 8/10 Severe
- Heat 6/10 Major 7 d/yr ≥99°F today · 17 d/yr by 30 yrs out
- Wind 1/10 Low
- Air quality 10/10 Extreme 31 unhealthy d/yr today · 38 by 30 yrs out
Nearby sold comps map
Loading sold comps map…
Walkable amenities ~0.75 mi
Loading nearby amenities…
Taxation est. · year 1
- Rental income
- $25,028
- − Mortgage interest
- −$7,786
- − Property taxes
- −$2,085
- − Insurance
- −$695
- − Repairs & maintenance
- −$2,002
- − Management
- −$2,002
- − Depreciation
- −$4,044
- Taxable income
- $6,413
- Est. tax owed @ 24.0%
- −$1,539
- After-tax cash flow
- $6,705/yr
For passive investors: Depreciation is non-cash, so a rental often shows a tax loss while cash-flowing — sheltering income. Rental losses are passive: they offset passive income freely, and up to $25,000/yr can offset ordinary (W-2) income if you actively participate and your MAGI is under $100k (phasing out to $0 by $150k); unused losses carry forward. On sale, claimed depreciation is recaptured at up to 25%, and gains may owe capital-gains tax (a 1031 exchange can defer both). Figures are a year-1 estimate at your 24.0% rate — not tax advice; consult a CPA.
Schools (NCES district)
- District
- Gold Oak Union Elementary
- NCES district ID
- 0615390
- Math proficiency
- 25% ▼ -16.00%
- Reading proficiency
- 44% ▼ -7.00%
- Median HH income
- $68,012
- Composite
- 31.58/100
- National rank
- #5948
- State rank
- #262 of 517 in CA
Livability — Diamond Springs
- Score
- 47/100
- State rank
- #1239
- US rank
- #26264
Category grades
Schools grade is shown separately in the Schools card above.
Census & demographics
- Census place
- Diamond Springs, CA
- City population
- 6,362
- Population (ZIP)
- 6,362
Population outlook (El Dorado County) Hauer SSP2
- Today (2025)
- 191,666 people
- By 2030
- 193,662 · +1.0%
- By 2040
- 192,583 · +0.5%
- By 2050
- 185,904 · -3.0%
- By 2075
- 169,543 · -11.5%
- By 2100
- 139,623 · -27.2%
Race, ethnicity, and origin ACS 2023
- Neighborhood character
- Predominantly White (68%)
- Race & ethnicity
- White 68% Hispanic / Latino 24% Two or more races 5% Asian 3% Native American 1%
- Hispanic origin (detail)
- Mexican 22%
- Common ancestry
- Italian 9% Slovak 4% Russian 4%
- Foreign-born
- 6% · Canada, South Korea
- Languages at home
- 90% English-only · Spanish 7% Korean 1% French/Haitian/Cajun 1%
Political lean MEDSL · El Dorado
- 2024 margin
- R (+12.0) · D 42.6% · R 54.6% · Other 2.8%
- 2008→2024 swing
- -1.5pp toward R · 2008: -10.5pp · 2024: -12.0pp
- All cycles
- 2024: R+12.0 2020: R+8.8 2016: R+13.9 2012: R+18.2 2008: R+10.5
Not yet ingested
- Civics
- —
Market trends
- HPI YoY
- ▼ -137.93%
- Current HPI
- 248.9804
- Rent YoY
- —
- Metro
- —
- State GDP YoY
- ▲ 3.21%
- F500 in state
- 116
Industry mix (Fortune 500 HQ in CA)
| Industry | F500 HQs | Revenue |
|---|---|---|
| Technology | 27 | $1,492B |
|
||
| Financial Services | 3 | $174B |
|
||
| Retail | 3 | $44B |
|
||
| Insurance | 3 | $26B |
|
||
| Media / Entertainment | 2 | $115B |
|
||
| Pharmaceuticals / Biotech | 2 | $62B |
|
||
Property tax history
-0.1%/yrLatest (2023): $229 · -0.5% YoY. Source: county tax records.
Cash-flow waterfall
monthlySold comps — $/sqft
last 12 mo · ≤1 miLoading sold comps…