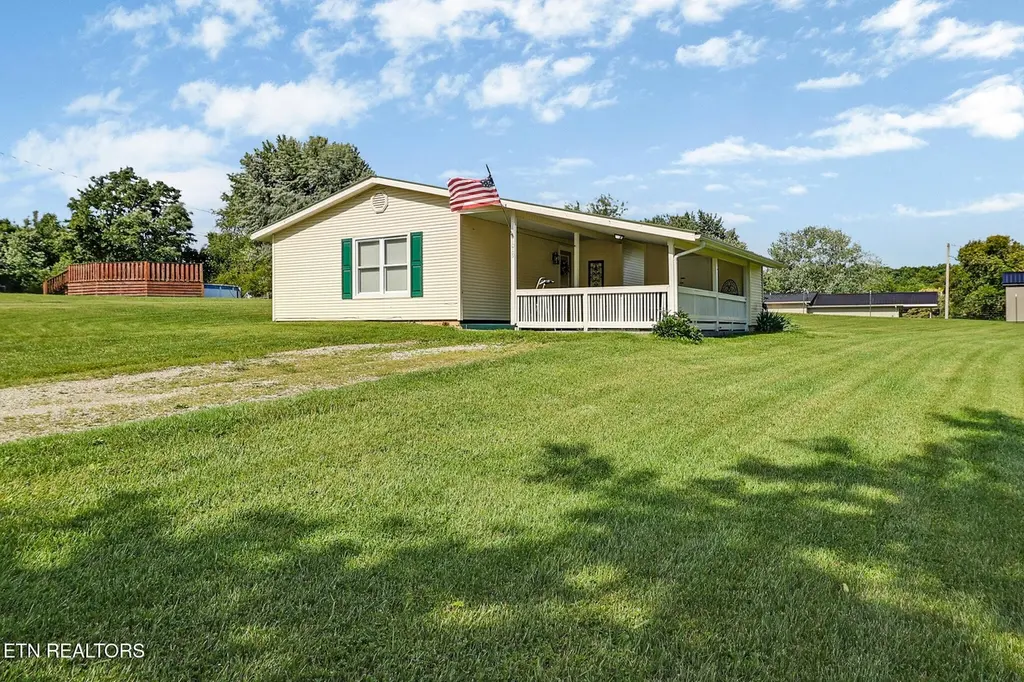
1019 Lincoln Rd · Jamestown, TN
Flood risk 1/10 · Minimal
- FEMA flood zone
- X (unshaded)
- Chance of flooding over 30 yrs
- 0.0%
- Est. flood insurance / yr
- $507 – $1,088
Fire risk 4/10 · Minor
- Est. fire insurance / yr
- $949 – $1,763
Heat risk 3/10 · Minor
- Hot days now (above 99°F)
- 7 days/yr
- Hot days in 30 yrs
- 20 days/yr
Wind risk 3/10 · Minor
- Chance of severe wind over 30 yrs
- 5.0%
Air-quality risk 2/10 · Minimal
- Unhealthy air days now
- 2 days/yr
- Unhealthy air days in 30 yrs
- 2 days/yr
Risk factors via First Street. Map © Google.
Why this score? — see what drove the D grade
The composite is a weighted blend of 9 inputs, each scored 0–100. Each bar is that input's sub-score; the figure is the points it added to the 100-point composite (weight × sub-score).
- Appreciation +10.0/10.0
- Cash flow +9.5/30.0
- ARV discount +8.9/15.0
- Livability +3.1/5.0
- 1% rule +2.9/10.0
- DSCR +2.7/10.0
- Rent growth +2.5/5.0
- Condition / age +2.5/5.0
- Schools +2.1/10.0
$189,900
🖨 Deal sheet (PDF) 📄 Offer letter ✓ Due diligence
Listing remarks MLS
Recently Remodeled 3 Bedroom, 2 Bath Home ,Just Outside Jamestown City Limits! Welcome home to this beautifully recently remodeled 3 bedroom, 2 bath residence located just outside the Jamestown city limits. Offering the perfect blend of comfort and convenience, this move-in ready home features updated flooring, fresh finishes, and a stylishly renovated kitchen complete with modern cabinetry, updated countertops, and an attractive tile backsplash. The spacious living area provides plenty of room for family gatherings, while the large covered front porch is the perfect place to relax and enjoy the peaceful country setting. Situated on a well-maintained lot with a gently rolling yard, there's plenty of space for outdoor activities, gardening, or entertaining. Conveniently located just minutes from shopping, dining, schools, and local amenities, this property offers the charm of country living with the convenience of town nearby. Don't miss your opportunity to own this beautifully updated home--schedule your private showing today! Buyer to verify all information and measurements in order to make an informed offer.
Key facts
- Recently remodeled
- Gently rolling yard
- Renovated kitchen
Tags
Property features AI
Exterior
- Parking: Attached parking; 1 covered space; 1 carport space (carport present); 1 total parking space
- Utilities: Public water; Septic tank; Electricity available; Water available
- Home design: Single family residence; One story; Residential property; Level lot
- Construction: Frame construction with vinyl siding; Slab foundation; Existing year built
- Exterior features: Covered porch
Interior
- Kitchen: Refrigerator; Oven
- Bedrooms: 3 bedrooms (all on main level)
- Flooring: Laminate
- Bathrooms: 2 full bathrooms
- Heating & cooling: Central heating (electric); Central air conditioning
- Interior features: Smoke detectors
- Laundry & utility: Washer hookup; Electric dryer hookup; Washer; Dryer
Neighborhood map
What this means for you Summary
Snapshot
- This is a 3-bed/1.0-bath single-family listed at $190k.
Deal economics
- At list price, monthly cash flow is $-132 ($-2k/yr) — negative.
- To cash-flow at today's rent, offer at most $171k (10.0% below list).
- To meet the 1% rule (rent ≥ 1% of price), the offer needs to be $149k (21.3% below list).
- Recommended offer: $149k (21.3% below list) — sets the bar for 1% rule.
Location & tenants
- Location reads 61/100 on livability (#250 in TN) — a middle-class / working-renter tenant base. Strengths: cost of living A+, health & safety A+; Watch: housing D, crime F, amenities F.
- Fentress County (rural): math 24% / reading 27% proficiency, ranked #91 of 139 in TN (top 66%) — low school quality limits family demand, transient renter base, plan for 1-2y turnover; 65% free/reduced lunch — lower-income household profile, screen leases tightly.
- Zoned schools: York Elementary (math 17% / reading 17%, grade F, #709 of 952 statewide, top 77%, 425 students, 0% FRL); Clarkrange High School (math 17% / reading 44%, grade F, #73 of 332 statewide, top 22%, 260 students, 0% FRL) — zoned schools average 0% FRL vs 65% district-wide (65 pts lower); this property's tenant base skews higher-income than the district average.
- Market conditions: 325 active listings in the ZIP.
Forward outlook
- In year one you build about $20k of equity ($1k loan paydown + $19k appreciation (10.0% local appreciation)).
- Fentress County population projected at -19% by 2050 — secular population decline; favor cash flow + early exit over multi-decade hold.
- By year 2, paydown + projected appreciation supports a ~$33k cash-out refi (75% LTV) — recoverable capital for the next deal without selling this one.
Negotiation context
- It's been on market 18 days — a 2% lower offer ($187k) is reasonable based on typical stale-listing flexibility.
- 3 sale attempts with the ask held roughly flat each time — persistent listings suggest the price (not the market) is what's stuck; bring a comps-based counter.
- Current owner paid $79k; list at $190k implies a 140% gain — meaningful room to come down on a strong offer.
Questions for the listing agent
- What do current leases actually rent for vs. the listed asking? Can we see a recent rent roll and the last 12 months of T-12 income?
- Is there a deadline driving the sale (1031 exchange, divorce, estate, relocation)? That informs how much negotiation room exists.
- Schools are F-rated, which usually means shorter tenancies and higher turnover. Who's the typical renter profile here, and what's been the actual vacancy rate?
- Crime grade is F in this area — have there been break-ins, vandalism, or insurance claims at this property in the last 3 years? What carrier currently insures it and at what premium?
- The area grade is low — what's the realistic commute time and amenity access for the typical tenant pool here? Any planned neighborhood developments (good or bad) we should know about?
- What's the average days-on-market for RENTAL listings here right now (not sales)? A rising rental-DOM trend means longer vacancies and softer asking-rent achievability than the comps imply.
- What's the recent tenant-quality profile in this submarket — average credit score on applications, eviction rate, late-payment / NSF rate, and stable-employment percentage? A property-management company in the area should have these aggregated.
- How much new for-sale + rental construction is in the pipeline within 1–3 miles? Heavy new supply typically softens prices + rents 12–24 months out; constrained supply supports both.
Investment metrics
- 1% rule
- 0.79% ✗
- Cap rate
- 5.46%
- Cash-on-cash
- -2.97%
- DSCR
- 0.87
- GRM
- 10.6
CMA / ARV
- ARV (on-the-fly)
- $196,184
- Comps found
- 4
Show comp detail 4 sales within ~0.75 mi
| Address | Dist | Beds/Ba | Sqft | Sold | Price | $/sf | Match |
|---|---|---|---|---|---|---|---|
| 124 County Rd | 0.09mi | 3/2.0 | 1,100 (+0%) | 6mo | $215,000 | $195 | 86 |
| 209 Wilson St | 0.47mi | 3/2.0 | 1,200 (+10%) | 4mo | $215,000 | $179 | 55 |
| 204 Garrett St | 0.56mi | 3/2.0 | 1,200 (+10%) | 6mo | $215,000 | $179 | 49 |
| 1005 Woodlawn Rd | 0.74mi | 3/1.0 | 988 (-10%) | 13mo | $113,000 | $114 | 38 |
Match score weights: distance 35% · size 25% · config 20% · recency 20%. Top-matched comps best support the ARV.
Projected returns pro-forma
10.0% appreciation · 3.0% rent growth · sell at horizon
- IRR
- 22.2%
- Equity multiple
- 2.79×
- Total profit
- $95,065
- Equity at exit
- $171,077
- IRR
- 19.9%
- Equity multiple
- 6.39×
- Total profit
- $286,586
- Equity at exit
- $368,934
Cash invested: $53,172 (down + closing). Projections, not guarantees.
Landlord ↔ Tenant lean methodology
- Overall (STATE)
- 87 Strongly Landlord-Friendly
- State Tennessee
- 87 Strongly Landlord-Friendly · R+13
- County
- — inherits STATE
- City
- — inherits STATE
ZIP-level market 38556
- Home prices YoY
- 13.5%
- Active inventory
- 325
- Price-to-rent
- 10.6×
Monthly cashflow live
- Estimated rent
- $1,495 medium interval (Pro) →
- Mortgage (P&I)
- −$996
- Tax est. 1.5%
- −$237 /mo · $2,848/yr
- Insurance
- −$79
- HOA
- −$0
- Vacancy / Maint / Mgmt
- −$314
- Net cashflow
- $-132
Break-even live
Sensitivity live
| Price | -10% $0 | -5% $-66 | +0% $-132 | +5% $-197 | +10% $-263 |
|---|---|---|---|---|---|
| Rent | -10% $-250 | -5% $-191 | +0% $-132 | +5% $-73 | +10% $-14 |
| Rate | -1.0pp $-36 | -0.5pp $-83 | base $-132 | +0.5pp $-181 | +1.0pp $-231 |
UW: 25.0% down · 7.5% · 30yr · 1.5% tax · 5.0% vac · 8.0% maint · 8.0% mgmt
Financing live
Cash to close
- Down payment
- $47,475
- Closing costs
- $5,697
- Reserves months
- —
- Total cash needed
- —
Loan-product check · same deal, 3 products live
Conventional
25% down · 7.5% · 30yr
- Down + closing
- —
- Monthly P&I
- —
- Monthly cashflow
- —
- DSCR
- —
- Eligible?
- —
Personal DTI + credit; lowest rate.
DSCR
20% down · 8.5% · 30yr
- Down + closing
- —
- Monthly P&I
- —
- Monthly cashflow
- —
- DSCR
- —
- Eligible?
- —
No personal income docs; deal must DSCR.
Hard money
10% down · 12.0% · 12mo
- Down + closing
- —
- Monthly P&I
- —
- Monthly cashflow
- —
- DSCR
- —
- Eligible?
- —
Short-term bridge; refi at stabilization.
Listing history 14 events
-
2026-06-21days on market $189,900 Active 18 DOM
-
2026-06-21days on market $189,900 Active 17 DOM
-
2026-06-18days on market $189,900 Active 15 DOM
-
2026-06-17days on market $189,900 Active 14 DOM
-
2026-06-16days on market $189,900 Active 13 DOM
-
2026-06-15days on market $189,900 Active 12 DOM
-
2026-06-13days on market $189,900 Active 10 DOM
-
2026-06-12days on market $189,900 Active 9 DOM
-
2026-06-09days on market $189,900 Active 6 DOM
-
2026-06-08days on market $189,900 Active 5 DOM
-
2026-06-08days on market $189,900 Active 4 DOM
-
2026-06-07days on market $189,900 Active 3 DOM
-
2026-06-04remarks 699-char remark
-
2026-06-04$189,900 Active 1 DOM
ⓘ Source: listings_history table (triggers on properties + properties_extension) + one-shot
backfill from property_details.listing_events for pre-trigger history.
Climate risk First Street
- Flood 1/10 Low FEMA zone X (unshaded) · 0% chance over 30 yrs
- Wildfire 4/10 Moderate
- Heat 3/10 Moderate 7 d/yr ≥99°F today · 20 d/yr by 30 yrs out
- Wind 3/10 Moderate 5% chance of damaging wind over 30 yrs
- Air quality 2/10 Low 2 unhealthy d/yr today · 2 by 30 yrs out
Nearby sold comps map
Loading sold comps map…
Walkable amenities ~0.75 mi
Loading nearby amenities…
Taxation est. · year 1
- Rental income
- $17,935
- − Mortgage interest
- −$10,637
- − Property taxes
- −$2,848
- − Insurance
- −$950
- − Repairs & maintenance
- −$1,435
- − Management
- −$1,435
- − Depreciation
- −$5,524
- Taxable loss
- −$4,894
- Est. tax savings @ 24.0%
- +$1,175
- After-tax cash flow
- $-405/yr
For passive investors: Depreciation is non-cash, so a rental often shows a tax loss while cash-flowing — sheltering income. Rental losses are passive: they offset passive income freely, and up to $25,000/yr can offset ordinary (W-2) income if you actively participate and your MAGI is under $100k (phasing out to $0 by $150k); unused losses carry forward. On sale, claimed depreciation is recaptured at up to 25%, and gains may owe capital-gains tax (a 1031 exchange can defer both). Figures are a year-1 estimate at your 24.0% rate — not tax advice; consult a CPA.
Schools (NCES district)
- District
- Fentress County
- NCES district ID
- 4701230
- Math proficiency
- 24% ▼ -13.00%
- Reading proficiency
- 27% ▼ -8.00%
- Median HH income
- $30,419
- Composite
- 20.6/100
- National rank
- #8552
- State rank
- #91 of 139 in TN
Livability — Jamestown
- Score
- 61/100
- State rank
- #250
- US rank
- #17976
Category grades
Schools grade is shown separately in the Schools card above.
Census & demographics
- Population (ZIP)
- 12,531
Population outlook (Fentress County) Hauer SSP2
- Today (2025)
- 17,295 people
- By 2030
- 16,749 · -3.2%
- By 2040
- 15,443 · -10.7%
- By 2050
- 14,077 · -18.6%
- By 2075
- 11,482 · -33.6%
- By 2100
- 9,658 · -44.2%
Race, ethnicity, and origin ACS 2023
- Neighborhood character
- Predominantly White (96%)
- Race & ethnicity
- White 96% Two or more races 3% Hispanic / Latino 1%
- Common ancestry
- Serbian 3% Lithuanian 2% Iranian 1%
- Foreign-born
- 1% · Canada
- Languages at home
- 99% English-only · Spanish 1%
Political lean MEDSL · Fentress
- 2024 margin
- Solid R (+75.8) · D 11.8% · R 87.6%
- 2008→2024 swing
- -31.9pp toward R · 2008: -43.9pp · 2024: -75.8pp
- All cycles
- 2024: R+75.8 2020: R+71.3 2016: R+67.5 2012: R+53.4 2008: R+43.9
Not yet ingested
- Civics
- —
Market trends
- HPI YoY
- ▲ 44.31%
- Current HPI
- 372.5676
- Rent YoY
- —
- Metro
- —
- State GDP YoY
- ▲ 2.78%
- F500 in state
- 22
Industry mix (Fortune 500 HQ in TN)
| Industry | F500 HQs | Revenue |
|---|---|---|
| Healthcare | 3 | $91B |
|
||
| Retail | 3 | $72B |
|
||
| Transportation / Logistics | 1 | $88B |
|
||
| Paper / Packaging | 1 | $19B |
|
||
| Insurance | 1 | $13B |
|
||
| Energy | 1 | $12B |
|
||
Price history
+140.4% since first listed4 events — show timeline
- 2026-06-03 Listed $189,900 REALTRACS as Distributed by MLS Grid
- 2026-06-03 Listed $189,900 UCMLS
- 2026-06-03 Listed $189,900 Knoxville MLS
- 2021-09-15 Sold (Public Records) $79,000 Public Records
Property tax history
+2.4%/yrLatest (2025): $373 · +0.0% YoY. Source: county tax records.
Cash-flow waterfall
monthlySold comps — $/sqft
last 12 mo · ≤1 miLoading sold comps…