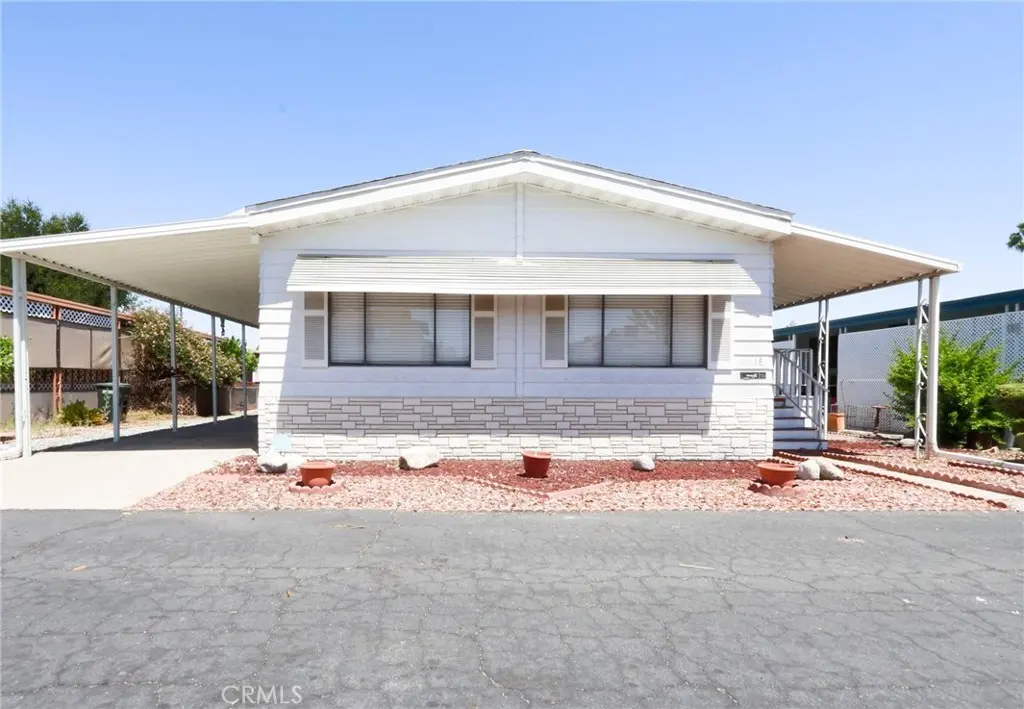
1525 Oakland Ave W #31 · Hemet, CA
Flood risk 1/10 · Minimal
- FEMA flood zone
- X (unshaded)
- Chance of flooding over 30 yrs
- 0.0%
- Est. flood insurance / yr
- $507 – $1,088
Fire risk 1/10 · Minimal
- Est. fire insurance / yr
- $659 – $1,223
Heat risk 7/10 · Major
- Hot days now (above 104°F)
- 6 days/yr
- Hot days in 30 yrs
- 17 days/yr
Wind risk 1/10 · Minimal
- Chance of severe wind over 30 yrs
- —
Air-quality risk 6/10 · Moderate
- Unhealthy air days now
- 12 days/yr
- Unhealthy air days in 30 yrs
- 14 days/yr
Risk factors via First Street. Map © Google.
Why this score? — see what drove the D grade
The composite is a weighted blend of 9 inputs, each scored 0–100. Each bar is that input's sub-score; the figure is the points it added to the 100-point composite (weight × sub-score).
- Cash flow +15.0/30.0
- ARV discount +7.5/15.0
- 1% rule +5.0/10.0
- DSCR +5.0/10.0
- Rent growth +2.9/5.0
- Livability +2.6/5.0
- Schools +2.5/10.0
- Condition / age +2.5/5.0
- Appreciation +0.0/10.0
$35,000
🖨 Deal sheet 📄 Offer letter ✓ Due diligence
Listing remarks MLS
TURNKEY!!!! WOW, REDUCED! NOW $23,900.00, DOWN FROM $27,900.00. POSSIBLY THE LOWEST PRICED HOME IN NORTH EDEN ROC. BEAUTIFULLY MAINTAINED HOME IN WELL KEPT PARK AND GREAT CURB APPEAL. OPEN FLOOR PLAN AND NEWER CARPET. MICROWAVE AND STOVETOP. TURN KEY!!!!!LOCATED IN MOST DESIRABLE LOCATION AND ON THE NORTH SIDE OF PARK. TURNKEY!!!! THIS HOME IS PRICED TO SELL FAST, COMPARE YOURSELF WITH OTHER HOMES CLOSE IN THE AREA. TURNKEY!!!! WALKING DISTANCE TO MALL, REST. S AND SHOPPING. ON TOP OF THIS, BRING FUSSY BUYERS, THEY WILL LOVE THE HOME. TURNKEY!!!!! WHAT A COMBINATION TO SELL A HOME. TURN KEY AND GREAT PRICE!!!! THIS IS TRUELY ONE OF THE NICEST HOMES IN THE PARK. PARK HAS A CLUB HOUSE, GAME ROOMS, POOL, WORKOUT ROOMS. WOW!!!!!! TURN KEY!!!! 55+ NEIGHBORHOOD.
Key facts
- Covered parking
- Covered patio
- 19.31 acre lot
Tags
Property features AI
Finance
- Other: Total units: 1; No ADU
- Financial info: Land lease property
- HOA & community: Senior community; Suburban setting; Land lease: $768 monthly
Exterior
- Parking: Covered parking
- Security: Gated community; Fire and smoke detection system; Smoke detector
- Utilities: District/public water; Sewer or septic - unknown
- Home design: Manufactured house; One story; Entry on side; Turnkey condition; No common walls
- Construction: Composition roof; Year built per assessor
- Exterior features: Front porch; Has patio; Shed; Front yard; Rock landscaping; Yard; Paved road access
Interior
- Kitchen: Garbage disposal; Microwave; Refrigerator; Electric range; Double oven; Dishwasher; Eating area in kitchen
- Bedrooms: 2 bedrooms on the main level; Primary suite
- Flooring: Carpet
- Bathrooms: 1 full bath; 1 three-quarter bath
- Heating & cooling: Central furnace heating; Central cooling
- Interior features: Laminate counters; Built-ins; Linen closet/storage; Bathtub; Shower; Fire and smoke detection system; Smoke detector; Gated community
- Laundry & utility: Individual laundry room; Gas and electric dryer hookup; Water heater unit
Neighborhood map
What this means for you Summary
Snapshot
- This is a 3-bed/2.0-bath manufactured listed at $35k.
Deal economics
- At list price, monthly cash flow is $1k ($16k/yr) — positive.
- The deal already cash-flows at list — no discount required.
- Meets the 1% rule at list price ($2k rent vs $35k).
- Cap rate 51.3% vs local median 4.9% in Hemet — top-decile yield for the area; either an underpriced asset or a hidden risk that comps aren't pricing in. Stress-test before assuming the spread holds.
Location & tenants
- Location reads 51/100 on livability (#1,056 in CA) — a working-class tenant base; expect higher turnover. Strengths: housing A+; Watch: crime D+, schools F, amenities F.
- Hemet Unified (suburban): math 19% / reading 41% proficiency, ranked #360 of 517 in CA (top 70%) — families likely to look elsewhere, expect single-tenant / working-renter base with shorter leases; 66% free/reduced lunch — lower-income household profile, screen leases tightly.
- Market conditions: Rents rising (+1.8%/yr); 264 active listings in the ZIP; 40 comparable units currently listed for rent nearby; rentals at typical pace (median 24d on market — plan ~3-4 weeks tenant-placement turnaround); 9,195 units permitted in Riverside County in 2024 (1,512 in 5+ unit buildings).
- At $1,946/mo this rent would consume 47% of the median local household income ($49k/yr) (locally 2144% of renters already pay >50% of income on rent) — very limited rent-growth headroom before tenants either downsize or default.
Forward outlook
- Local home prices are declining (-3.0%/yr); year-one equity from $242 of loan paydown is wiped out by about $1k of value loss. Plan a longer hold.
- Riverside County population projected at +22% by 2050 — long-run rental-demand tailwind backs the buy-and-hold thesis.
- At projected returns (-3.0% appreciation + 1.8% rent growth), your $10k cash investment doubles in ~1 year — after that, you're playing with house money.
Negotiation context
- Only 1 days on market — expect competitive offers; lowballing is unlikely to land.
- 2 sale attempts since 18y ago; this cycle's ask has dropped $10k (22%) from the opening price — seller is motivated, your offer sets the floor, not the list.
- Current owner paid $21k; list at $35k implies a 67% gain — meaningful room to come down on a strong offer.
Risks & watch-outs
- Climate carrying-cost: extreme-heat days projected 6→17/yr by 2055 (HVAC capex compounding) — expect insurance premiums to compound above CPI over the hold.
Questions for the listing agent
- Is there a deadline driving the sale (1031 exchange, divorce, estate, relocation)? That informs how much negotiation room exists.
- Schools are F-rated, which usually means shorter tenancies and higher turnover. Who's the typical renter profile here, and what's been the actual vacancy rate?
- Crime grade is D in this area — have there been break-ins, vandalism, or insurance claims at this property in the last 3 years? What carrier currently insures it and at what premium?
- The area grade is low — what's the realistic commute time and amenity access for the typical tenant pool here? Any planned neighborhood developments (good or bad) we should know about?
- What's the average days-on-market for RENTAL listings here right now (not sales)? A rising rental-DOM trend means longer vacancies and softer asking-rent achievability than the comps imply.
- What's the recent tenant-quality profile in this submarket — average credit score on applications, eviction rate, late-payment / NSF rate, and stable-employment percentage? A property-management company in the area should have these aggregated.
- How much new for-sale + rental construction is in the pipeline within 1–3 miles? Heavy new supply typically softens prices + rents 12–24 months out; constrained supply supports both.
Investment metrics
- 1% rule
- 5.56% ✓
- Cap rate
- 51.35%
- Cash-on-cash
- 160.91%
- DSCR
- 8.16
- GRM
- 1.5
CMA / ARV
- ARV (on-the-fly)
- $72,384
- Comps found
- 12
Show comp detail 12 sales within ~0.75 mi
| Address | Dist | Beds/Ba | Sqft | Sold | Price | $/sf | Match |
|---|---|---|---|---|---|---|---|
| 1525 W Oakland Ave #115 | 0.00mi | 2/2.0 (-1) | 1,248 (0%) | 6mo | $46,000 | $37 | 90 |
| 332 N Lyon Ave #67 | 0.12mi | 2/2.0 (-1) | 1,248 (0%) | 3mo | $49,500 | $40 | 87 |
| 1380 Cabrillo | 0.14mi | 2/2.0 (-1) | 1,152 (-8%) | 2mo | $260,000 | $226 | 74 |
| 1895 W Devonshire #133 | 0.35mi | 2/2.0 (-1) | 1,248 (0%) | 7mo | $65,000 | $52 | 73 |
| 1895 W Devonshire Ave #74 | 0.35mi | 3/2.0 | 1,344 (+8%) | 2mo | $80,000 | $60 | 69 |
| 542 Castille | 0.16mi | 2/2.0 (-1) | 1,392 (+12%) | 2mo | $239,000 | $172 | 67 |
| 1895 W Devonshire Ave #148 | 0.35mi | 3/2.0 | 1,344 (+8%) | 6mo | $87,500 | $65 | 65 |
| 1895 W Devonshire #20 | 0.35mi | 2/2.0 (-1) | 1,344 (+8%) | 1mo | $44,000 | $33 | 65 |
| 430 N Palm #102 | 0.44mi | 2/1.5 (-1) | 1,200 (-4%) | 2mo | $45,000 | $38 | 65 |
| 1895 W Devonshire Ave #76 | 0.35mi | 2/2.0 (-1) | 1,344 (+8%) | 4mo | $55,000 | $41 | 63 |
| 1300 W Menlo #92 | 0.46mi | 2/2.0 (-1) | 1,344 (+8%) | 8mo | $94,000 | $70 | 54 |
| 1300 W Menlo Ave #185 | 0.46mi | 2/2.0 (-1) | 1,344 (+8%) | 8mo | $77,500 | $58 | 54 |
Match score weights: distance 35% · size 25% · config 20% · recency 20%. Top-matched comps best support the ARV.
Projected returns pro-forma
-3.0% appreciation · 1.76% rent growth · sell at horizon
- IRR
- —
- Equity multiple
- 8.72×
- Total profit
- $75,641
- Equity at exit
- $5,219
- IRR
- —
- Equity multiple
- 17.75×
- Total profit
- $164,110
- Equity at exit
- $3,026
Cash invested: $9,800 (down + closing). Projections, not guarantees.
Landlord ↔ Tenant lean methodology
- Overall (STATE)
- 18 Strongly Tenant-Friendly
- State California
- 18 Strongly Tenant-Friendly · D+13
- County
- — inherits STATE
- City
- — inherits STATE
ZIP-level market 92543
- Home prices YoY
- -26.7%
- Rents YoY
- 1.8%
- Active inventory
- 264
- Price-to-rent
- 1.5×
Monthly cashflow live
- Estimated rent
- $1,946 high interval (Pro) →
- Mortgage (P&I)
- −$184
- Tax from tax record
- −$25 /mo · $300/yr
- Insurance
- −$15
- HOA
- −$0
- Vacancy / Maint / Mgmt
- −$409
- Net cashflow
- $1,314
Break-even live
UW: 25.0% down · 7.5% · 30yr · 1.5% tax · 5.0% vac · 8.0% maint · 8.0% mgmt
Financing live
Cash to close
- Down payment
- $8,750
- Closing costs
- $1,050
- Reserves months
- —
- Total cash needed
- —
Loan-product check · same deal, 3 products live
Conventional
25% down · 7.5% · 30yr
- Down + closing
- —
- Monthly P&I
- —
- Monthly cashflow
- —
- DSCR
- —
- Eligible?
- —
Personal DTI + credit; lowest rate.
DSCR
20% down · 8.5% · 30yr
- Down + closing
- —
- Monthly P&I
- —
- Monthly cashflow
- —
- DSCR
- —
- Eligible?
- —
No personal income docs; deal must DSCR.
Hard money
10% down · 12.0% · 12mo
- Down + closing
- —
- Monthly P&I
- —
- Monthly cashflow
- —
- DSCR
- —
- Eligible?
- —
Short-term bridge; refi at stabilization.
Rent comps 40 comps
| Address | Beds | Baths | Sqft | Rent | $/sqft | DOM | Units | Dist |
|---|---|---|---|---|---|---|---|---|
| 446 N Elk St Unit D Hemet, CA | 2.0 | 1.0 | 980 | $1,675 | $1.71 | 24d | 1 | 0.14mi |
| 1270 Rosalia Ave Unit 1 Hemet, CA | 2.0 | 1.0 | 900 | $1,800 | $2.00 | 43d | 1 | 0.16mi |
| 1887 Calle Amargosa Hemet, CA | 2.0 | 1.0 | 827 | $1,545 | $1.87 | 24d | 1 | 0.20mi |
| 663 Mariposa Dr Hemet, CA | 2.0 | 2.0 | 1440 | $1,500 | $1.04 | 24d | 1 | 0.21mi |
| 1862 Pueblo Dr Hemet, CA | 2.0 | 2.0 | 977 | $1,900 | $1.94 | 43d | 1 | 0.23mi |
| 1862 Pueblo Dr Unit 1862 Hemet, CA | 2.0 | 2.0 | 977 | $1,750 | $1.79 | 24d | 1 | 0.24mi |
| 627 Solano Dr Hemet, CA | 2.0 | 2.0 | 882 | $1,800 | $2.04 | 18d | 1 | 0.26mi |
| 1964 W Oakland Ave Hemet, CA | 2.0 | 2.0 | 977 | $1,695 | $1.73 | 18d | 1 | 0.29mi |
| 250 N Elk St Hemet, CA | 2.0 | 1.0 | 900 | $1,625 | $1.81 | 14d | 1 | 0.30mi |
| 2054 Avenida Olivos Hemet, CA | 2.0 | 1.0 | 820 | $1,500 | $1.83 | 43d | 1 | 0.34mi |
| 1931 Nuevo St Hemet, CA | 2.0 | 1.0 | 820 | $1,600 | $1.95 | 43d | 1 | 0.35mi |
| 1933 Nuevo St Hemet, CA | 2.0 | 1.0 | 827 | $1,700 | $2.06 | 24d | 1 | 0.36mi |
| 2120 San Bernardo Ave Hemet, CA | 2.0 | 1.0 | 827 | $2,100 | $2.54 | 43d | 1 | 0.38mi |
| 1315 W Latham Ave Hemet, CA | 3.0 | 2.5 | 1340 | $2,550 | $1.90 | 43d | 1 | 0.39mi |
| 341 Calle Nogales Hemet, CA | 2.0 | 1.0 | 827 | $1,395 | $1.69 | 43d | 1 | 0.40mi |
| 1700 Walden Ln Hemet, CA | 3.0 | 2.0 | 1430 | $2,670 | $1.87 | 24d | 1 | 0.44mi |
| 528 San Marino St Hemet, CA | 2.0 | 1.0 | 827 | $1,900 | $2.30 | 43d | 1 | 0.45mi |
| 2269 San Bernardo Ave Hemet, CA | 2.0 | 1.0 | 827 | $1,650 | $2.00 | 43d | 1 | 0.49mi |
| 682 San Marino St Hemet, CA | 2.0 | 1.0 | 827 | $1,600 | $1.93 | 43d | 1 | 0.50mi |
| 2014 Iris Way Hemet, CA | 3.0 | 2.0 | 1192 | $2,850 | $2.39 | 43d | 1 | 0.56mi |
| 2488 San Padre Ct Hemet, CA | 2.0 | 1.0 | 827 | $1,599 | $1.93 | 14d | 1 | 0.62mi |
| 2422 San Padre Ct Hemet, CA | 2.0 | 1.0 | 827 | $1,800 | $2.18 | 24d | 1 | 0.65mi |
| 2098 W Acacia Ave Hemet, CA | 1.0–3.0 | 1.0–2.0 | 895 | $2,475 | $2.77 | 1d | 1 | 0.77mi |
| 2770 W Devonshire Ave Hemet, CA | 1.0–2.0 | 1.0–2.0 | 707 | $1,945 | $2.75 | 1d | 11 | 0.78mi |
| 2208 El Grande St Hemet, CA | 2.0 | 2.0 | 1327 | $2,100 | $1.58 | 18d | 1 | 0.85mi |
| 1850 Amberwood Dr Hemet, CA | 2.0 | 2.0 | 1170 | $1,561 | $1.33 | 43d | 1 | 0.89mi |
| 853 Ensenada Dr Hemet, CA | 2.0 | 2.0 | 1350 | $1,875 | $1.39 | 12d | 1 | 0.91mi |
| 853 Ensenada Dr Hemet, CA | 2.0 | 2.0 | 1350 | $1,875 | $1.39 | 24d | 1 | 0.91mi |
| 2403 W Acacia Ave Hemet, CA | 2.0 | 2.0 | 910 | $1,995 | $2.19 | 7d | 1 | 0.92mi |
| 471 Whitney Dr Hemet, CA | 2.0 | 2.0 | 1085 | $1,800 | $1.66 | 5d | 1 | 0.92mi |
| 2469 W Acacia Ave Hemet, CA | 2.0 | 2.0 | 910 | $1,750 | $1.92 | 24d | 1 | 0.93mi |
| 811 Alondra Dr Hemet, CA | 2.0 | 2.0 | 1166 | $1,875 | $1.61 | 4d | 1 | 0.93mi |
| 1461 W Mayberry Ave Hemet, CA | 2.0 | 2.0 | 1044 | $1,750 | $1.68 | 43d | 1 | 0.97mi |
| 471 S Simpson Ave Unit D Hemet, CA | 2.0 | 2.0 | 900 | $1,750 | $1.94 | 43d | 1 | 1.01mi |
| 363 S Gilbert St Hemet, CA | 3.0 | 2.0 | 1200 | $1,900 | $1.58 | 4d | 1 | 1.01mi |
| 363 S Gilbert St Unit B Hemet, CA | 3.0 | 2.0 | 1200 | $1,900 | $1.58 | 14d | 1 | 1.01mi |
| 743 Via Linda Dr Hemet, CA | 2.0 | 2.0 | 1206 | $1,995 | $1.65 | 5d | 1 | 1.06mi |
| 611 S Palm Ave Unit K Hemet, CA | 2.0 | 2.0 | 1254 | $1,895 | $1.51 | 7d | 1 | 1.13mi |
| 3030 W Acacia Ave Hemet, CA | 1.0–3.0 | 1.0–2.0 | 892 | $2,195 | $2.46 | 1d | 10 | 1.13mi |
| 526 Greystone Ln Hemet, CA | 2.0 | 1.0 | 700 | $1,600 | $2.29 | 18d | 1 | 1.17mi |
Listing history 10 events
-
2026-06-18days on market $35,000 Active 1 DOM
-
2026-06-17pricedays on market $35,000 Active 14 DOM
-
2026-06-16days on market $45,000 Active 13 DOM
-
2026-06-15days on market $45,000 Active 12 DOM
-
2026-06-13days on market $45,000 Active 10 DOM
-
2026-06-09days on market $45,000 Active 6 DOM
-
2026-06-08days on market $45,000 Active 5 DOM
-
2026-06-07days on market $45,000 Active 4 DOM
-
2026-06-04remarks 612-char remark
-
2026-06-04$45,000 Active 1 DOM
ⓘ Source: listings_history table (triggers on properties + properties_extension) + one-shot
backfill from property_details.listing_events for pre-trigger history.
Tax reassessment forecast CA · Resets to sale price
- Current annual tax
- $300 · $25/mo
- Projected year-2 tax
- $300 · $25/mo
- Expected delta
- $0/yr ($0/mo · 0.0%)
ⓘ Screening estimate from a state-policy table — verify with the county assessor before closing.
Climate risk First Street
- Flood 1/10 Low FEMA zone X (unshaded) · 0% chance over 30 yrs
- Wildfire 1/10 Low
- Heat 7/10 Severe 6 d/yr ≥104°F today · 17 d/yr by 30 yrs out
- Wind 1/10 Low
- Air quality 6/10 Major 12 unhealthy d/yr today · 14 by 30 yrs out
Nearby sold comps map
Loading sold comps map…
Walkable amenities ~0.75 mi
Loading nearby amenities…
Taxation est. · year 1
- Rental income
- $23,350
- − Mortgage interest
- −$1,961
- − Property taxes
- −$300
- − Insurance
- −$175
- − Repairs & maintenance
- −$1,868
- − Management
- −$1,868
- − Depreciation
- −$1,018
- Taxable income
- $16,160
- Est. tax owed @ 24.0%
- −$3,878
- After-tax cash flow
- $11,890/yr
For passive investors: Depreciation is non-cash, so a rental often shows a tax loss while cash-flowing — sheltering income. Rental losses are passive: they offset passive income freely, and up to $25,000/yr can offset ordinary (W-2) income if you actively participate and your MAGI is under $100k (phasing out to $0 by $150k); unused losses carry forward. On sale, claimed depreciation is recaptured at up to 25%, and gains may owe capital-gains tax (a 1031 exchange can defer both). Figures are a year-1 estimate at your 24.0% rate — not tax advice; consult a CPA.
Schools (NCES district)
- District
- Hemet Unified
- NCES district ID
- 0616920
- Math proficiency
- 19% ▼ -3.00%
- Reading proficiency
- 41% ▲ 4.00%
- Median HH income
- $39,962
- Composite
- 25.16/100
- National rank
- #7517
- State rank
- #360 of 517 in CA
Livability — Hemet
- Score
- 51/100
- State rank
- #1056
- US rank
- #25208
Category grades
Schools grade is shown separately in the Schools card above.
Census & demographics
- Census place
- Hemet, CA
- County
- Riverside County · 2,287,001 people
- City population
- 137,670
- Metro
- Riverside-San Bernardino-Ontario, CA
- Population (ZIP)
- 39,937
- Household income
- $49,396
- Rent vs Own
- Severe rent burden
- 2144.0
Population outlook (Riverside County) Hauer SSP2
- Today (2025)
- 2,664,475 people
- By 2030
- 2,802,692 · +5.2%
- By 2040
- 3,050,904 · +14.5%
- By 2050
- 3,256,783 · +22.2%
- By 2075
- 3,655,058 · +37.2%
- By 2100
- 3,766,594 · +41.4%
Race, ethnicity, and origin ACS 2023
- Neighborhood character
- Diverse neighborhood (Simpson 0.61)
- Race & ethnicity
- Hispanic / Latino 54% White 30% Two or more races 18% Black 10% Native American 2% Asian 2%
- Hispanic origin (detail)
- Mexican 48% Puerto Rican 1%
- Common ancestry
- Slovak 1% Romanian 1% Portuguese 1%
- Foreign-born
- 21% · Canada
- Languages at home
- 59% English-only · Spanish 38% Arabic 1% Tagalog/Filipino 1%
Political lean MEDSL · Riverside
- 2024 margin
- Toss-up / Even · D 48.0% · R 49.3% · Other 2.6%
- 2008→2024 swing
- -3.6pp toward R · 2008: 2.3pp · 2024: -1.3pp
- All cycles
- 2024: R+1.3 2020: D+8.0 2016: D+4.3 2012: R+0.4 2008: D+2.3
Not yet ingested
- Civics
- —
Market trends
- HPI YoY
- ▼ -147.46%
- Current HPI
- 405.1277
- Rent YoY
- ▲ 1.76%
- Metro
- Riverside-San Bernardino-Ontario, CA
- State GDP YoY
- ▲ 3.21%
- F500 in state
- 116
Industry mix (Fortune 500 HQ in CA)
| Industry | F500 HQs | Revenue |
|---|---|---|
| Technology | 27 | $1,492B |
|
||
| Financial Services | 3 | $174B |
|
||
| Retail | 3 | $44B |
|
||
| Insurance | 3 | $26B |
|
||
| Media / Entertainment | 2 | $115B |
|
||
| Pharmaceuticals / Biotech | 2 | $62B |
|
||
Price history
+88.3% since first listed4 events — show timeline
- 2026-06-03 Listed $45,000 CRMLS
- 2008-08-05 Sold (MLS) $21,000 CRMLS
- 2008-06-09 Listing Removed — CRMLS
- 2008-03-28 Listed $23,900 CRMLS
Property tax history
+0.0%/yrLatest (2025): $300 · +6.4% YoY. Source: county tax records.
Cash-flow waterfall
monthlySold comps — $/sqft
last 12 mo · ≤1 miLoading sold comps…