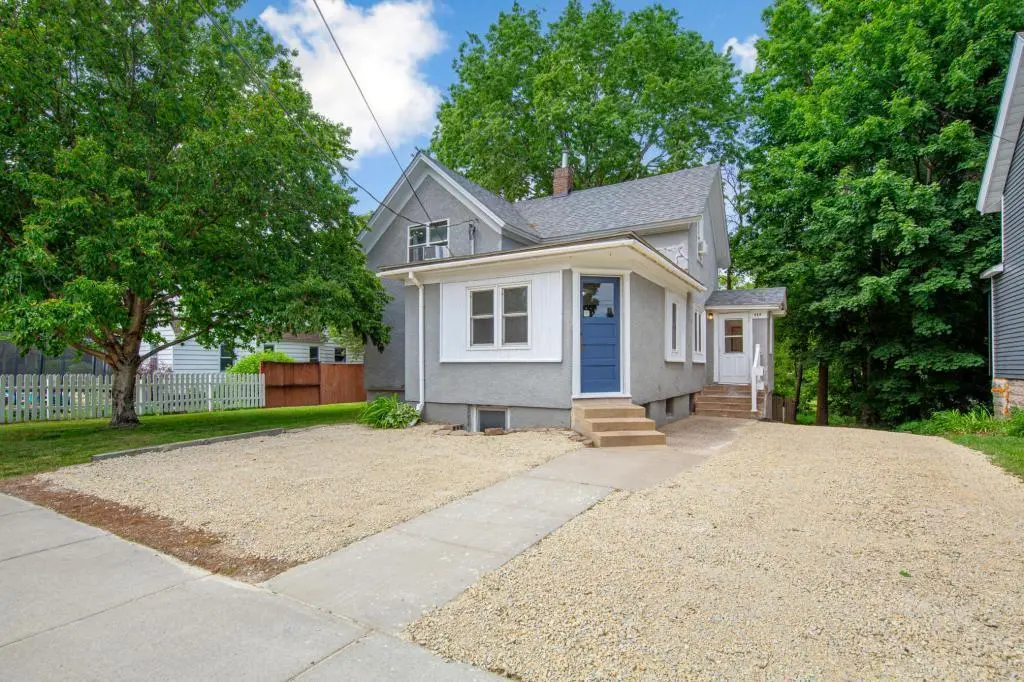
612 2nd St W · Northfield, MN
Flood risk 1/10 · Minimal
- FEMA flood zone
- X (unshaded)
- Chance of flooding over 30 yrs
- 0.0%
- Est. flood insurance / yr
- $473 – $860
Fire risk 2/10 · Minimal
- Est. fire insurance / yr
- $888 – $1,650
Heat risk 2/10 · Minimal
- Hot days now (above 99°F)
- 7 days/yr
- Hot days in 30 yrs
- 15 days/yr
Wind risk 2/10 · Minimal
- Chance of severe wind over 30 yrs
- —
Air-quality risk 3/10 · Minor
- Unhealthy air days now
- 3 days/yr
- Unhealthy air days in 30 yrs
- 3 days/yr
Risk factors via First Street. Map © Google.
Why this score? — see what drove the C- grade
The composite is a weighted blend of 9 inputs, each scored 0–100. Each bar is that input's sub-score; the figure is the points it added to the 100-point composite (weight × sub-score).
- Cash flow +18.9/30.0
- ARV discount +7.5/15.0
- DSCR +5.9/10.0
- 1% rule +5.4/10.0
- Schools +5.3/10.0
- Livability +4.2/5.0
- Rent growth +2.5/5.0
- Condition / age +2.5/5.0
- Appreciation +0.0/10.0
$225,000
🖨 Deal sheet 📄 Offer letter ✓ Due diligence
Listing remarks MLS
Nice opportunity to be an owner occupant or just an investor in this up/down duplex. 1-2 bedrooms on the main, and two bedrooms up. Each unit has their own entrance and mechanicals. Laundry is in the basement. Main level unit has fresh paint and new carpet. Many newer window inserts. Rental license current to October. Must see.
Key facts
- Large eat in kitchen
- Large backyard
- 7,535 sq ft lot
Tags
Property features AI
Finance
- Financial info: Owner pays all utilities
- HOA & community: Association laundry amenity
Exterior
- Parking: 3 parking spaces (per unit listing indicates 3); Gravel parking
- Utilities: City water; City sewer (in street); Xcel Energy power; Natural gas
- Home design: Residential income duplex (up-and-down); One and one-half levels; Owner not occupied
- Construction: Shingle roof (8 years old or newer); Foundation: block and concrete perimeter; Foundation area approximately 931
- Exterior features: Stucco and wood exterior; Public transit within 6 blocks; Medium tree coverage; City street frontage; Gravel parking area
Interior
- Kitchen: Range; Refrigerator; Kitchen window
- Bedrooms: 4 bedrooms total; Unit 1: 2 bedrooms; Unit 2: 2 bedrooms
- Bathrooms: Unit 1: 1 full bathroom; Unit 2: 1 three-quarter bathroom (counts as 1 bath total)
- Heating & cooling: Forced air heating; Central cooling in one unit; Window cooling in the other unit
- Interior features: Has a walkout, unfinished block basement; French doors; Kitchen window
- Laundry & utility: Laundry in basement and common area; Washer; Dryer; Gas water heater
Neighborhood map
What this means for you Summary
Snapshot
- This is a 4-bed/4.0-bath single-family listed at $225k.
Deal economics
- At list price, monthly cash flow is $229 ($3k/yr) — positive.
- The deal already cash-flows at list — no discount required.
- Meets the 1% rule at list price ($2k rent vs $225k).
- Cap rate 7.5% vs local median 2.6% in Northfield — top-decile yield for the area; either an underpriced asset or a hidden risk that comps aren't pricing in. Stress-test before assuming the spread holds.
Location & tenants
- Location reads 83/100 on livability (#28 in MN, #872 nationally) — a professional / high-income tenant draw. Strengths: schools A+, amenities A+, housing A+; Watch: commute F.
- Northfield Public School District (town): math 57% / reading 63% proficiency, ranked #35 of 301 in MN (top 12%) — acceptable for families but not a draw, mixed tenant base, ~2y average lease.
- Market conditions: 147 active listings in the ZIP; solid renter incomes; 93 units permitted in Rice County in 2024 (0 in 5+ unit buildings).
- This rent runs 30% of the median local income ($93k/yr) — at the standard rent-burdened threshold; future hikes will face affordability resistance.
Forward outlook
- Local home prices are declining (-3.0%/yr); year-one equity from $2k of loan paydown is wiped out by about $7k of value loss. Plan a longer hold.
Negotiation context
- Only 5 days on market — expect competitive offers; lowballing is unlikely to land.
- 4 sale attempts since 11y ago with the ask held roughly flat each time — persistent listings suggest the price (not the market) is what's stuck; bring a comps-based counter.
- Current owner paid $130k; list at $225k implies a 73% gain — meaningful room to come down on a strong offer.
Risks & watch-outs
- Watch-outs: built in 1930 — expect roof / HVAC / electrical / plumbing capex.
Questions for the listing agent
- Built in 1930 — when were the roof, HVAC, electrical panel, plumbing, and water heater last replaced?
- Is there a deadline driving the sale (1031 exchange, divorce, estate, relocation)? That informs how much negotiation room exists.
- Schools are A-rated — typically a magnet for longer-tenancy family renters. What's the average tenant stay here, and is there a school-zone premium baked into asking?
- What's the average days-on-market for RENTAL listings here right now (not sales)? A rising rental-DOM trend means longer vacancies and softer asking-rent achievability than the comps imply.
- What's the recent tenant-quality profile in this submarket — average credit score on applications, eviction rate, late-payment / NSF rate, and stable-employment percentage? A property-management company in the area should have these aggregated.
- How much new for-sale + rental construction is in the pipeline within 1–3 miles? Heavy new supply typically softens prices + rents 12–24 months out; constrained supply supports both.
Investment metrics
- 1% rule
- 1.04% ✓
- Cap rate
- 7.51%
- Cash-on-cash
- 4.36%
- DSCR
- 1.19
- GRM
- 8.0
CMA / ARV
No comps found within radius.
Projected returns pro-forma
-3.0% appreciation · 3.0% rent growth · sell at horizon
- IRR
- -9.5%
- Equity multiple
- 0.65×
- Total profit
- $-21,817
- Equity at exit
- $33,548
- IRR
- 0.0%
- Equity multiple
- 1.00×
- Total profit
- $65
- Equity at exit
- $19,454
Cash invested: $63,000 (down + closing). Projections, not guarantees.
Landlord ↔ Tenant lean methodology
- Overall (STATE)
- 46 Balanced
- State Minnesota
- 46 Balanced · D+2
- County
- — inherits STATE
- City
- — inherits STATE
ZIP-level market 55057
- Home prices YoY
- -29.5%
- Active inventory
- 147
- Price-to-rent
- 8.0×
Monthly cashflow live
- Estimated rent
- $2,339 medium interval (Pro) →
- Mortgage (P&I)
- −$1,180
- Tax from tax record
- −$346 /mo · $4,146/yr
- Insurance
- −$94
- HOA
- −$0
- Vacancy / Maint / Mgmt
- −$491
- Net cashflow
- $229
Break-even live
UW: 25.0% down · 7.5% · 30yr · 1.5% tax · 5.0% vac · 8.0% maint · 8.0% mgmt
Financing live
Cash to close
- Down payment
- $56,250
- Closing costs
- $6,750
- Reserves months
- —
- Total cash needed
- —
Loan-product check · same deal, 3 products live
Conventional
25% down · 7.5% · 30yr
- Down + closing
- —
- Monthly P&I
- —
- Monthly cashflow
- —
- DSCR
- —
- Eligible?
- —
Personal DTI + credit; lowest rate.
DSCR
20% down · 8.5% · 30yr
- Down + closing
- —
- Monthly P&I
- —
- Monthly cashflow
- —
- DSCR
- —
- Eligible?
- —
No personal income docs; deal must DSCR.
Hard money
10% down · 12.0% · 12mo
- Down + closing
- —
- Monthly P&I
- —
- Monthly cashflow
- —
- DSCR
- —
- Eligible?
- —
Short-term bridge; refi at stabilization.
Listing history 4 events
-
2026-06-08statusdays on market $225,000 Pending 5 DOM
-
2026-06-07statusdays on market $225,000 Contingent - Inspection 4 DOM
-
2026-06-04remarks 692-char remark
-
2026-06-04$225,000 Active 1 DOM
ⓘ Source: listings_history table (triggers on properties + properties_extension) + one-shot
backfill from property_details.listing_events for pre-trigger history.
Tax reassessment forecast MN · Partial reset (capped growth)
- Current annual tax
- $4,146 · $346/mo
- Projected year-2 tax
- $4,146 · $346/mo
- Expected delta
- $0/yr ($0/mo · 0.0%)
ⓘ Screening estimate from a state-policy table — verify with the county assessor before closing.
Climate risk First Street
- Flood 1/10 Low FEMA zone X (unshaded) · 0% chance over 30 yrs
- Wildfire 2/10 Low
- Heat 2/10 Low 7 d/yr ≥99°F today · 15 d/yr by 30 yrs out
- Wind 2/10 Low
- Air quality 3/10 Moderate 3 unhealthy d/yr today · 3 by 30 yrs out
Nearby sold comps map
Loading sold comps map…
Walkable amenities ~0.75 mi
Loading nearby amenities…
Taxation est. · year 1
- Rental income
- $28,069
- − Mortgage interest
- −$12,603
- − Property taxes
- −$4,146
- − Insurance
- −$1,125
- − Repairs & maintenance
- −$2,246
- − Management
- −$2,246
- − Depreciation
- −$6,545
- Taxable loss
- −$842
- Est. tax savings @ 24.0%
- +$202
- After-tax cash flow
- $2,947/yr
For passive investors: Depreciation is non-cash, so a rental often shows a tax loss while cash-flowing — sheltering income. Rental losses are passive: they offset passive income freely, and up to $25,000/yr can offset ordinary (W-2) income if you actively participate and your MAGI is under $100k (phasing out to $0 by $150k); unused losses carry forward. On sale, claimed depreciation is recaptured at up to 25%, and gains may owe capital-gains tax (a 1031 exchange can defer both). Figures are a year-1 estimate at your 24.0% rate — not tax advice; consult a CPA.
Schools (NCES district)
- District
- Northfield Public School District
- NCES district ID
- 2723880
- Math proficiency
- 57% ▼ -9.00%
- Reading proficiency
- 63% ▼ -5.00%
- Median HH income
- $68,475
- Composite
- 52.82/100
- National rank
- #1538
- State rank
- #35 of 301 in MN
Livability — Northfield
- Score
- 83/100
- State rank
- #28
- US rank
- #872
Category grades
Schools grade is shown separately in the Schools card above.
Census & demographics
- Census place
- Northfield, MN
- County
- Rice County · 56,558 people
- City population
- 25,650
- Metro
- Faribault-Northfield, MN
- Population (ZIP)
- 25,650
- Household income
- $92,622
- Rent vs Own
- Severe rent burden
- 310.0
Population outlook (Rice County) Hauer SSP2
- Today (2025)
- 66,716 people
- By 2030
- 67,352 · +1.0%
- By 2040
- 67,595 · +1.3%
- By 2050
- 67,074 · +0.5%
- By 2075
- 66,641 · -0.1%
- By 2100
- 66,205 · -0.8%
Race, ethnicity, and origin ACS 2023
- Neighborhood character
- Predominantly White (80%)
- Race & ethnicity
- White 80% Hispanic / Latino 11% Two or more races 9% Asian 4% Black 2%
- Hispanic origin (detail)
- Mexican 9%
- Common ancestry
- Portuguese 17% Romanian 3% Lithuanian 3%
- Foreign-born
- 9% · Canada, China, Vietnam
- Languages at home
- 87% English-only · Spanish 8% Chinese 1% German/W. Germanic 1%
Political lean MEDSL · Rice
- 2024 margin
- Toss-up / Even · D 47.8% · R 50.3% · Other 1.8%
- 2008→2024 swing
- -14.0pp toward R · 2008: 11.5pp · 2024: -2.5pp
- All cycles
- 2024: R+2.5 2020: R+0.2 2016: R+3.1 2012: D+8.3 2008: D+11.5
Not yet ingested
- Civics
- —
Market trends
- HPI YoY
- ▼ -101.42%
- Current HPI
- 242.4818
- Rent YoY
- —
- Metro
- Faribault-Northfield, MN
- State GDP YoY
- ▲ 2.41%
- F500 in state
- 34
Industry mix (Fortune 500 HQ in MN)
| Industry | F500 HQs | Revenue |
|---|---|---|
| Healthcare | 2 | $407B |
|
||
| Retail | 2 | $150B |
|
||
| Consumer Goods | 2 | $32B |
|
||
| Industrial Machinery | 2 | $6B |
|
||
| Agriculture | 1 | $40B |
|
||
| Healthcare / Medical Devices | 1 | $32B |
|
||
Price history
+66.7% since first listed16 events — show timeline
- 2026-06-04 Contingent — NORTHSTARMLS as Distributed by MLS Grid
- 2026-06-03 Listed $225,000 NORTHSTARMLS as Distributed by MLS Grid
- 2018-05-07 Sold (Public Records) $130,000 Public Records
- 2018-04-30 Sold (MLS) $130,000 NORTHSTARMLS as Distributed by MLS Grid
- 2018-04-06 Pending — NORTHSTARMLS as Distributed by MLS Grid
- 2018-03-27 Contingent — NORTHSTARMLS as Distributed by MLS Grid
- 2018-03-20 Relisted — NORTHSTARMLS as Distributed by MLS Grid
- 2018-03-17 Contingent — NORTHSTARMLS as Distributed by MLS Grid
- 2018-03-14 Listed $149,900 NORTHSTARMLS as Distributed by MLS Grid
- 2016-01-25 Sold (Public Records) $85,000 Public Records
- 2016-01-11 Sold (MLS) $85,000 NORTHSTARMLS as Distributed by MLS Grid
- 2016-01-06 Pending — NORTHSTARMLS as Distributed by MLS Grid
- 2015-12-28 Contingent — NORTHSTARMLS as Distributed by MLS Grid
- 2015-12-12 Price Changed $99,000 NORTHSTARMLS as Distributed by MLS Grid
- 2015-11-21 Price Changed $118,000 NORTHSTARMLS as Distributed by MLS Grid
- 2015-10-23 Listed $135,000 NORTHSTARMLS as Distributed by MLS Grid
Property tax history
+2.6%/yrLatest (2025): $4,146 · +17.9% YoY. Source: county tax records.
Cash-flow waterfall
monthlySold comps — $/sqft
last 12 mo · ≤1 miLoading sold comps…