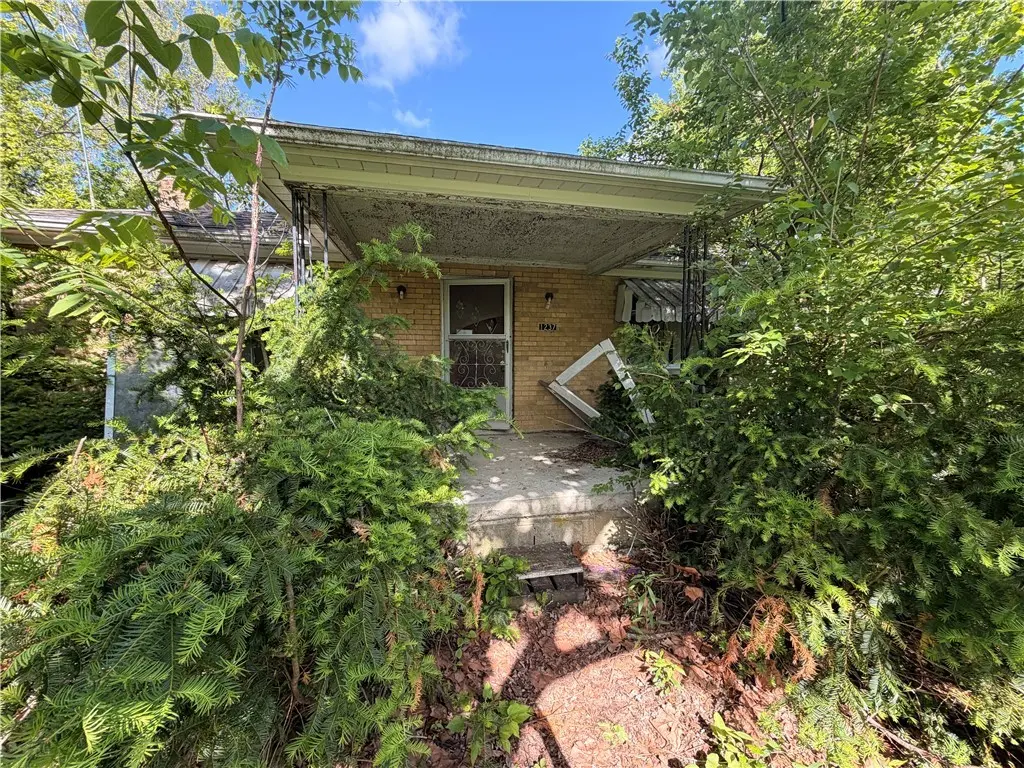
1237 S Diamond Mill Rd · New Lebanon, OH
Flood risk 1/10 · Minimal
- FEMA flood zone
- X (unshaded)
- Chance of flooding over 30 yrs
- 0.0%
- Est. flood insurance / yr
- $473 – $860
Fire risk 1/10 · Minimal
- Est. fire insurance / yr
- $713 – $1,323
Heat risk 3/10 · Minor
- Hot days now (above 101°F)
- 7 days/yr
- Hot days in 30 yrs
- 19 days/yr
Wind risk 2/10 · Minimal
- Chance of severe wind over 30 yrs
- 1.0%
Air-quality risk 2/10 · Minimal
- Unhealthy air days now
- 1 days/yr
- Unhealthy air days in 30 yrs
- 2 days/yr
Risk factors via First Street. Map © Google.
Why this score? — see what drove the A grade
The composite is a weighted blend of 9 inputs, each scored 0–100. Each bar is that input's sub-score; the figure is the points it added to the 100-point composite (weight × sub-score).
- Cash flow +30.0/30.0
- ARV discount +14.9/15.0
- 1% rule +10.0/10.0
- DSCR +10.0/10.0
- Appreciation +10.0/10.0
- Schools +4.2/10.0
- Livability +3.5/5.0
- Rent growth +2.5/5.0
- Condition / age +2.5/5.0
$65,000
🖨 Deal sheet (PDF) 📄 Offer letter ✓ Due diligence
Listing remarks
Attention, Investors! This brick ranch home is just waiting to be brought back to life. Situated on a beautiful 1 acre lot, this Jackson Township home features 2 bedrooms, 1 bathroom, and a full basement. Seller is seeking a cash transaction due to home condition. Home being sold as is. Seller has received multiple offers and will review them at 2PM on Friday, May 15, 2026.
Key facts
- Brick ranch home
- Full basement
- 1 acre lot
Tags
Property features AI
Finance
- Financial info: Property is listed for sale
Exterior
- Parking: Attached one-car garage
- Home design: Single-story brick home
- Construction: Brick construction
- Exterior features: 1-acre lot; Lot dimensions approximately 150 x 290; Residential zoning
Interior
- Kitchen: Kitchen on main level (17 x 10)
- Bedrooms: Bedroom on main level (10 x 12); Bedroom on main level (12 x 9)
- Bathrooms: 1 full bathroom on the main level
- Heating & cooling: Electric forced air heating; Central air conditioning
- Interior features: Full, unfinished basement; Total of 4 rooms
Neighborhood map
What this means for you Summary
Snapshot
- This is a 2-bed/1.0-bath single-family listed at $65k.
Deal economics
- At list price, monthly cash flow is $685 ($8k/yr) — positive.
- The deal already cash-flows at list — no discount required.
- Meets the 1% rule at list price ($2k rent vs $65k).
Location & tenants
- Location reads 70/100 on livability (#450 in OH) — a middle-class / working-renter tenant base. Strengths: cost of living A+, housing A+, crime A; Watch: employment C-, amenities F, commute F.
- New Lebanon Local (town): math 43% / reading 56% proficiency, ranked #448 of 656 in OH (top 68%) — families likely to look elsewhere, expect single-tenant / working-renter base with shorter leases.
- Zoned schools: Dixie Elementary School (math 62% / reading 57%, grade B-, #670 of 1,584 statewide, top 45%, 452 students, 45% FRL); Dixie Middle School (math 39% / reading 55%, grade D+, #451 of 654 statewide, top 70%, 330 students, 49% FRL); Dixie High School (math 27% / reading 62%, grade F, #470 of 781 statewide, top 62%, 308 students, 44% FRL) — zoned schools at 46% FRL track the district average.
- Market conditions: 20 active listings in the ZIP; solid renter incomes; 907 units permitted in Montgomery County in 2024 (416 in 5+ unit buildings).
Forward outlook
- In year one you build about $7k of equity ($449 loan paydown + $6k appreciation (10.0% local appreciation)).
- Montgomery County population projected at -10% by 2050 — secular population decline; favor cash flow + early exit over multi-decade hold.
- At projected returns (10.0% appreciation + 3.0% rent growth), your $18k cash investment doubles in ~2 years — after that, you're playing with house money.
- By year 5, paydown + projected appreciation supports a ~$32k cash-out refi (75% LTV) — recoverable capital for the next deal without selling this one.
Negotiation context
- Only 2 days on market — expect competitive offers; lowballing is unlikely to land.
- Current owner paid $39k; list at $65k implies a 67% gain — meaningful room to come down on a strong offer.
Risks & watch-outs
- Watch-outs: property tax is 3.4% of price; built in 1950 — expect roof / HVAC / electrical / plumbing capex.
Questions for the listing agent
- Built in 1950 — when were the roof, HVAC, electrical panel, plumbing, and water heater last replaced?
- Property tax is high relative to price — has the assessment been appealed recently, and will the sale trigger a re-assessment?
- Is there a deadline driving the sale (1031 exchange, divorce, estate, relocation)? That informs how much negotiation room exists.
- Schools are B-rated — typically a magnet for longer-tenancy family renters. What's the average tenant stay here, and is there a school-zone premium baked into asking?
- What's the average days-on-market for RENTAL listings here right now (not sales)? A rising rental-DOM trend means longer vacancies and softer asking-rent achievability than the comps imply.
- What's the recent tenant-quality profile in this submarket — average credit score on applications, eviction rate, late-payment / NSF rate, and stable-employment percentage? A property-management company in the area should have these aggregated.
- How much new for-sale + rental construction is in the pipeline within 1–3 miles? Heavy new supply typically softens prices + rents 12–24 months out; constrained supply supports both.
Investment metrics
- 1% rule
- 2.41% ✓
- Cap rate
- 18.93%
- Cash-on-cash
- 45.13%
- DSCR
- 3.01
- GRM
- 3.5
CMA / ARV
- ARV (on-the-fly)
- $77,792
- Comps found
- 1
Show comp detail 1 sale within ~0.75 mi
| Address | Dist | Beds/Ba | Sqft | Sold | Price | $/sf | Match |
|---|---|---|---|---|---|---|---|
| 1237 S Diamond Mill Rd | 0.00mi | 2/1.0 | 884 (0%) | 0mo | $77,777 | $88 | 100 |
Match score weights: distance 35% · size 25% · config 20% · recency 20%. Top-matched comps best support the ARV.
Projected returns pro-forma
10.0% appreciation · 3.0% rent growth · sell at horizon
- IRR
- 59.5%
- Equity multiple
- 5.35×
- Total profit
- $79,087
- Equity at exit
- $58,557
- IRR
- 53.1%
- Equity multiple
- 11.92×
- Total profit
- $198,790
- Equity at exit
- $126,281
Cash invested: $18,200 (down + closing). Projections, not guarantees.
Landlord ↔ Tenant lean methodology
- Overall (STATE)
- 73 Landlord-Friendly
- State Ohio
- 73 Landlord-Friendly · R+6
- County
- — inherits STATE
- City
- — inherits STATE
ZIP-level market 45345
- Home prices YoY
- 8.0%
- Active inventory
- 20
- Price-to-rent
- 3.5×
Monthly cashflow live
- Estimated rent
- $1,569 medium interval (Pro) →
- Mortgage (P&I)
- −$341
- Tax from tax record
- −$187 /mo · $2,242/yr
- Insurance
- −$27
- HOA
- −$0
- Vacancy / Maint / Mgmt
- −$329
- Net cashflow
- $685
Break-even live
Sensitivity live
| Price | -10% $721 | -5% $703 | +0% $685 | +5% $666 | +10% $648 |
|---|---|---|---|---|---|
| Rent | -10% $561 | -5% $623 | +0% $685 | +5% $746 | +10% $808 |
| Rate | -1.0pp $717 | -0.5pp $701 | base $685 | +0.5pp $668 | +1.0pp $651 |
UW: 25.0% down · 7.5% · 30yr · 1.5% tax · 5.0% vac · 8.0% maint · 8.0% mgmt
Financing live
Cash to close
- Down payment
- $16,250
- Closing costs
- $1,950
- Reserves months
- —
- Total cash needed
- —
Loan-product check · same deal, 3 products live
Conventional
25% down · 7.5% · 30yr
- Down + closing
- —
- Monthly P&I
- —
- Monthly cashflow
- —
- DSCR
- —
- Eligible?
- —
Personal DTI + credit; lowest rate.
DSCR
20% down · 8.5% · 30yr
- Down + closing
- —
- Monthly P&I
- —
- Monthly cashflow
- —
- DSCR
- —
- Eligible?
- —
No personal income docs; deal must DSCR.
Hard money
10% down · 12.0% · 12mo
- Down + closing
- —
- Monthly P&I
- —
- Monthly cashflow
- —
- DSCR
- —
- Eligible?
- —
Short-term bridge; refi at stabilization.
Listing history 3 events
-
2026-05-16status Pending
-
2026-05-14$65,000 Active
-
1983-12-08soldstatus $39,000
ⓘ Source: listings_history table (triggers on properties + properties_extension) + one-shot
backfill from property_details.listing_events for pre-trigger history.
Tax reassessment forecast OH · Partial reset (capped growth)
- Current annual tax
- $2,242 · $187/mo
- Projected year-2 tax
- $2,242 · $187/mo
- Expected delta
- $0/yr ($0/mo · 0.0%)
ⓘ Screening estimate from a state-policy table — verify with the county assessor before closing.
Climate risk First Street
- Flood 1/10 Low FEMA zone X (unshaded) · 0% chance over 30 yrs
- Wildfire 1/10 Low
- Heat 3/10 Moderate 7 d/yr ≥101°F today · 19 d/yr by 30 yrs out
- Wind 2/10 Low 100% chance of damaging wind over 30 yrs
- Air quality 2/10 Low 1 unhealthy d/yr today · 2 by 30 yrs out
Nearby sold comps map
Loading sold comps map…
Walkable amenities ~0.75 mi
Loading nearby amenities…
Taxation est. · year 1
- Rental income
- $18,825
- − Mortgage interest
- −$3,641
- − Property taxes
- −$2,242
- − Insurance
- −$325
- − Repairs & maintenance
- −$1,506
- − Management
- −$1,506
- − Depreciation
- −$1,891
- Taxable income
- $7,714
- Est. tax owed @ 24.0%
- −$1,851
- After-tax cash flow
- $6,363/yr
For passive investors: Depreciation is non-cash, so a rental often shows a tax loss while cash-flowing — sheltering income. Rental losses are passive: they offset passive income freely, and up to $25,000/yr can offset ordinary (W-2) income if you actively participate and your MAGI is under $100k (phasing out to $0 by $150k); unused losses carry forward. On sale, claimed depreciation is recaptured at up to 25%, and gains may owe capital-gains tax (a 1031 exchange can defer both). Figures are a year-1 estimate at your 24.0% rate — not tax advice; consult a CPA.
Schools (NCES district)
- District
- New Lebanon Local
- NCES district ID
- 3904871
- Math proficiency
- 43% ▼ -19.00%
- Reading proficiency
- 56% ▼ -7.00%
- Median HH income
- $45,363
- Composite
- 41.88/100
- National rank
- #3369
- State rank
- #448 of 656 in OH
Livability — New Lebanon
- Score
- 70/100
- State rank
- #450
- US rank
- #7342
Category grades
Schools grade is shown separately in the Schools card above.
Census & demographics
- County
- Montgomery · 506,435 people
- City population
- 5,923
- Metro
- Dayton-Kettering-Beavercreek, OH
- Population (ZIP)
- 5,923
- Household income
- $77,279
- Rent vs Own
- Severe rent burden
- 8.9
Population outlook (Montgomery County) Hauer SSP2
- Today (2025)
- 523,241 people
- By 2030
- 514,948 · -1.6%
- By 2040
- 493,378 · -5.7%
- By 2050
- 469,639 · -10.2%
- By 2075
- 418,360 · -20.0%
- By 2100
- 353,315 · -32.5%
Race, ethnicity, and origin ACS 2023
- Neighborhood character
- Predominantly White (92%)
- Race & ethnicity
- White 92% Two or more races 6% Black 2%
- Common ancestry
- Romanian 3% Slovak 1% Scottish 1%
- Foreign-born
- 0% · China
- Languages at home
- 98% English-only · Spanish 1% German/W. Germanic 1%
Political lean MEDSL · Montgomery
- 2024 margin
- Toss-up / Even · D 49.8% · R 49.3%
- 2008→2024 swing
- -5.8pp toward R · 2008: 6.2pp · 2024: 0.5pp
- All cycles
- 2024: D+0.5 2020: D+2.2 2016: R+1.2 2012: D+3.1 2008: D+6.2
Not yet ingested
- Civics
- —
Market trends
- HPI YoY
- ▲ 27.56%
- Current HPI
- 370.29
- Rent YoY
- —
- Metro
- —
- State GDP YoY
- ▲ 1.98%
- F500 in state
- 48
Industry mix (Fortune 500 HQ in OH)
| Industry | F500 HQs | Revenue |
|---|---|---|
| Insurance | 3 | $145B |
|
||
| Industrial Machinery | 3 | $49B |
|
||
| Financial Services | 3 | $24B |
|
||
| Consumer Goods | 2 | $93B |
|
||
| Aerospace / Defense | 2 | $47B |
|
||
| Utilities | 2 | $33B |
|
||
Price history
+66.7% since first listed3 events — show timeline
- 2026-05-16 Pending — Dayton MLS
- 2026-05-14 Listed $65,000 Dayton MLS
- 1983-12-08 Sold (Public Records) $39,000 Public Records
Property tax history
+2.1%/yrLatest (2025): $2,242 · -0.1% YoY. Source: county tax records.
Cash-flow waterfall
monthlySold comps — $/sqft
last 12 mo · ≤1 miLoading sold comps…