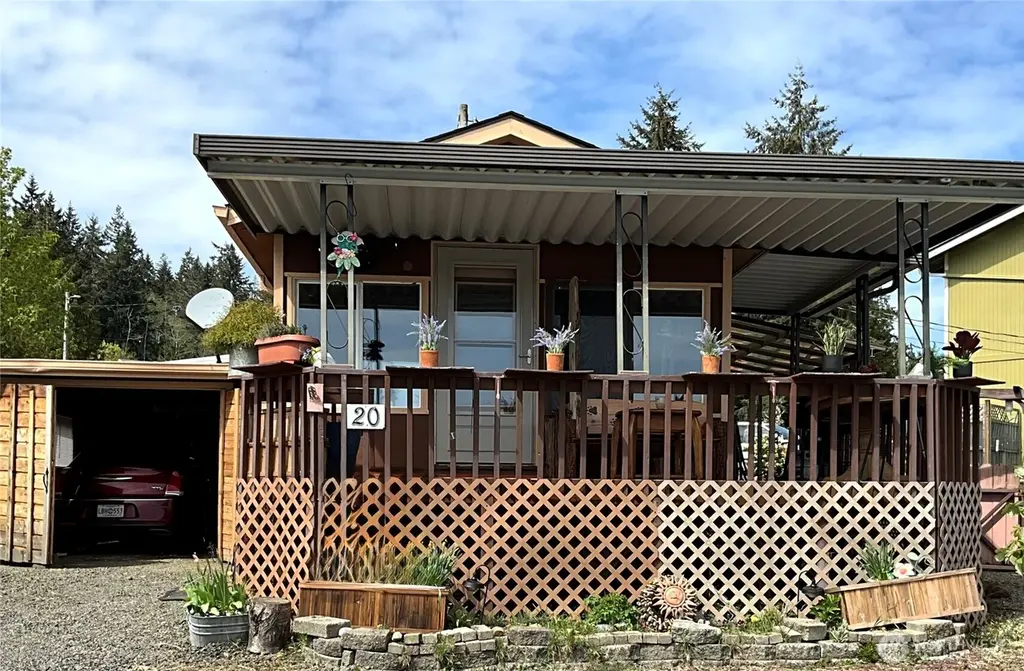
18289 E State Route 3 (WA-3) #20 · Allyn, WA
Flood risk 1/10 · Minimal
- FEMA flood zone
- X (unshaded)
- Chance of flooding over 30 yrs
- 0.0%
- Est. flood insurance / yr
- $507 – $1,088
Fire risk 3/10 · Minor
- Est. fire insurance / yr
- $604 – $1,122
Heat risk 3/10 · Minor
- Hot days now (above 87°F)
- 7 days/yr
- Hot days in 30 yrs
- 14 days/yr
Wind risk 1/10 · Minimal
- Chance of severe wind over 30 yrs
- —
Air-quality risk 6/10 · Moderate
- Unhealthy air days now
- 7 days/yr
- Unhealthy air days in 30 yrs
- 8 days/yr
Risk factors via First Street. Map © Google.
Why this score? — see what drove the B grade
The composite is a weighted blend of 9 inputs, each scored 0–100. Each bar is that input's sub-score; the figure is the points it added to the 100-point composite (weight × sub-score).
- Cash flow +30.0/30.0
- 1% rule +10.0/10.0
- DSCR +10.0/10.0
- ARV discount +7.5/15.0
- Condition / age +3.8/5.0
- Schools +3.5/10.0
- Livability +3.4/5.0
- Rent growth +2.5/5.0
- Appreciation +0.0/10.0
$75,000
🖨 Deal sheet 📄 Offer letter ✓ Due diligence
Listing remarks
Water Views & Easy Living – 55+ Community in Allyn! Enjoy the simplicity of low-maintenance living paired with beautiful water views in this fully remodeled manufactured home in the heart of Allyn. Located in a welcoming 55+ community, this home offers comfort, convenience, and style—all in one package. Step inside to find a thoughtfully updated interior that’s move-in ready, so you can skip the projects and start enjoying your new space right away. The enclosed porch is a standout feature, offering the perfect spot to take in peaceful water views—whether it’s morning coffee or winding down at sunset. Outside, the spacious, mostly fenced yard provides roo
Key facts
- Garage
- Built 1987
- Listed 40 days
Neighborhood map
What this means for you Summary
Snapshot
- This is a 1-bed/1.0-bath manufactured listed at $75k. Condition is rated good.
Deal economics
- At list price, monthly cash flow is $693 ($8k/yr) — positive.
- The deal already cash-flows at list — no discount required.
- Meets the 1% rule at list price ($2k rent vs $75k).
- Recommended offer: $73k (3.0% below list) — sets the bar for market timing.
- Cap rate 17.4% vs local median 3.1% in Allyn — top-decile yield for the area; either an underpriced asset or a hidden risk that comps aren't pricing in. Stress-test before assuming the spread holds.
Location & tenants
- Location reads 68/100 on livability (#287 in WA) — a middle-class / working-renter tenant base. Strengths: crime A+, employment A+, housing A+; Watch: health & safety C-, schools D-, amenities F.
- North Mason School District (rural): math 32% / reading 41% proficiency, ranked #233 of 291 in WA (top 80%) — families likely to look elsewhere, expect single-tenant / working-renter base with shorter leases.
- Market conditions: 91 active listings in the ZIP; 299 units permitted in Mason County in 2024 (0 in 5+ unit buildings).
Forward outlook
- Local home prices are declining (-3.0%/yr); year-one equity from $519 of loan paydown is wiped out by about $2k of value loss. Plan a longer hold.
- Mason County population projected at -14% by 2050 — secular population decline; favor cash flow + early exit over multi-decade hold.
- At projected returns (-3.0% appreciation + 3.0% rent growth), your $21k cash investment doubles in ~3 years — after that, you're playing with house money.
Negotiation context
- It's been on market 40 days — a 3% lower offer ($73k) is reasonable based on typical stale-listing flexibility.
- 2 sale attempts since 16y ago; this cycle's ask has dropped $15k (17%) from the opening price — seller is motivated, your offer sets the floor, not the list.
- Current owner paid $15k; list at $75k implies a 400% gain — meaningful room to come down on a strong offer.
Questions for the listing agent
- It's been on market 40 days. Have you received any prior offers? Is the seller open to a 3% concession, seller financing, or rate buy-down credit?
- Is there a deadline driving the sale (1031 exchange, divorce, estate, relocation)? That informs how much negotiation room exists.
- Schools are D-rated, which usually means shorter tenancies and higher turnover. Who's the typical renter profile here, and what's been the actual vacancy rate?
- What's the average days-on-market for RENTAL listings here right now (not sales)? A rising rental-DOM trend means longer vacancies and softer asking-rent achievability than the comps imply.
- What's the recent tenant-quality profile in this submarket — average credit score on applications, eviction rate, late-payment / NSF rate, and stable-employment percentage? A property-management company in the area should have these aggregated.
- How much new for-sale + rental construction is in the pipeline within 1–3 miles? Heavy new supply typically softens prices + rents 12–24 months out; constrained supply supports both.
Investment metrics
- 1% rule
- 2.04% ✓
- Cap rate
- 17.38%
- Cash-on-cash
- 39.61%
- DSCR
- 2.76
- GRM
- 4.1
CMA / ARV
No comps found within radius.
Projected returns pro-forma
-3.0% appreciation · 3.0% rent growth · sell at horizon
- IRR
- 35.9%
- Equity multiple
- 2.52×
- Total profit
- $32,018
- Equity at exit
- $11,183
- IRR
- 42.6%
- Equity multiple
- 5.04×
- Total profit
- $84,822
- Equity at exit
- $6,485
Cash invested: $21,000 (down + closing). Projections, not guarantees.
Landlord ↔ Tenant lean methodology
- Overall (STATE)
- 28 Tenant-Leaning
- State Washington
- 28 Tenant-Leaning · D+8
- County
- — inherits STATE
- City
- — inherits STATE
ZIP-level market 98524
- Active inventory
- 91
- Price-to-rent
- 4.1×
Monthly cashflow live
- Estimated rent
- $1,534 medium interval (Pro) →
- Mortgage (P&I)
- −$393
- Tax est. 1.5%
- −$94 /mo · $1,125/yr
- Insurance
- −$31
- HOA
- −$0
- Vacancy / Maint / Mgmt
- −$322
- Net cashflow
- $693
Break-even live
UW: 25.0% down · 7.5% · 30yr · 1.5% tax · 5.0% vac · 8.0% maint · 8.0% mgmt
Financing live
Cash to close
- Down payment
- $18,750
- Closing costs
- $2,250
- Reserves months
- —
- Total cash needed
- —
Loan-product check · same deal, 3 products live
Conventional
25% down · 7.5% · 30yr
- Down + closing
- —
- Monthly P&I
- —
- Monthly cashflow
- —
- DSCR
- —
- Eligible?
- —
Personal DTI + credit; lowest rate.
DSCR
20% down · 8.5% · 30yr
- Down + closing
- —
- Monthly P&I
- —
- Monthly cashflow
- —
- DSCR
- —
- Eligible?
- —
No personal income docs; deal must DSCR.
Hard money
10% down · 12.0% · 12mo
- Down + closing
- —
- Monthly P&I
- —
- Monthly cashflow
- —
- DSCR
- —
- Eligible?
- —
Short-term bridge; refi at stabilization.
Listing history 12 events
-
2026-06-18days on market $75,000 Active 40 DOM
-
2026-06-17days on market $75,000 Active 39 DOM
-
2026-06-16days on market $75,000 Active 38 DOM
-
2026-06-15price $75,000 Active 37 DOM
-
2026-06-15days on market $85,000 Active 37 DOM
-
2026-06-14days on market $85,000 Active 35 DOM
-
2026-06-13status $85,000 Active 34 DOM
-
2026-05-09price $85,000
-
2026-04-17$90,000 Active
-
2010-08-31soldstatus $15,000 Sold
-
2010-08-25status Pending
-
2010-07-06$25,000 Active
ⓘ Source: listings_history table (triggers on properties + properties_extension) + one-shot
backfill from property_details.listing_events for pre-trigger history.
Climate risk First Street
- Flood 1/10 Low FEMA zone X (unshaded) · 0% chance over 30 yrs
- Wildfire 3/10 Moderate
- Heat 3/10 Moderate 7 d/yr ≥87°F today · 14 d/yr by 30 yrs out
- Wind 1/10 Low
- Air quality 6/10 Major 7 unhealthy d/yr today · 8 by 30 yrs out
Nearby sold comps map
Loading sold comps map…
Walkable amenities ~0.75 mi
Loading nearby amenities…
Taxation est. · year 1
- Rental income
- $18,402
- − Mortgage interest
- −$4,201
- − Property taxes
- −$1,125
- − Insurance
- −$375
- − Repairs & maintenance
- −$1,472
- − Management
- −$1,472
- − Depreciation
- −$2,182
- Taxable income
- $7,575
- Est. tax owed @ 24.0%
- −$1,818
- After-tax cash flow
- $6,500/yr
For passive investors: Depreciation is non-cash, so a rental often shows a tax loss while cash-flowing — sheltering income. Rental losses are passive: they offset passive income freely, and up to $25,000/yr can offset ordinary (W-2) income if you actively participate and your MAGI is under $100k (phasing out to $0 by $150k); unused losses carry forward. On sale, claimed depreciation is recaptured at up to 25%, and gains may owe capital-gains tax (a 1031 exchange can defer both). Figures are a year-1 estimate at your 24.0% rate — not tax advice; consult a CPA.
Condition & rehab AI · 13 photos
This fully remodeled manufactured home is in good condition with a good condition score of 75. It is move-in ready and offers a good ROI with minimal repairs needed.
Value-add opportunities
- Resale Painting the exterior — Enhances curb appeal and can increase the home's value.
- Rental Landscaping the yard — Improves the property's rental appeal and can attract more tenants.
Renovation cost estimate screening
Value-add ROI direction
- Resale Painting the exterior — Enhances curb appeal and can increase the home's value. ↑
- Rental Landscaping the yard — Improves the property's rental appeal and can attract more tenants. ↑
ⓘ Cost ranges are severity-bucket heuristics (US national rule-of-thumb). Get contractor quotes + a written scope before underwriting a rehab budget.
Schools (NCES district)
- District
- North Mason School District
- NCES district ID
- 5305790
- Math proficiency
- 32% ▼ -4.00%
- Reading proficiency
- 41% ▼ -5.00%
- Median HH income
- $55,458
- Composite
- 34.67/100
- National rank
- #10069
- State rank
- #233 of 291 in WA
Livability — Allyn
- Score
- 68/100
- State rank
- #287
- US rank
- #10039
Category grades
Schools grade is shown separately in the Schools card above.
Census & demographics
- Census place
- Allyn, WA
- Population (ZIP)
- 4,585
Population outlook (Mason County) Hauer SSP2
- Today (2025)
- 60,005 people
- By 2030
- 58,567 · -2.4%
- By 2040
- 54,735 · -8.8%
- By 2050
- 51,470 · -14.2%
- By 2075
- 46,276 · -22.9%
- By 2100
- 39,883 · -33.5%
Race, ethnicity, and origin ACS 2023
- Neighborhood character
- Predominantly White (84%)
- Race & ethnicity
- White 84% Two or more races 11% Hispanic / Latino 10% Asian 1%
- Hispanic origin (detail)
- Mexican 3% Puerto Rican 1%
- Common ancestry
- Italian 10% Slovak 9% Portuguese 4%
- Foreign-born
- 5% · Canada, Jamaica
- Languages at home
- 93% English-only · Spanish 4% German/W. Germanic 1% Tagalog/Filipino 1%
Political lean MEDSL · Mason
- 2024 margin
- Toss-up / Even · D 47.2% · R 49.7% · Other 3.2%
- 2008→2024 swing
- -11.2pp toward R · 2008: 8.7pp · 2024: -2.5pp
- All cycles
- 2024: R+2.5 2020: R+3.9 2016: R+6.0 2012: D+6.9 2008: D+8.7
Not yet ingested
- Civics
- —
Market trends
- HPI YoY
- ▼ -154.76%
- Current HPI
- 183.7245
- Rent YoY
- —
- Metro
- —
- State GDP YoY
- ▲ 4.65%
- F500 in state
- 22
Industry mix (Fortune 500 HQ in WA)
| Industry | F500 HQs | Revenue |
|---|---|---|
| Retail | 2 | $269B |
|
||
| Technology / Retail | 1 | $638B |
|
||
| Technology | 1 | $245B |
|
||
| Telecommunications | 1 | $38B |
|
||
| Food / Beverage | 1 | $36B |
|
||
| Automotive / Trucks | 1 | $34B |
|
||
Price history
+240.0% since first listed5 events — show timeline
- 2026-05-09 Price Changed $85,000 NWMLS as Distributed by MLS Grid
- 2026-04-17 Listed $90,000 NWMLS as Distributed by MLS Grid
- 2010-08-31 Sold (MLS) $15,000 NWMLS as Distributed by MLS Grid
- 2010-08-25 Pending — NWMLS as Distributed by MLS Grid
- 2010-07-06 Listed $25,000 NWMLS as Distributed by MLS Grid
Cash-flow waterfall
monthlySold comps — $/sqft
last 12 mo · ≤1 miLoading sold comps…