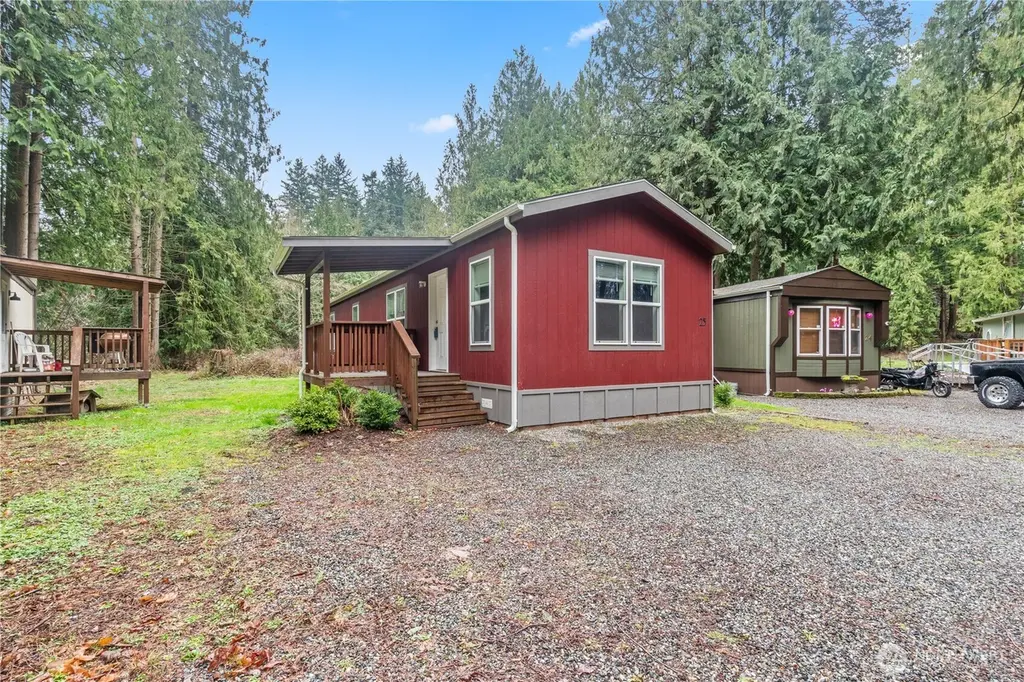
3557 Cedarville Rd #25 · Deming, WA
Flood risk No data
- FEMA flood zone
- —
- Chance of flooding over 30 yrs
- —
- Est. flood insurance / yr
- —
Fire risk No data
- Est. fire insurance / yr
- —
Heat risk No data
- Hot days now (above threshold)
- —
- Hot days in 30 yrs
- —
Wind risk No data
- Chance of severe wind over 30 yrs
- —
Air-quality risk No data
- Unhealthy air days now
- —
- Unhealthy air days in 30 yrs
- —
Risk factors via First Street. Map © Google.
Why this score? — see what drove the C+ grade
The composite is a weighted blend of 9 inputs, each scored 0–100. Each bar is that input's sub-score; the figure is the points it added to the 100-point composite (weight × sub-score).
- Cash flow +24.7/30.0
- ARV discount +15.0/15.0
- DSCR +8.0/10.0
- 1% rule +5.4/10.0
- Schools +4.2/10.0
- Rent growth +2.6/5.0
- Livability +2.5/5.0
- Condition / age +2.5/5.0
- Appreciation +0.0/10.0
$179,000
🖨 Deal sheet (PDF) 📄 Offer letter ✓ Due diligence
Listing remarks
Beautiful 2022 single-wide manufactured home offering 2 bedrooms and 1 full bathroom with a bright, open-concept layout. The spacious kitchen features abundant cabinetry, plenty of natural light, and flows seamlessly into the inviting living area. Large windows throughout create a warm and airy feel. Situated on a private, spacious lot in the highly desirable Mt. Baker Mobile Home Park in the county, this peaceful community is less than 15 minutes from Bellingham. Conveniently located on the way to the North Cascades and Mt. Baker, perfect for outdoor enthusiasts. Well-managed park with affordable space rent, and homes here rarely become available. Now offered with a $10,000 price reduction
Key facts
- 2 parking spots
- Built 2022
- Listed 35 days
Property features AI
Finance
- Other: Calculated living area 840 square feet; Structure type: Manufactured house; Style: Manufactured single wide
- Financial info: Listing terms: Cash or Conventional
- HOA & community: Located in Mt Baker Mobile Home Park (23 homes in park); Park approved for sale; Pets allowed: cats OK, dogs OK (see remarks); Land lease: $575
Exterior
- Parking: Uncovered parking; 2 open parking spaces
- Utilities: Electric power; Shared well water; Mt Baker Mobile Home Park septic sewer; Internet: Astound
- Home design: Manufactured home (single wide); One story; 2022 ALBANY model; Very good condition; Mobile home remains in place
- Construction: Wood construction; Composition roof; Tie down foundation
- Exterior features: Wood exterior / wood products; Patio/porch/deck; Has a view; Skirted with wood
Interior
- Kitchen: Dishwasher; Refrigerator; Stove/Range; Kitchen with eating space
- Bedrooms: 2 bedrooms
- Flooring: Vinyl plank
- Bathrooms: 1 full bathroom (includes 1 bathtub and 1 shower)
- Heating & cooling: Forced air heating; No central cooling
- Interior features: Water heater; Double pane windows; Ceiling fan(s); Bath off primary; Patio/porch/deck
- Laundry & utility: Water heater located in primary bedroom
Neighborhood map
What this means for you Summary
Snapshot
- This is a 2-bed/1.5-bath manufactured listed at $179k.
Deal economics
- At list price, monthly cash flow is $376 ($5k/yr) — positive.
- The deal already cash-flows at list — no discount required.
- Meets the 1% rule at list price ($2k rent vs $179k).
- Recommended offer: $174k (3.0% below list) — sets the bar for market timing.
Location & tenants
- Location reads 50/100 on livability (#579 in WA) — a working-class tenant base; expect higher turnover. Strengths: housing A+, crime A; Watch: health & safety D, amenities F, commute F.
- Mount Baker School District (rural): math 40% / reading 53% proficiency, ranked #165 of 291 in WA (top 57%) — families likely to look elsewhere, expect single-tenant / working-renter base with shorter leases.
- Zoned schools: Harmony Elementary (309 students, 45% FRL); Mount Baker Senior High (517 students, 47% FRL) — zoned schools at 46% FRL track the district average.
- Market conditions: Rents flat; 380 active listings in the ZIP; solid renter incomes; 1,190 units permitted in Whatcom County in 2024 (327 in 5+ unit buildings).
Forward outlook
- Local home prices are declining (-3.0%/yr); year-one equity from $1k of loan paydown is wiped out by about $5k of value loss. Plan a longer hold.
- Whatcom County population projected at +28% by 2050 — long-run rental-demand tailwind backs the buy-and-hold thesis.
Negotiation context
- It's been on market 35 days — a 3% lower offer ($174k) is reasonable based on typical stale-listing flexibility.
- 4 sale attempts since 19y ago with the ask held roughly flat each time — persistent listings suggest the price (not the market) is what's stuck; bring a comps-based counter.
- Current owner paid $50k; list at $179k implies a 259% gain — meaningful room to come down on a strong offer.
Questions for the listing agent
- It's been on market 35 days. Have you received any prior offers? Is the seller open to a 3% concession, seller financing, or rate buy-down credit?
- Is there a deadline driving the sale (1031 exchange, divorce, estate, relocation)? That informs how much negotiation room exists.
- Schools are D-rated, which usually means shorter tenancies and higher turnover. Who's the typical renter profile here, and what's been the actual vacancy rate?
- What's the average days-on-market for RENTAL listings here right now (not sales)? A rising rental-DOM trend means longer vacancies and softer asking-rent achievability than the comps imply.
- What's the recent tenant-quality profile in this submarket — average credit score on applications, eviction rate, late-payment / NSF rate, and stable-employment percentage? A property-management company in the area should have these aggregated.
- How much new for-sale + rental construction is in the pipeline within 1–3 miles? Heavy new supply typically softens prices + rents 12–24 months out; constrained supply supports both.
Investment metrics
- 1% rule
- 1.04% ✓
- Cap rate
- 8.81%
- Cash-on-cash
- 8.99%
- DSCR
- 1.40
- GRM
- 8.0
CMA / ARV
- ARV (median comp)
- $299,921
- List price
- $179,000
- Delta
- -40.32%
- Verdict
- UNDERPRICED
- Comps
- 1 within 2.0 mi
Show comp detail 1 sale within ~0.75 mi
| Address | Dist | Beds/Ba | Sqft | Sold | Price | $/sf | Match |
|---|---|---|---|---|---|---|---|
| 3557 Cedarville Rd #2 | 0.09mi | 3/2.0 (+1) | 924 (+10%) | 24mo | $149,000 | $161 | 52 |
Match score weights: distance 35% · size 25% · config 20% · recency 20%. Top-matched comps best support the ARV.
Projected returns pro-forma
-3.0% appreciation · 0.42% rent growth · sell at horizon
- IRR
- -5.4%
- Equity multiple
- 0.80×
- Total profit
- $-9,847
- Equity at exit
- $26,689
- IRR
- 1.2%
- Equity multiple
- 1.07×
- Total profit
- $3,661
- Equity at exit
- $15,477
Cash invested: $50,120 (down + closing). Projections, not guarantees.
Landlord ↔ Tenant lean methodology
- Overall (STATE)
- 28 Tenant-Leaning
- State Washington
- 28 Tenant-Leaning · D+8
- County
- — inherits STATE
- City
- — inherits STATE
ZIP-level market 98226
- Rents YoY
- 0.4%
- Active inventory
- 380
- Price-to-rent
- 8.0×
Monthly cashflow live
- Estimated rent
- $1,857 medium interval (Pro) →
- Mortgage (P&I)
- −$939
- Tax from tax record
- −$78 /mo · $940/yr
- Insurance
- −$75
- HOA
- −$0
- Vacancy / Maint / Mgmt
- −$390
- Net cashflow
- $376
Break-even live
Sensitivity live
| Price | -10% $477 | -5% $426 | +0% $376 | +5% $325 | +10% $274 |
|---|---|---|---|---|---|
| Rent | -10% $229 | -5% $302 | +0% $376 | +5% $449 | +10% $522 |
| Rate | -1.0pp $466 | -0.5pp $421 | base $376 | +0.5pp $329 | +1.0pp $282 |
UW: 25.0% down · 7.5% · 30yr · 1.5% tax · 5.0% vac · 8.0% maint · 8.0% mgmt
Financing live
Cash to close
- Down payment
- $44,750
- Closing costs
- $5,370
- Reserves months
- —
- Total cash needed
- —
Loan-product check · same deal, 3 products live
Conventional
25% down · 7.5% · 30yr
- Down + closing
- —
- Monthly P&I
- —
- Monthly cashflow
- —
- DSCR
- —
- Eligible?
- —
Personal DTI + credit; lowest rate.
DSCR
20% down · 8.5% · 30yr
- Down + closing
- —
- Monthly P&I
- —
- Monthly cashflow
- —
- DSCR
- —
- Eligible?
- —
No personal income docs; deal must DSCR.
Hard money
10% down · 12.0% · 12mo
- Down + closing
- —
- Monthly P&I
- —
- Monthly cashflow
- —
- DSCR
- —
- Eligible?
- —
Short-term bridge; refi at stabilization.
Listing history 25 events
-
2026-06-18days on market $179,000 Active 35 DOM
-
2026-06-17days on market $179,000 Active 34 DOM
-
2026-06-16days on market $179,000 Active 33 DOM
-
2026-06-15days on market $179,000 Active 32 DOM
-
2026-06-14days on market $179,000 Active 30 DOM
-
2026-06-13days on market $179,000 Active 29 DOM
-
2026-06-10days on market $179,000 Active 27 DOM
-
2026-06-09days on market $179,000 Active 26 DOM
-
2026-06-08days on market $179,000 Active 25 DOM
-
2026-06-07days on market $179,000 Active 24 DOM
-
2026-06-05days on market $179,000 Active 21 DOM
-
2026-06-02days on market $179,000 Active 19 DOM
-
2026-06-01days on market $179,000 Active 18 DOM
-
2026-05-31days on market $179,000 Active 17 DOM
-
2026-05-30days on market $179,000 Active 16 DOM
-
2026-05-14$179,000 Active
-
2013-10-31historical
-
2013-10-31soldstatus $49,900 Sold
-
2013-10-15status Pending Inspection
-
2013-10-08status Active
-
2013-09-16status Pending Inspection
-
2013-03-12$49,900 Active
-
2008-07-01soldstatus $45,000
-
2008-07-01historical
-
2007-05-24$47,500
ⓘ Source: listings_history table (triggers on properties + properties_extension) + one-shot
backfill from property_details.listing_events for pre-trigger history.
Tax reassessment forecast WA · Resets to sale price
- Current annual tax
- $940 · $78/mo
- Projected year-2 tax
- $1,754 · $146/mo
- Expected delta
- +$814/yr (+$68/mo · 86.5%)
ⓘ Screening estimate from a state-policy table — verify with the county assessor before closing.
Nearby sold comps map
Loading sold comps map…
Walkable amenities ~0.75 mi
Loading nearby amenities…
Taxation est. · year 1
- Rental income
- $22,287
- − Mortgage interest
- −$10,027
- − Property taxes
- −$940
- − Insurance
- −$895
- − Repairs & maintenance
- −$1,783
- − Management
- −$1,783
- − Depreciation
- −$5,207
- Taxable income
- $1,651
- Est. tax owed @ 24.0%
- −$396
- After-tax cash flow
- $4,110/yr
For passive investors: Depreciation is non-cash, so a rental often shows a tax loss while cash-flowing — sheltering income. Rental losses are passive: they offset passive income freely, and up to $25,000/yr can offset ordinary (W-2) income if you actively participate and your MAGI is under $100k (phasing out to $0 by $150k); unused losses carry forward. On sale, claimed depreciation is recaptured at up to 25%, and gains may owe capital-gains tax (a 1031 exchange can defer both). Figures are a year-1 estimate at your 24.0% rate — not tax advice; consult a CPA.
Schools (NCES district)
- District
- Mount Baker School District
- NCES district ID
- 5305310
- Math proficiency
- 40% ▲ 3.00%
- Reading proficiency
- 53% ▼ -1.00%
- Median HH income
- $53,695
- Composite
- 42.37/100
- National rank
- #6931
- State rank
- #165 of 291 in WA
Livability — Deming
- Score
- 50/100
- State rank
- #579
- US rank
- #25543
Category grades
Schools grade is shown separately in the Schools card above.
Census & demographics
- County
- Whatcom County · 209,776 people
- Metro
- Bellingham, WA
- Population (ZIP)
- 46,782
- Household income
- $79,375
- Rent vs Own
- Severe rent burden
- 2061.0
Population outlook (Whatcom County) Hauer SSP2
- Today (2025)
- 240,408 people
- By 2030
- 254,667 · +5.9%
- By 2040
- 281,365 · +17.0%
- By 2050
- 307,592 · +27.9%
- By 2075
- 375,576 · +56.2%
- By 2100
- 421,637 · +75.4%
Race, ethnicity, and origin ACS 2023
- Neighborhood character
- Predominantly White (72%)
- Race & ethnicity
- White 72% Two or more races 10% Hispanic / Latino 9% Asian 6% Native American 5% Black 1%
- Hispanic origin (detail)
- Mexican 6%
- Common ancestry
- Portuguese 6% Iranian 4% Slovak 4%
- Foreign-born
- 11% · Canada, China, Vietnam
- Languages at home
- 88% English-only · Spanish 5% Chinese 2% Other Indo-European 1%
Political lean MEDSL · Whatcom
- 2024 margin
- Strong D (+24.9) · D 60.8% · R 35.9% · Other 3.3%
- 2008→2024 swing
- +6.9pp toward D · 2008: 18.0pp · 2024: 24.9pp
- All cycles
- 2024: D+24.9 2020: D+23.9 2016: D+17.7 2012: D+12.1 2008: D+18.0
Not yet ingested
- Civics
- —
Market trends
- HPI YoY
- ▼ -573.37%
- Current HPI
- 406.1085
- Rent YoY
- ▲ 0.42%
- Metro
- Bellingham, WA
- State GDP YoY
- ▲ 4.65%
- F500 in state
- 22
Industry mix (Fortune 500 HQ in WA)
| Industry | F500 HQs | Revenue |
|---|---|---|
| Retail | 2 | $269B |
|
||
| Technology / Retail | 1 | $638B |
|
||
| Technology | 1 | $245B |
|
||
| Telecommunications | 1 | $38B |
|
||
| Food / Beverage | 1 | $36B |
|
||
| Automotive / Trucks | 1 | $34B |
|
||
Price history
+276.8% since first listed10 events — show timeline
- 2026-05-14 Listed $179,000 NWMLS as Distributed by MLS Grid
- 2013-10-31 Delisted — NWMLS as Distributed by MLS Grid
- 2013-10-31 Sold (MLS) $49,900 NWMLS as Distributed by MLS Grid
- 2013-10-15 Pending — NWMLS as Distributed by MLS Grid
- 2013-10-08 Relisted — NWMLS as Distributed by MLS Grid
- 2013-09-16 Pending — NWMLS as Distributed by MLS Grid
- 2013-03-12 Listed $49,900 NWMLS as Distributed by MLS Grid
- 2008-07-01 Delisted — NWMLS as Distributed by MLS Grid
- 2008-07-01 Sold (MLS) $45,000 NWMLS as Distributed by MLS Grid
- 2007-05-24 Listed $47,500 NWMLS as Distributed by MLS Grid
Property tax history
+4.6%/yrLatest (2026): $940 · +40.0% YoY. Source: county tax records.
Cash-flow waterfall
monthlySold comps — $/sqft
last 12 mo · ≤1 miLoading sold comps…