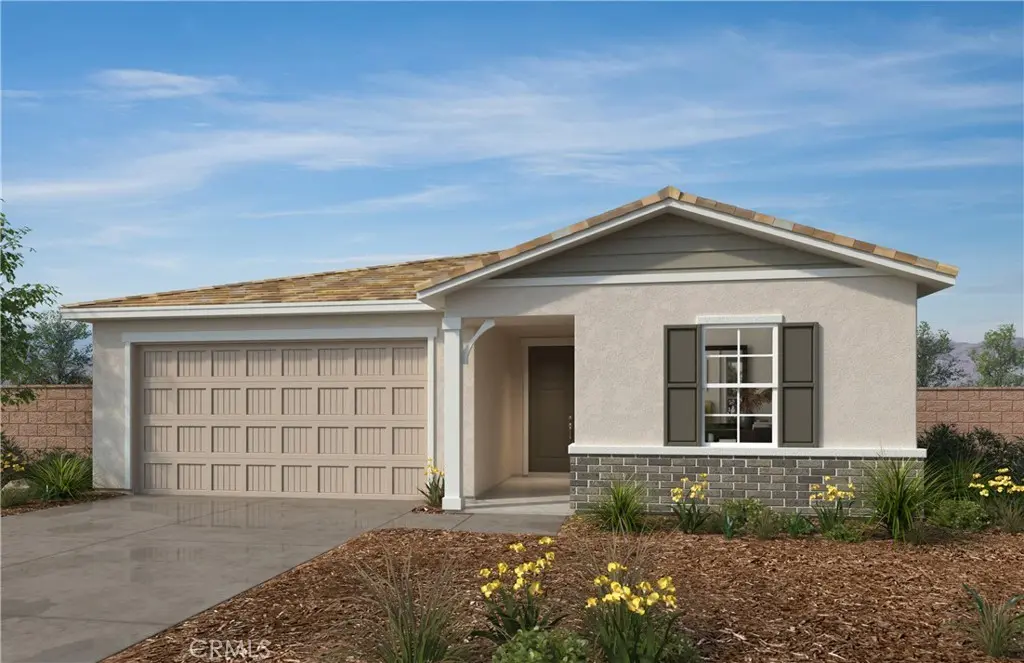
31338 white Grape Rd · Menifee, CA
Flood risk No data
- FEMA flood zone
- —
- Chance of flooding over 30 yrs
- —
- Est. flood insurance / yr
- —
Fire risk No data
- Est. fire insurance / yr
- —
Heat risk No data
- Hot days now (above threshold)
- —
- Hot days in 30 yrs
- —
Wind risk No data
- Chance of severe wind over 30 yrs
- —
Air-quality risk No data
- Unhealthy air days now
- —
- Unhealthy air days in 30 yrs
- —
Risk factors via First Street. Map © Google.
Why this score? — see what drove the D grade
The composite is a weighted blend of 9 inputs, each scored 0–100. Each bar is that input's sub-score; the figure is the points it added to the 100-point composite (weight × sub-score).
- ARV discount +10.0/15.0
- Appreciation +10.0/10.0
- Cash flow +6.2/30.0
- Schools +4.5/10.0
- Livability +3.2/5.0
- Condition / age +2.5/5.0
- Rent growth +2.3/5.0
- 1% rule +1.4/10.0
- DSCR +0.5/10.0
$575,063
🖨 Deal sheet 📄 Offer letter ✓ Due diligence
Listing remarks
Beautiful Hudson newest Community in Winchester, CA! Offering all electric, solar-powered homes to help maximize home energy efficiency and comfort. This brand-new energy star home is 1470 square feet, 3 bedrooms and 2 bathrooms. The spacious great room overlooks a modern kitchen with upgraded Stainless Steel appliances including Refrigerator, Granite counter tops, Moen fixtures as well as white shaker style cabinets. Primary bedroom and both secondary bedrooms have spacious closets. Design showroom flooring is included, as well as interior blinds. This home comes with a 10-year limited warranty backed by one of the nation's largest home builders. This community will include a proposed cit
Key facts
- Spacious closets
- Energy efficiency
- Granite counter tops
Tags
Property features AI
Finance
- Other: No ADU; No common walls; Total units: 1; Total stories: 1
- Financial info: Mello-Roos assessments
- HOA & community: Part of an association; Association maintains grounds; Community features: curbs, street lighting, storm drains, sidewalks
Exterior
- Parking: Attached garage; 2-car garage / 2 parking spaces
- Utilities: Public sewer; District/public water; Solar energy generation; Water flow control
- Home design: House; Single-story (one level); Front entry
- Construction: Built by builder (year source: Builder)
- Exterior features: Sprinklers; Sprinklers drip system; No pool; Has view
Interior
- Kitchen: Quartz counters; Energy Star appliances; Microwave; Electric range; Electric oven
- Bedrooms: 3 bedrooms on the main level; All bedrooms on main level
- Flooring: Vinyl
- Bathrooms: 2 full bathrooms; Bathtub; Walk-in shower; Shower
- Heating & cooling: Energy Star heating; Central cooling (Energy Star)
- Interior features: Open floor plan; Granite counters; Energy Star doors; Energy Star windows
- Laundry & utility: Laundry room inside (individual room)
Neighborhood map
What this means for you Summary
Snapshot
- This is a 3-bed/2.0-bath single-family listed at $575k.
Deal economics
- At list price, monthly cash flow is $-1k ($-13k/yr) — negative.
- To cash-flow at today's rent, offer at most $424k (26.3% below list).
- To meet the 1% rule (rent ≥ 1% of price), the offer needs to be $371k (35.5% below list).
- Recommended offer: $371k (35.5% below list) — sets the bar for 1% rule.
Location & tenants
- Location reads 64/100 on livability (#407 in CA) — a middle-class / working-renter tenant base. Strengths: housing A+, crime A, employment A-; Watch: schools D+, health & safety D+, amenities D.
- Menifee Union Elementary (suburban): math 43% / reading 56% proficiency, ranked #434 of 1,400 in CA (top 31%) — families likely to look elsewhere, expect single-tenant / working-renter base with shorter leases.
- Market conditions: Rents soft (-0.8%/yr); 355 active listings in the ZIP; 3 comparable units currently listed for rent nearby; rentals leasing fast (median 3d on market — plan ~1-2 weeks tenant-placement turnaround); high-income renter base; 9,195 units permitted in Riverside County in 2024 (1,512 in 5+ unit buildings).
- This rent runs 34% of the median local income ($133k/yr) — at the standard rent-burdened threshold; future hikes will face affordability resistance.
Forward outlook
- In year one you build about $61k of equity ($4k loan paydown + $58k appreciation (10.0% local appreciation)).
- Riverside County population projected at +22% by 2050 — long-run rental-demand tailwind backs the buy-and-hold thesis.
- By year 2, paydown + projected appreciation supports a ~$99k cash-out refi (75% LTV) — recoverable capital for the next deal without selling this one.
Negotiation context
- Only 6 days on market — expect competitive offers; lowballing is unlikely to land.
Questions for the listing agent
- What do current leases actually rent for vs. the listed asking? Can we see a recent rent roll and the last 12 months of T-12 income?
- Is there a deadline driving the sale (1031 exchange, divorce, estate, relocation)? That informs how much negotiation room exists.
- Schools are D-rated, which usually means shorter tenancies and higher turnover. Who's the typical renter profile here, and what's been the actual vacancy rate?
- The area grade is low — what's the realistic commute time and amenity access for the typical tenant pool here? Any planned neighborhood developments (good or bad) we should know about?
- What's the average days-on-market for RENTAL listings here right now (not sales)? A rising rental-DOM trend means longer vacancies and softer asking-rent achievability than the comps imply.
- What's the recent tenant-quality profile in this submarket — average credit score on applications, eviction rate, late-payment / NSF rate, and stable-employment percentage? A property-management company in the area should have these aggregated.
- How much new for-sale + rental construction is in the pipeline within 1–3 miles? Heavy new supply typically softens prices + rents 12–24 months out; constrained supply supports both.
Investment metrics
- 1% rule
- 0.64% ✗
- Cap rate
- 4.11%
- Cash-on-cash
- -7.78%
- DSCR
- 0.65
- GRM
- 12.9
CMA / ARV
- ARV (on-the-fly)
- $608,580
- Comps found
- 12
Show comp detail 12 sales within ~0.75 mi
| Address | Dist | Beds/Ba | Sqft | Sold | Price | $/sf | Match |
|---|---|---|---|---|---|---|---|
| 31143 London Plane Dr | 0.21mi | 3/2.0 | 1,352 (-8%) | 0mo | $564,060 | $417 | 77 |
| 31313 Burflower Dr | 0.25mi | 3/2.0 | 1,576 (+7%) | 1mo | $596,610 | $379 | 75 |
| 31095 London Plane Dr | 0.24mi | 3/2.0 | 1,352 (-8%) | 1mo | $564,490 | $418 | 74 |
| 31361 Burflower Dr | 0.29mi | 3/2.0 | 1,576 (+7%) | 0mo | $594,990 | $378 | 74 |
| 31147 Southern Oak Dr | 0.25mi | 3/2.0 | 1,352 (-8%) | 3mo | $564,990 | $418 | 73 |
| 30192 Southern Oak Dr | 0.27mi | 3/2.0 | 1,352 (-8%) | 3mo | $573,185 | $424 | 72 |
| 31188 Southern Oak Dr | 0.28mi | 3/2.0 | 1,352 (-8%) | 3mo | $565,000 | $418 | 71 |
| 31195 Southern Oak Dr | 0.26mi | 3/2.0 | 1,352 (-8%) | 6mo | $559,990 | $414 | 69 |
| 31443 Water Oak Dr | 0.37mi | 3/2.0 | 1,576 (+7%) | 3mo | $609,665 | $387 | 68 |
| 31382 Water Oak Dr | 0.34mi | 3/2.0 | 1,576 (+7%) | 5mo | $590,000 | $374 | 68 |
| 31430 Water Oak Dr | 0.37mi | 3/2.0 | 1,576 (+7%) | 4mo | $594,830 | $377 | 67 |
| 31236 Southern Oak Dr | 0.29mi | 3/2.0 | 1,352 (-8%) | 7mo | $539,990 | $399 | 67 |
Match score weights: distance 35% · size 25% · config 20% · recency 20%. Top-matched comps best support the ARV.
Projected returns pro-forma
10.0% appreciation · 0.0% rent growth · sell at horizon
- IRR
- 18.1%
- Equity multiple
- 2.46×
- Total profit
- $235,875
- Equity at exit
- $518,062
- IRR
- 16.4%
- Equity multiple
- 5.52×
- Total profit
- $727,564
- Equity at exit
- $1,117,221
Cash invested: $161,018 (down + closing). Projections, not guarantees.
Landlord ↔ Tenant lean methodology
- Overall (STATE)
- 18 Strongly Tenant-Friendly
- State California
- 18 Strongly Tenant-Friendly · D+13
- County
- — inherits STATE
- City
- — inherits STATE
ZIP-level market 92596
- Home prices YoY
- 3.9%
- Rents YoY
- -0.8%
- Active inventory
- 355
- Price-to-rent
- 12.9×
Monthly cashflow live
- Estimated rent
- $3,709 medium interval (Pro) →
- Mortgage (P&I)
- −$3,016
- Tax est. 1.5%
- −$719 /mo · $8,626/yr
- Insurance
- −$240
- HOA
- −$0
- Vacancy / Maint / Mgmt
- −$779
- Net cashflow
- $-1,044
Break-even live
UW: 25.0% down · 7.5% · 30yr · 1.5% tax · 5.0% vac · 8.0% maint · 8.0% mgmt
Financing live
Cash to close
- Down payment
- $143,766
- Closing costs
- $17,252
- Reserves months
- —
- Total cash needed
- —
Loan-product check · same deal, 3 products live
Conventional
25% down · 7.5% · 30yr
- Down + closing
- —
- Monthly P&I
- —
- Monthly cashflow
- —
- DSCR
- —
- Eligible?
- —
Personal DTI + credit; lowest rate.
DSCR
20% down · 8.5% · 30yr
- Down + closing
- —
- Monthly P&I
- —
- Monthly cashflow
- —
- DSCR
- —
- Eligible?
- —
No personal income docs; deal must DSCR.
Hard money
10% down · 12.0% · 12mo
- Down + closing
- —
- Monthly P&I
- —
- Monthly cashflow
- —
- DSCR
- —
- Eligible?
- —
Short-term bridge; refi at stabilization.
Rent comps 3 comps
| Address | Beds | Baths | Sqft | Rent | $/sqft | DOM | Units | Dist |
|---|---|---|---|---|---|---|---|---|
| 31058 Water Beech Dr Winchester, CA | 3.0 | 2.5 | 1705 | $3,900 | $2.29 | 2d | 1 | 0.25mi |
| 31319 Autumn Blaze Dr Winchester, CA | 3.0 | 2.0 | 1576 | $3,350 | $2.13 | 1d | 1 | 0.33mi |
| Autumn Blaze Dr , CA | 3.0 | 2.0 | 1576 | $3,075 | $1.95 | 2d | 1 | 0.40mi |
Listing history 6 events
-
2026-06-18days on market $575,063 Active 6 DOM
-
2026-06-17days on market $575,063 Active 5 DOM
-
2026-06-16days on market $575,063 Active 4 DOM
-
2026-06-15days on market $575,063 Active 3 DOM
-
2026-06-13remarks 699-char remark
-
2026-06-13$575,063 Active 1 DOM
ⓘ Source: listings_history table (triggers on properties + properties_extension) + one-shot
backfill from property_details.listing_events for pre-trigger history.
Nearby sold comps map
Loading sold comps map…
Walkable amenities ~0.75 mi
Loading nearby amenities…
Taxation est. · year 1
- Rental income
- $44,505
- − Mortgage interest
- −$32,212
- − Property taxes
- −$8,626
- − Insurance
- −$2,875
- − Repairs & maintenance
- −$3,560
- − Management
- −$3,560
- − Depreciation
- −$16,729
- Taxable loss
- −$23,059
- Est. tax savings @ 24.0%
- +$5,534
- After-tax cash flow
- $-6,996/yr
For passive investors: Depreciation is non-cash, so a rental often shows a tax loss while cash-flowing — sheltering income. Rental losses are passive: they offset passive income freely, and up to $25,000/yr can offset ordinary (W-2) income if you actively participate and your MAGI is under $100k (phasing out to $0 by $150k); unused losses carry forward. On sale, claimed depreciation is recaptured at up to 25%, and gains may owe capital-gains tax (a 1031 exchange can defer both). Figures are a year-1 estimate at your 24.0% rate — not tax advice; consult a CPA.
Schools (NCES district)
- District
- Menifee Union Elementary
- NCES district ID
- 0624540
- Math proficiency
- 43% ▬ 0.00%
- Reading proficiency
- 56% ▲ 3.00%
- Median HH income
- $58,228
- Composite
- 45.17/100
- National rank
- #5790
- State rank
- #434 of 1400 in CA
Livability — Menifee
- Score
- 64/100
- State rank
- #407
- US rank
- #13882
Category grades
Schools grade is shown separately in the Schools card above.
Census & demographics
- County
- Riverside County · 2,287,001 people
- City population
- 111,667
- Metro
- Riverside-San Bernardino-Ontario, CA
- Population (ZIP)
- 38,981
- Household income
- $132,538
- Rent vs Own
- Severe rent burden
- 591.0
Population outlook (Riverside County) Hauer SSP2
- Today (2025)
- 2,664,475 people
- By 2030
- 2,802,692 · +5.2%
- By 2040
- 3,050,904 · +14.5%
- By 2050
- 3,256,783 · +22.2%
- By 2075
- 3,655,058 · +37.2%
- By 2100
- 3,766,594 · +41.4%
Race, ethnicity, and origin ACS 2023
- Neighborhood character
- Highly diverse neighborhood (Simpson 0.72)
- Race & ethnicity
- White 38% Hispanic / Latino 34% Two or more races 16% Asian 12% Black 6% Pacific Islander 2%
- Hispanic origin (detail)
- Mexican 29%
- Common ancestry
- Slovak 3% Italian 2% Portuguese 1%
- Foreign-born
- 14% · Canada, Vietnam
- Languages at home
- 76% English-only · Spanish 16% Tagalog/Filipino 4% Vietnamese 1%
Political lean MEDSL · Riverside
- 2024 margin
- Toss-up / Even · D 48.0% · R 49.3% · Other 2.6%
- 2008→2024 swing
- -3.6pp toward R · 2008: 2.3pp · 2024: -1.3pp
- All cycles
- 2024: R+1.3 2020: D+8.0 2016: D+4.3 2012: R+0.4 2008: D+2.3
Not yet ingested
- Civics
- —
Market trends
- HPI YoY
- ▲ 12.43%
- Current HPI
- 332.169
- Rent YoY
- ▼ -0.79%
- Metro
- Riverside-San Bernardino-Ontario, CA
- State GDP YoY
- ▲ 3.21%
- F500 in state
- 116
Industry mix (Fortune 500 HQ in CA)
| Industry | F500 HQs | Revenue |
|---|---|---|
| Technology | 27 | $1,492B |
|
||
| Financial Services | 3 | $174B |
|
||
| Retail | 3 | $44B |
|
||
| Insurance | 3 | $26B |
|
||
| Media / Entertainment | 2 | $115B |
|
||
| Pharmaceuticals / Biotech | 2 | $62B |
|
||
Price history
-2.3% since first listed3 events — show timeline
- 2026-06-13 Price Changed $575,063 CRMLS
- 2026-06-13 Price Changed $585,063 CRMLS
- 2026-06-12 Listed $588,602 CRMLS
Cash-flow waterfall
monthlySold comps — $/sqft
last 12 mo · ≤1 miLoading sold comps…