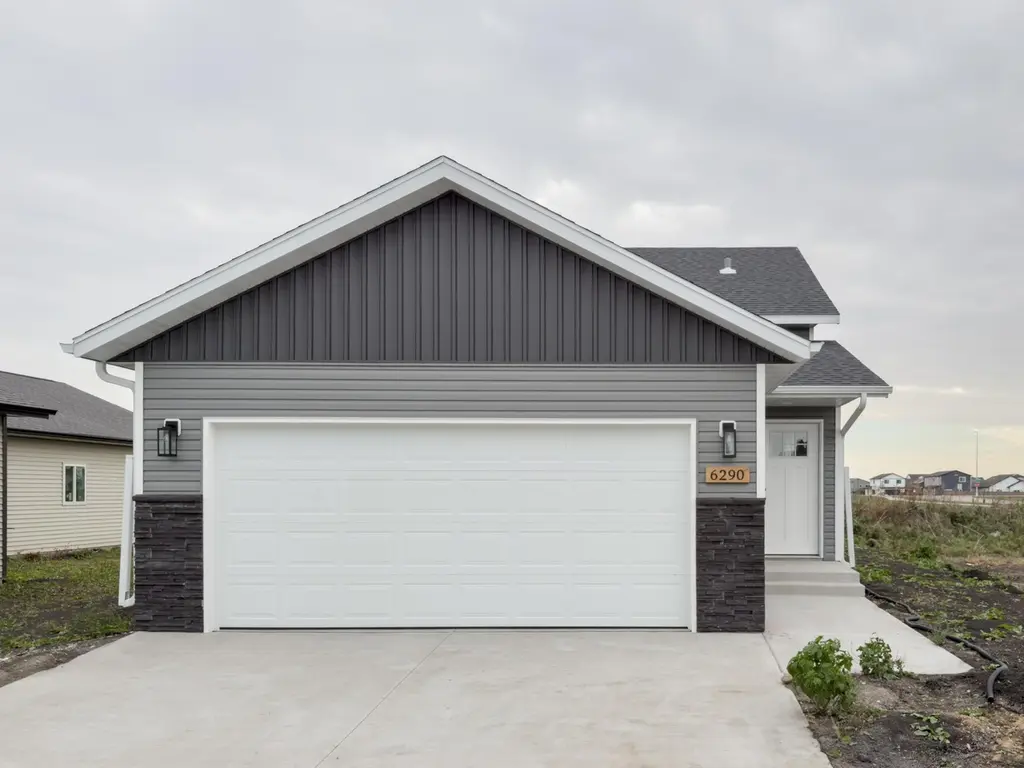
6290 87th Ave S · Horace, ND
Flood risk No data
- FEMA flood zone
- —
- Chance of flooding over 30 yrs
- —
- Est. flood insurance / yr
- —
Fire risk No data
- Est. fire insurance / yr
- —
Heat risk No data
- Hot days now (above threshold)
- —
- Hot days in 30 yrs
- —
Wind risk No data
- Chance of severe wind over 30 yrs
- —
Air-quality risk No data
- Unhealthy air days now
- —
- Unhealthy air days in 30 yrs
- —
Risk factors via First Street. Map © Google.
Why this score? — see what drove the D- grade
The composite is a weighted blend of 9 inputs, each scored 0–100. Each bar is that input's sub-score; the figure is the points it added to the 100-point composite (weight × sub-score).
- Cash flow +11.8/30.0
- ARV discount +7.5/15.0
- Condition / age +4.0/5.0
- Schools +3.7/10.0
- Livability +3.7/5.0
- DSCR +3.5/10.0
- 1% rule +3.3/10.0
- Rent growth +2.5/5.0
- Appreciation +0.0/10.0
$291,900
🖨 Deal sheet 📄 Offer letter ✓ Due diligence
Key facts
- Spacious island
- Recessed lighting
- Stunning kitchen
Tags
Property features AI
Finance
- Other: Built by BROOKSTONE PROPERTY, LLC
Exterior
- Parking: Attached 2-car garage
- Utilities: City water; City sewer; Natural gas
- Home design: Residential split-entry (bi-level) home; New construction; Asphalt roof
- Construction: Concrete foundation area; Asphalt roof
- Exterior features: Stone and vinyl exterior; Lot approximately 0.14 acres (dimensions 45 x 135)
Interior
- Kitchen: Range; Dishwasher; Microwave; Refrigerator
- Bedrooms: 3 bedrooms (mix of upper and lower levels)
- Bathrooms: 2 full bathrooms (one on upper level, one on lower level)
- Heating & cooling: Forced air heating; Central air conditioning
- Interior features: Finished basement with concrete construction; Dishwasher, Microwave, Range, Refrigerator
- Laundry & utility: Utility room on lower level
Neighborhood map
What this means for you Summary
Snapshot
- This is a 3-bed/2.0-bath other listed at $292k. Condition is rated good.
Deal economics
- At list price, monthly cash flow is $-82 ($-984/yr) — negative.
- To cash-flow at today's rent, offer at most $277k (5.0% below list).
- To meet the 1% rule (rent ≥ 1% of price), the offer needs to be $244k (16.5% below list).
- Recommended offer: $244k (16.5% below list) — sets the bar for 1% rule.
- Cap rate 6.0% vs local median 4.0% in Horace — top-decile yield for the area; either an underpriced asset or a hidden risk that comps aren't pricing in. Stress-test before assuming the spread holds.
Location & tenants
- Location reads 74/100 on livability (#29 in ND, #4,718 nationally) — a middle-class / working-renter tenant base. Strengths: crime A+, employment A+, housing A+; Watch: cost of living C-, health & safety D+, amenities F.
- West Fargo 6 (suburban): math 41% / reading 42% proficiency, ranked #26 of 53 in ND (top 49%) — families likely to look elsewhere, expect single-tenant / working-renter base with shorter leases.
- Market conditions: 458 active listings in the ZIP; 4 comparable units currently listed for rent nearby; rentals at typical pace (median 21d on market — plan ~3-4 weeks tenant-placement turnaround); high-income renter base; 1,218 units permitted in Cass County in 2024 (410 in 5+ unit buildings).
Forward outlook
- Local home prices are declining (-3.0%/yr); year-one equity from $2k of loan paydown is wiped out by about $9k of value loss. Plan a longer hold.
- Cass County population projected at +69% by 2050 — long-run rental-demand tailwind backs the buy-and-hold thesis.
Negotiation context
- It's been on market 20 days — a 2% lower offer ($288k) is reasonable based on typical stale-listing flexibility.
- 2 sale attempts with the ask held roughly flat each time — persistent listings suggest the price (not the market) is what's stuck; bring a comps-based counter.
Questions for the listing agent
- What do current leases actually rent for vs. the listed asking? Can we see a recent rent roll and the last 12 months of T-12 income?
- Is there a deadline driving the sale (1031 exchange, divorce, estate, relocation)? That informs how much negotiation room exists.
- Schools are A-rated — typically a magnet for longer-tenancy family renters. What's the average tenant stay here, and is there a school-zone premium baked into asking?
- The area grade is low — what's the realistic commute time and amenity access for the typical tenant pool here? Any planned neighborhood developments (good or bad) we should know about?
- What's the average days-on-market for RENTAL listings here right now (not sales)? A rising rental-DOM trend means longer vacancies and softer asking-rent achievability than the comps imply.
- What's the recent tenant-quality profile in this submarket — average credit score on applications, eviction rate, late-payment / NSF rate, and stable-employment percentage? A property-management company in the area should have these aggregated.
- How much new for-sale + rental construction is in the pipeline within 1–3 miles? Heavy new supply typically softens prices + rents 12–24 months out; constrained supply supports both.
Investment metrics
- 1% rule
- 0.83% ✗
- Cap rate
- 5.96%
- Cash-on-cash
- -1.20%
- DSCR
- 0.95
- GRM
- 10.0
CMA / ARV
No comps found within radius.
Projected returns pro-forma
-3.0% appreciation · 3.0% rent growth · sell at horizon
- IRR
- -18.3%
- Equity multiple
- 0.36×
- Total profit
- $-52,493
- Equity at exit
- $43,523
- IRR
- -10.5%
- Equity multiple
- 0.36×
- Total profit
- $-52,312
- Equity at exit
- $25,238
Cash invested: $81,732 (down + closing). Projections, not guarantees.
Landlord ↔ Tenant lean methodology
- Overall (STATE)
- 82 Strongly Landlord-Friendly
- State North Dakota
- 82 Strongly Landlord-Friendly · R+20
- County
- — inherits STATE
- City
- — inherits STATE
ZIP-level market 58047
- Active inventory
- 458
- Price-to-rent
- 10.0×
Monthly cashflow live
- Estimated rent
- $2,437 medium interval (Pro) →
- Mortgage (P&I)
- −$1,531
- Tax from tax record
- −$355 /mo · $4,260/yr
- Insurance
- −$122
- HOA
- −$0
- Vacancy / Maint / Mgmt
- −$512
- Net cashflow
- $-82
Break-even live
UW: 25.0% down · 7.5% · 30yr · 1.5% tax · 5.0% vac · 8.0% maint · 8.0% mgmt
Financing live
Cash to close
- Down payment
- $72,975
- Closing costs
- $8,757
- Reserves months
- —
- Total cash needed
- —
Loan-product check · same deal, 3 products live
Conventional
25% down · 7.5% · 30yr
- Down + closing
- —
- Monthly P&I
- —
- Monthly cashflow
- —
- DSCR
- —
- Eligible?
- —
Personal DTI + credit; lowest rate.
DSCR
20% down · 8.5% · 30yr
- Down + closing
- —
- Monthly P&I
- —
- Monthly cashflow
- —
- DSCR
- —
- Eligible?
- —
No personal income docs; deal must DSCR.
Hard money
10% down · 12.0% · 12mo
- Down + closing
- —
- Monthly P&I
- —
- Monthly cashflow
- —
- DSCR
- —
- Eligible?
- —
Short-term bridge; refi at stabilization.
Rent comps 4 comps
| Address | Beds | Baths | Sqft | Rent | $/sqft | DOM | Units | Dist |
|---|---|---|---|---|---|---|---|---|
| 806 United Dr Unit 1 Horace, ND | 4.0 | 3.0 | 1856 | $2,275 | $1.23 | 13d | 1 | 0.15mi |
| 7994 Jacks Way Horace, ND | 1.0–2.0 | 1.0–2.0 | 898 | $1,599 | $1.78 | 13d | 16 | 0.69mi |
| 6761 71st Ave S Horace, ND | 3.0 | 2.0 | 1790 | $2,195 | $1.23 | 21d | 1 | 1.35mi |
| 6874 68th St S Horace, ND | 3.0 | 2.0 | 1396 | $2,150 | $1.54 | 21d | 1 | 1.49mi |
Listing history 18 events
-
2026-06-18days on market $291,900 Active 20 DOM
-
2026-06-17days on market $291,900 Active 19 DOM
-
2026-06-16days on market $291,900 Active 18 DOM
-
2026-06-15days on market $291,900 Active 17 DOM
-
2026-06-14days on market $291,900 Active 15 DOM
-
2026-06-13days on market $291,900 Active 14 DOM
-
2026-06-10days on market $291,900 Active 12 DOM
-
2026-06-09days on market $291,900 Active 11 DOM
-
2026-06-08days on market $291,900 Active 10 DOM
-
2026-06-07days on market $291,900 Active 9 DOM
-
2026-06-05days on market $291,900 Active 6 DOM
-
2026-06-03days on market $291,900 Active 5 DOM
-
2026-06-02days on market $291,900 Active 4 DOM
-
2026-06-01days on market $291,900 Active 3 DOM
-
2026-05-31days on market $291,900 Active 2 DOM
-
2026-02-10$285,900 Active
-
2026-02-06historical
-
2025-10-29$285,900 Active
ⓘ Source: listings_history table (triggers on properties + properties_extension) + one-shot
backfill from property_details.listing_events for pre-trigger history.
Tax reassessment forecast ND · Resets to sale price
- Current annual tax
- $4,260 · $355/mo
- Projected year-2 tax
- $4,260 · $355/mo
- Expected delta
- $0/yr ($0/mo · 0.0%)
ⓘ Screening estimate from a state-policy table — verify with the county assessor before closing.
Nearby sold comps map
Loading sold comps map…
Walkable amenities ~0.75 mi
Loading nearby amenities…
Taxation est. · year 1
- Rental income
- $29,245
- − Mortgage interest
- −$16,351
- − Property taxes
- −$4,260
- − Insurance
- −$1,460
- − Repairs & maintenance
- −$2,340
- − Management
- −$2,340
- − Depreciation
- −$8,492
- Taxable loss
- −$5,995
- Est. tax savings @ 24.0%
- +$1,439
- After-tax cash flow
- $455/yr
For passive investors: Depreciation is non-cash, so a rental often shows a tax loss while cash-flowing — sheltering income. Rental losses are passive: they offset passive income freely, and up to $25,000/yr can offset ordinary (W-2) income if you actively participate and your MAGI is under $100k (phasing out to $0 by $150k); unused losses carry forward. On sale, claimed depreciation is recaptured at up to 25%, and gains may owe capital-gains tax (a 1031 exchange can defer both). Figures are a year-1 estimate at your 24.0% rate — not tax advice; consult a CPA.
Condition & rehab AI · 12 photos
This home is in excellent condition with no visible repairs needed. It has a good curb appeal and interior layout, making it a great investment opportunity.
Value-add opportunities
- Both Paint interior walls — Fresh paint enhances curb appeal and interior aesthetics
- Both Install new flooring in bathrooms — New flooring improves aesthetics and functionality
- Both Install new lighting fixtures — New lighting enhances curb appeal and interior aesthetics
- Both Landscaping and plantings — Landscaping enhances curb appeal and adds value
Renovation cost estimate screening
Value-add ROI direction
- Both Paint interior walls — Fresh paint enhances curb appeal and interior aesthetics ↑
- Both Install new flooring in bathrooms — New flooring improves aesthetics and functionality ↑
- Both Install new lighting fixtures — New lighting enhances curb appeal and interior aesthetics ↑
- Both Landscaping and plantings — Landscaping enhances curb appeal and adds value ↑
ⓘ Cost ranges are severity-bucket heuristics (US national rule-of-thumb). Get contractor quotes + a written scope before underwriting a rehab budget.
Schools (NCES district)
- District
- West Fargo 6
- NCES district ID
- 3819410
- Math proficiency
- 41% ▼ -10.00%
- Reading proficiency
- 42% ▼ -10.00%
- Median HH income
- $58,914
- Composite
- 36.6/100
- National rank
- #4628
- State rank
- #26 of 53 in ND
Livability — Horace
- Score
- 74/100
- State rank
- #29
- US rank
- #4718
Category grades
Schools grade is shown separately in the Schools card above.
Census & demographics
- Census place
- Horace, ND
- County
- Cass County · 177,143 people
- City population
- 5,636
- Metro
- Fargo, ND-MN
- Population (ZIP)
- 5,636
- Household income
- $142,361
- Rent vs Own
- Severe rent burden
- 8.0
Population outlook (Cass County) Hauer SSP2
- Today (2025)
- 223,771 people
- By 2030
- 251,835 · +12.5%
- By 2040
- 311,816 · +39.3%
- By 2050
- 378,694 · +69.2%
- By 2075
- 571,386 · +155.3%
- By 2100
- 769,727 · +244.0%
Race, ethnicity, and origin ACS 2023
- Neighborhood character
- Predominantly White (89%)
- Race & ethnicity
- White 89% Hispanic / Latino 6% Two or more races 4% Black 2%
- Hispanic origin (detail)
- Mexican 4% Puerto Rican 2%
- Common ancestry
- Portuguese 26% Scotch-Irish 7% Lithuanian 4%
- Foreign-born
- 2% · Canada
- Languages at home
- 95% English-only · Spanish 4%
Political lean MEDSL · Cass
- 2024 margin
- Lean R (+8.4) · D 44.9% · R 53.3% · Other 1.9%
- 2008→2024 swing
- -15.5pp toward R · 2008: 7.1pp · 2024: -8.4pp
- All cycles
- 2024: R+8.4 2020: R+2.7 2016: R+10.7 2012: R+3.0 2008: D+7.1
Not yet ingested
- Civics
- —
Market trends
- HPI YoY
- ▼ -113.83%
- Current HPI
- 178.7028
- Rent YoY
- —
- Metro
- Fargo, ND-MN
- State GDP YoY
- ▲ 2.09%
- F500 in state
- 2
Industry mix (Fortune 500 HQ in ND)
| Industry | F500 HQs | Revenue |
|---|---|---|
| Utilities / Construction | 1 | $6B |
|
||
Price history
+0.0% since first listed3 events — show timeline
- 2026-02-10 Listed $285,900 NORTHSTARMLS as Distributed by MLS Grid
- 2026-02-06 Listing Removed — NORTHSTARMLS as Distributed by MLS Grid
- 2025-10-29 Listed $285,900 NORTHSTARMLS as Distributed by MLS Grid
Property tax history
+289.5%/yrLatest (2025): $4,260 · +466.5% YoY. Source: county tax records.
Cash-flow waterfall
monthlySold comps — $/sqft
last 12 mo · ≤1 miLoading sold comps…